Whilst I understood how elevation data plays a pivotal role within GIS, I realised that I knew little about the details and struggled to remember the basic acronyms. This was a gentle push for me to dive deeper into the world of elevation and create a handful of ‘one-stop’ resources that covered the basics. In this blog, I’m going to briefly touch on how elevation plays a role in the ArcGIS platform, supported by a Story Map that proceeds into more detail.
The Acronyms
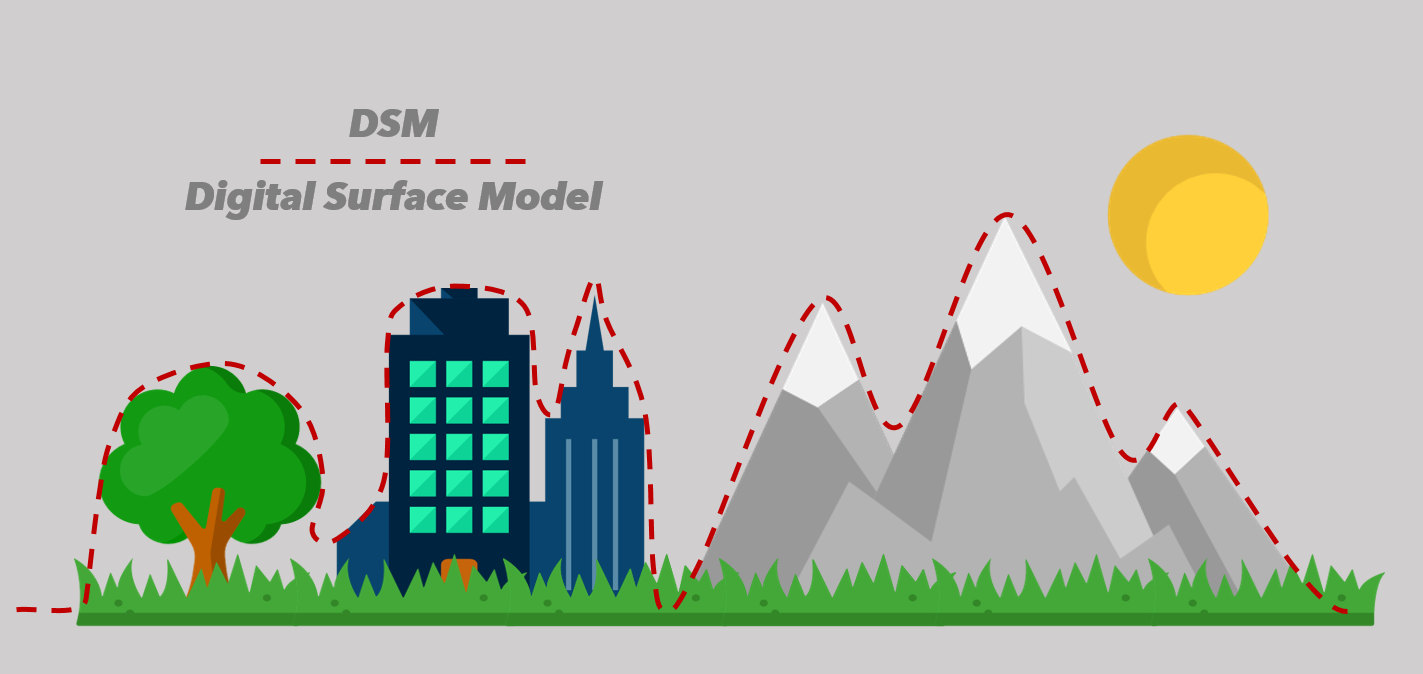
When working with elevation data, you can’t go far without hearing a reference to DSM’s or DTM’s. Personally, I could never remember which acronym was assigned to each definition, so I figured I’d briefly detail them below, assisted with some graphics to help you remember the TLA’s… (Three Letter Acronym’s)
A DEM can be a catch-all for all elevation types, often used interchangeably with DTM and DSM.
A DTM is a 3D representation of a terrain surface consisting of X, Y, Z coordinates stored in digital form. It can be described as a bare earth elevation model – including natural features such as rivers and mountains, but not buildings or vegetation.

A DSM is an elevation model that includes the tops of buildings, trees, power-lines, and any other objects. Commonly this is a canopy model and only ‘sees’ ground where there is nothing else covering it.
Visualisation and Analysis
Elevation can be used in a whole range of useful ways within the ArcGIS platform, primarily visualisation, analysis and 3D.
Visualisation takes the elevation data and allows the user to create a visually engaging map, using only the values for your chosen landscape. This can create maps such as Multi-directional Hillshade (below image) or Aspect Map.
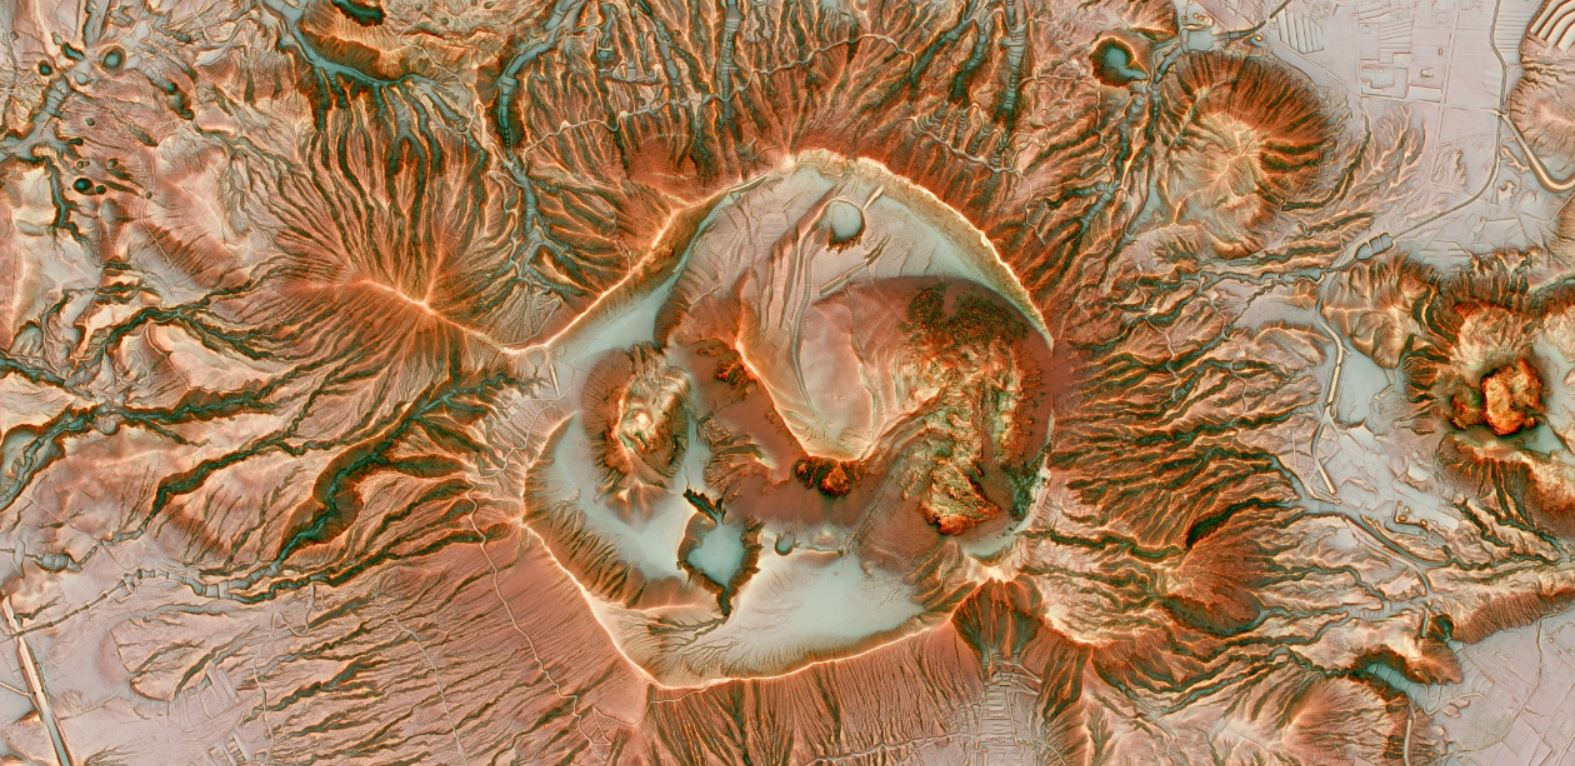
Visualisation of elevation for a Japanese Volcano | source: Maps We Love
Looking beyond the visuals of elevation data, you can start utilising the ArcGIS tools to analyse your data. This approach allows you to conduct some fascinating analysis on your data, such as a Viewshed Analysis (see below) or use within an Elevation Profile web application.
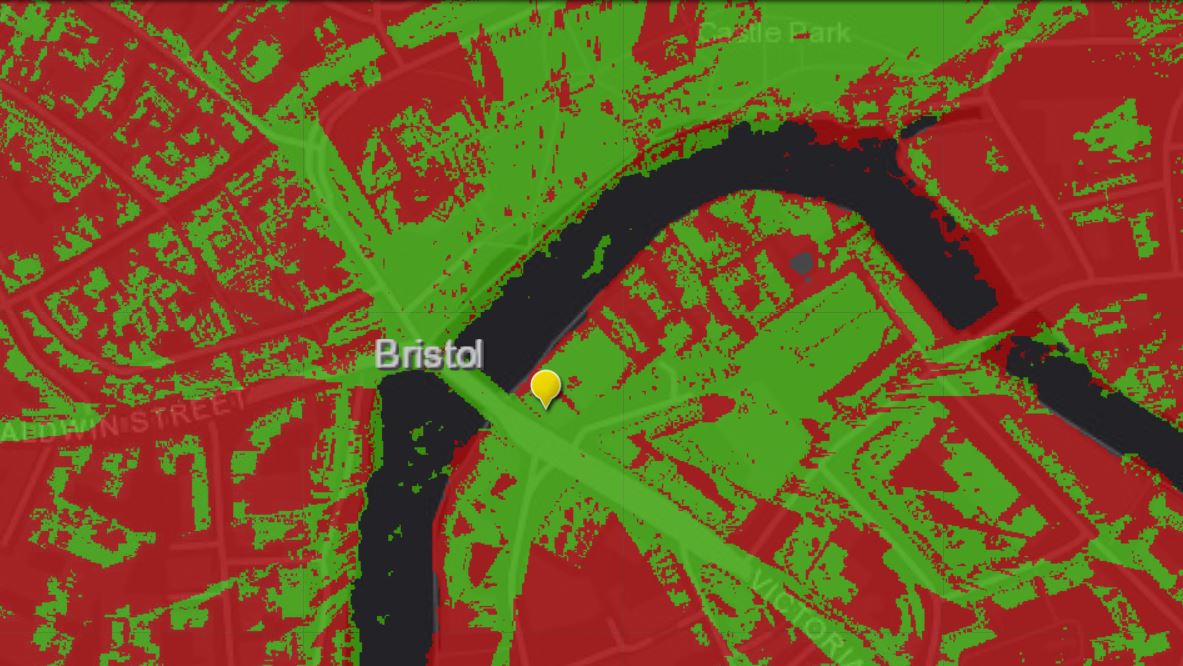
Viewshed Analysis of Bristol City | source: Esri UK
World Elevation Service
Whilst it’s easy for me to talk about all this elevation data, you might be sat there thinking ‘where can I get such data and make full use of this fantastic platform?’ …or something of the sort. Luckily, we have you covered. With your ArcGIS Online subscription, you have access to the World Elevation Service (WES), which is an online, global service of elevation data, right at your fingertips.
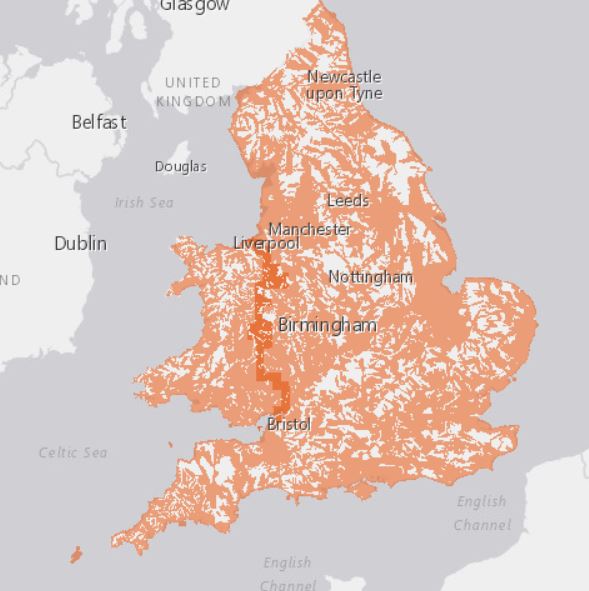
The WES is made up of a variety of elevation sources that all contribute to create a complete layer across the globe. For the UK contributors include organisations such as Environment Agency and Natural Resource Wales and the Ordnance Survey. When added together, this creates a fantastic level of detail in England and Wales that allows ArcGIS Online users to extract the most from elevation data, without having to collate from a handful of different sources.
High resolution, open elevation data is now available for large areas of Scotland through the Scottish Remote Sensing Portal. Keep an eye out for this coming into the WES.
Partners
If you were looking to access specific DTM, DSM or DEM data, then Esri UK have a wide variety of data partners that can provide such a data set. Either a free or premium service, each offers their own unique benefit and allows you to dive deeper into the world of elevation data.
For more details about what products each partner provide and for more details on elevation, click through to the Elevation Story Map! Alternatively, feel free to email content@esriuk.com for further enquires.
![]()