ArcGIS Online underpins the software and assistance that Esri is providing to help organisations worldwide tackle the Coronavirus pandemic. I’ve put this blog post together to provide a quick introduction to getting started with ArcGIS Online - once you’ve activated your account. To get the full picture, read it in conjunction with this blog post on the Covid-19 software package.
But I just want to make a web map.
A map is a presentation of geographic data and the power of a web map is that the map references data that can be updated as it changes. The map always shows the latest version. If you’ve looked at one of the Covid-19 dashboards on our hub site you’ve opened a web app that is showing a web map that is presenting data from a data store. Don’t panic – the point is that there are several pieces to the jigsaw. Now imagine your organisation has several different maps. Where does all that get created and how do I organise it. And I want to make some of the maps secure for a small team? That’s what your ArcGIS Online Organization is about. It provides a portal for creating, managing and sharing the jigsaw pieces.
The Portal
You get a number of user accounts for your portal that you can assign to your team or group. When you login you’ll see something like this:
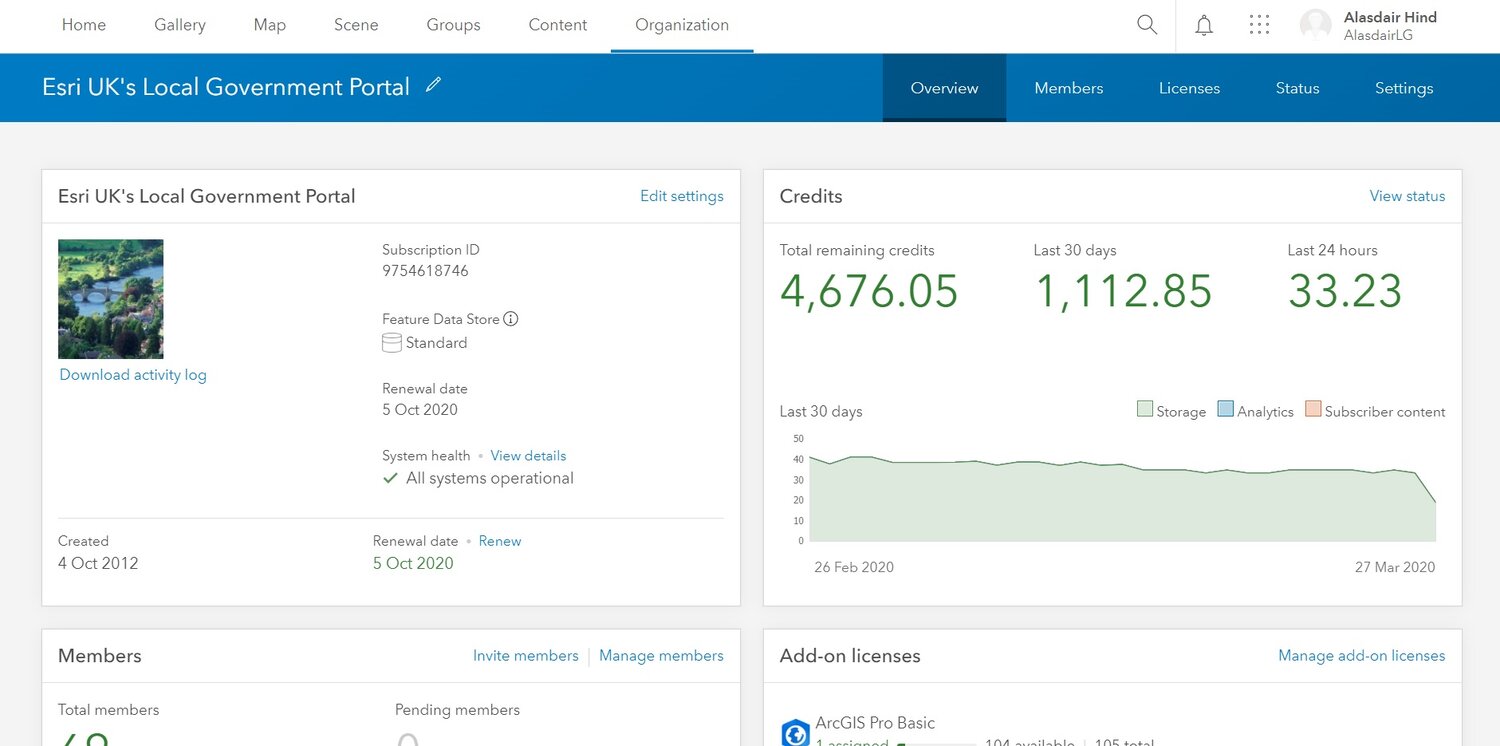
Note: there are different user roles and when the account was set up you’ll have one administrator. The administrator can then add more users but it’s good practice to limit the number of people with full admin rights.
To get started you could either jump straight into creating a map, or you might want to spend a bit of time adding other members and setting up your home page. If users login via arcgis.com they will see the kind of view shown above. If you want people to see a more user-friendly view, set up your home page with a banner image and share the url that will be something like myorg.arcgis.com. Another option is to create a Hub Site (see the companion blog) and share the url to that for people to use to access your data, maps and apps.
You might also want to set up some Groups (more of that later). For more details on any of this the help pages have some great guides.
Making a map
There are two ways to create a map – the most direct is to click Map on the top banner. This will create a new map that automatically includes a basic map – we call these basemaps.

A basemap is a pre-configured map that is included as part of ArcGIS Online. There are a set of different styles of basemaps that are included by default – both global and some UK specific ones (if your organisation was setup with UK as it’s home region. If you can’t find one that matches your needs you can create a custom basemap style from an existing map.
You can pan and zoom the map to view your area of interest. When you save the map it also saves that as the initial view.
But what about the data?
A map is a way to present data in its geographical context, so how do you add data? There are different ways to add your data and it depends partly on the source of the data. Let’s start with a list of addresses.
A list of addresses in a csv file can be dragged onto the map. ArcGIS Online will translate the addresses into a set of points on the map – a process called geocoding:
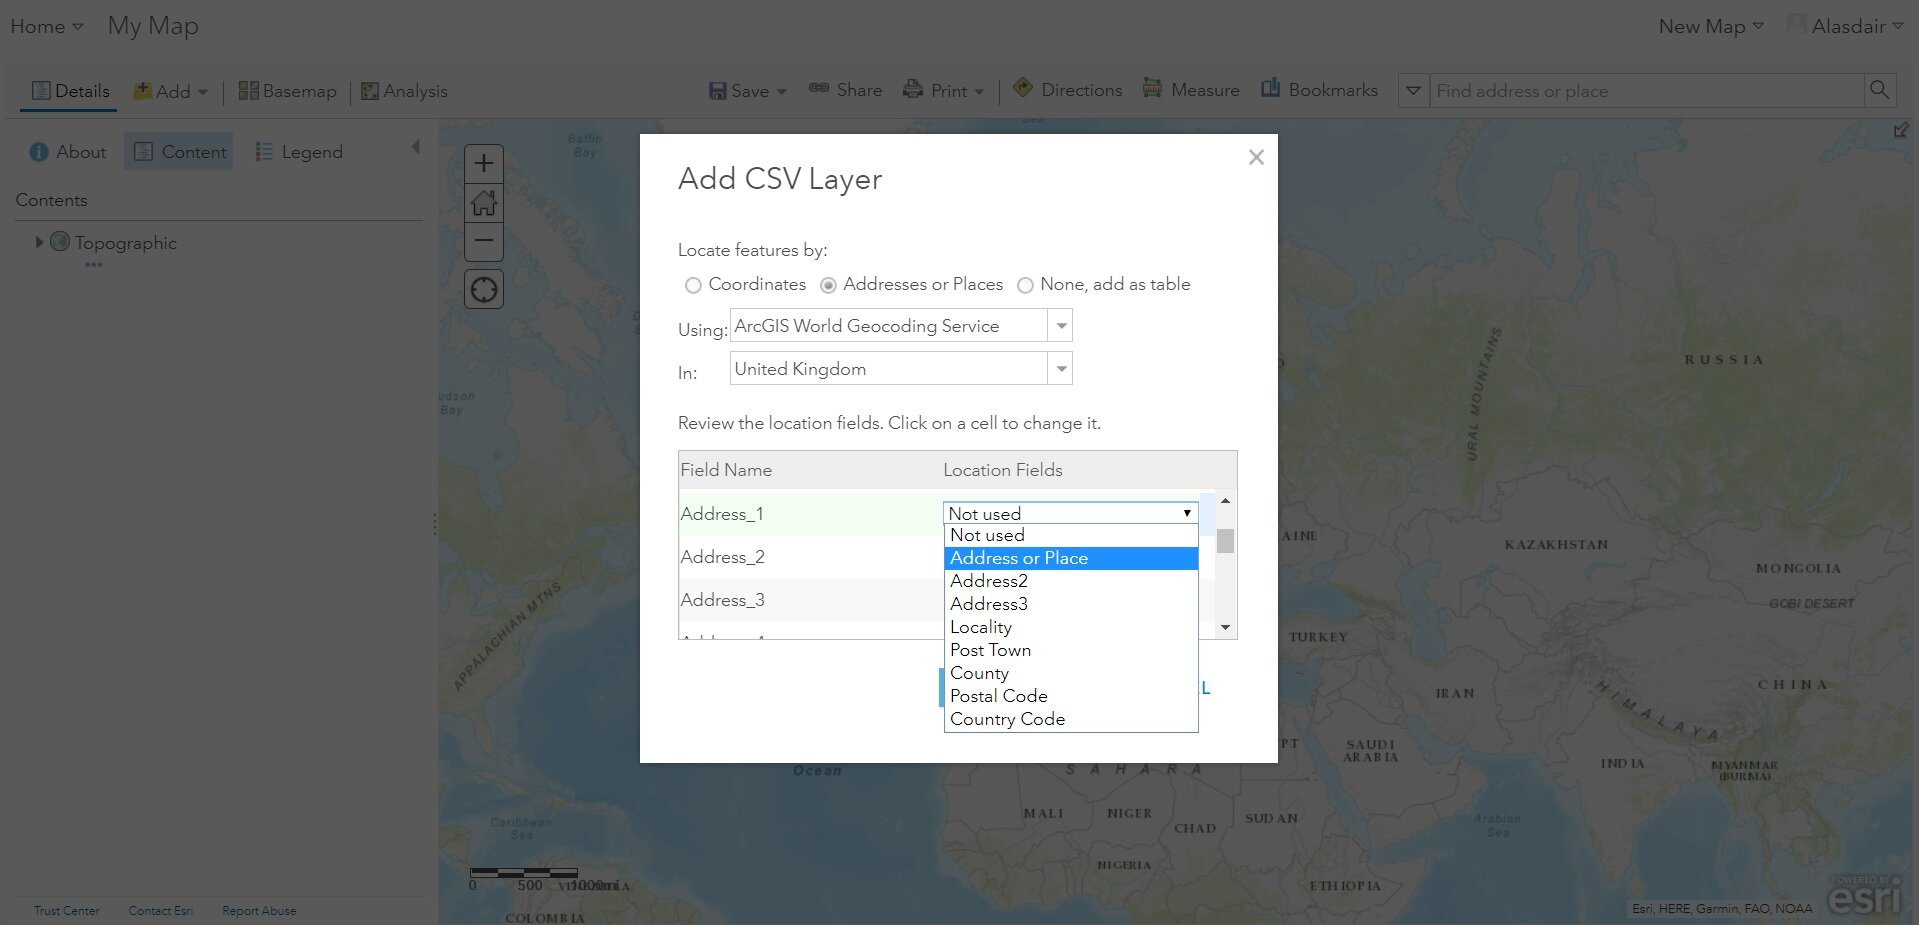
The geocoder uses open data on address locations and won’t match to exact building centres. A dialog will report how many of the addresses were matched. If there isn’t enough information to match it, the record will be given default coordinates and may not be showing in your map. Don’t panic – they’ll either be off the west coast of Africa (0,0 for a global map) or west of the Isles of Scilly (0,0 for British National Grid coordinates). If you make the data editable (bear with me) you can move these by activating them and dragging them on the map. The data is now stored in ArcGIS Online and is made available as a hosted feature layer which can be added to other maps too. Note: data hosting is currently limited to US only.
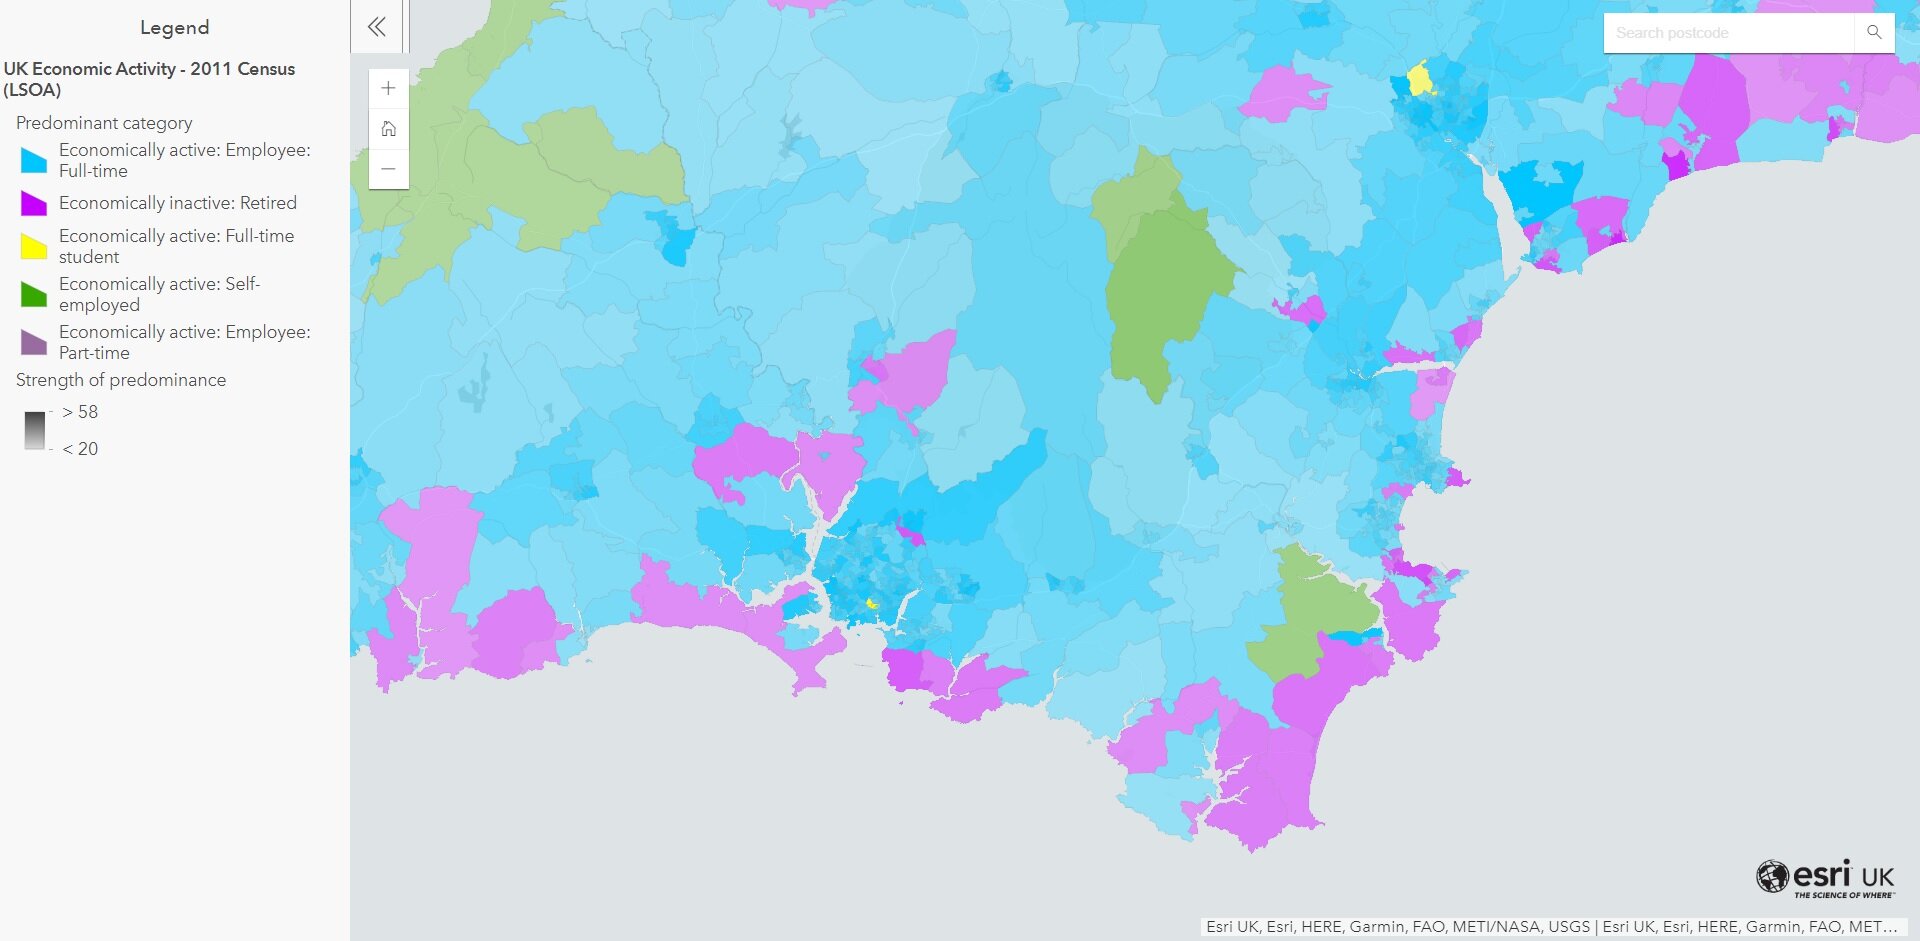
Once you’ve added your data you can change the way it looks on the map, decide which fields will show in the pop-up when you click on a point and add labels. The help pages will take you through these in more detail. By default the data can’t be edited but you can control this through the properties of the layer. All of your data is listed in the Contents view, along with your maps and any apps you have created.
Other types of data
As well as address data, a list of locations with coordinate values can also be added from a csv file. Dragging one of these onto the map will also copy the data to ArcGIS Online and create a feature layer. Data that has already been loaded by a colleague and shared with you – via a layer - can be added directly to a map using Add > Search Layers. This also works for layers that have been made public by other organisations, like the data layers listed on our Covid-19 response site. Another good place to look for authoritative data is the Living Atlas – a curated collection of GIS data.
You can also add data to your ArcGIS Online account through the Contents view – Add Item. If you are using GIS data created by someone else, it may be in a shapefile (the standard exchange format for GIS data) and these are added by this route.
ArcGIS Online allows you to add new data to your layers or edit exiting records. This can be done via the Map Viewer or through a table view in the Item pages. Find out more about enabling and managing data editing here.
A map can contain as many layers of data as you need, though it’s often better to have more than one map if people need to access a large range of layers across different tasks. If your map includes lots of data or layers of polygons (a GIS term for area data) the draw time can become slow as you zoom out and one way to manage this is to set the Visibility Range for the layer. This can also be used as a way to reduce how much of a data set is visible if the user zooms out.
Sharing
Once you have created your map, it’s often best to share it with other people via an app. Don’t worry – no coding required. You can choose an app style from the Configurable App templates – if in doubt the Minimalist is a good starting point.
You can create more than one app that uses the same map, so don’t be afraid to try a couple of different ones and see which is best. Follow the guide in the help. If you want more options on how your app looks and a greater range of capabilities, then take a look at Web AppBuilder. Or maybe you want to create a dashboard style app, in which case you’ll need Operations Dashboard.
One the great things about the way ArcGIS manages data, maps and apps is that (once you’ve got the hang of it) you can easily combine different sets of data (via layers) in different maps for different audiences. For each audience you can choose how the map looks and which fields from your data are visible. You can also choose which app style is best for each audience.
Any new items in ArcGIS Online start off as Private – whether it’s the feature layer you just created from uploaded data, your new map or the app you just configured. Once you are ready for other people to use them you need to decide what level to share them at. ArcGIS Online has a simple but robust security model. You can share your content with the Organization – so that anyone with a user account in your portal can access it.
What if I want the content to be secure and only available to some of my organization users? ArcGIS Online allows you to create groups, invite users to them and use this to share content with a more restricted Group of people.
You can also make your content Public – perhaps the very reason you’re looking at this. ArcGIS Online is a highly scalable system so you don’t need to worry about server load etc. There are still some things you need to be aware of and should double check. Is it ok to share this layer – be particularly careful with personal data and addresses. If there is sensitive data then you might be better off creating an abstracted view of the data and sharing that. Is it ok for all of the data fields to be seen by anyone? If not have you got the pop-up settings correct? If the map is public and might attract a lot of traffic it’s a good idea to check out this guide.
This isn’t an exhaustive guide to getting started with ArcGIS Online, but hopefully it’s given you a sense of what it is and some of the key concepts. I’ve included lots of links to the help pages and these provided a good mix of overviews and step by step instructions. If you want to run through some quick tutorials to get familiar with all this, our education team put together this great introduction.
There are lots of things that I’ve had to leave out of this blog, the analysis functions being a major area. I also haven’t talked about using the mobile apps that interface with ArcGIS Online - but there are a set of links for those at the end of the companion blog on Hub.