 Esri & The Science of Where Podcast
In this episode we welcome two special guests, Addy Pope and Miles Gabriel, to help explore the role that GIS plays in the climate emergency. We uncover the impact that GIS has already had within the conversation of climate change, whilst also looking ahead beyond COP26 and how important GIS will be as our climate changes.


Have any ideas or feedback? Get in touch.
Related Content
Not sure where to start? Check out this series of GIS focused resources to assist in the conversation towards the ongoing climate emergency.

The COP26 science pavilion will be an essential source of the evidence needed to support breakthroughs on mitigation, adaptation, finance and collaboration, to help achieve the goals of the conference.
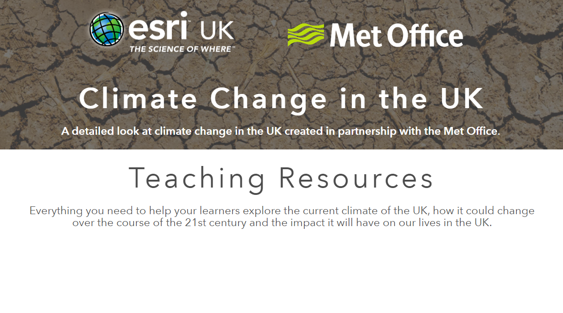
Everything you need to help your learners explore the current climate of the UK, how it could change over the course of the 21st century and the impact it will have on our lives in the UK.
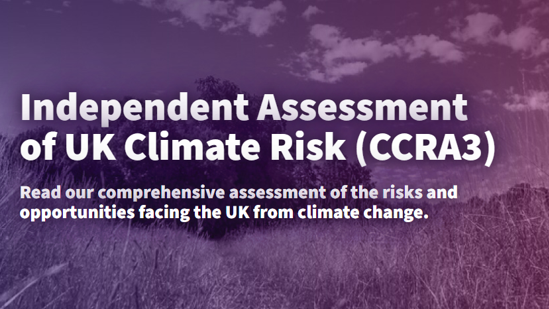
The technical report covers the underlying analysis of the level of risk or opportunity across the natural environment, infrastructure, people human health, built environment, business and international dimensions.
GIS and the climate emergency
Duration: 0:25:24
START AUDIO
Voiceover: The Spatial Jam, an Esri UK podcast.
Miles: I think GIS can certainly make a much bigger impact than it has to date.
Elleni: It also requires collaboration between multiple different decision makers.
Addy: Which may then mean that they become the next generation of research scientists that actually make a difference.
Elleni: Hi everyone, and welcome back to the Spatial Jam. I am Elleni, your host for today's episode. We are going to explore the role that GIS has to play in understanding the impacts of climate change, and to ensure we get the most out of this episode I am pleased to welcome two very special guests with us today.
Addy: Hi, I am Addy Pope. I am the higher education manager for Esri UK and Ireland. I have been with Esri for about seven years, and prior to that I was working for EDINA, at the University of Edinburgh, also in GIS education.
Miles: Hi, my name is Miles Gabriel, I am head of business development within the government team, and I am also the Disaster Response Programme lead for Esri UK. But I am also the account manager for the Met Office, and as their geospatial channel partners, we are jointly investigating how to improve both the utility and the reach of their weather and climate data. So that is particularly relevant to this podcast.
Elleni: Brilliant, and it is amazing to have you both on today. I guess climate change is one of the greatest, if not the greatest, challenge that humanity must face to ensure our collective survival, and science plays a really crucial role in being able to communicate how climate change might impact us. I think we have learned GIS is no doubt a part of that very, very intricate science.
My first question to the both of you is, we know it is really hard to apply this climate change study to the stuff we rely on in our daily lives. Do you think that GIS is a tool that has changed the way we think about climate change?
Miles: So I think GIS has helped, and it has supported. If you search online for GIS and climate change, you will find all sorts of discrete instances where GIS is used in the climate sphere. So it is used for visualisation of climate data. It is used for climate trend analysis and assessing things like biomass and carbon. So certainly it is in use, certainly it has helped.
But I think you know, we need to be very careful not to be arrogant about how useful GIS has been, at this stage. Because we are at a position where COP is around the corner, and COP is targeting countries and bodies and saying, “We are still trying to focus, we are still trying to limit global temperature change to 1.5 degrees.” But at the moment, we are at 1.1/1.2 degrees, with gas emission trends still in an upward trajectory. So for us to say that GIS has made it anything other than a nominal impact, I think, would be overstating it. That said, I think GIS can certainly make a much bigger impact than it has today.
Elleni: That is really interesting. I think there is a lot of complexity within the climate change, not just studies but understanding how it is going to impact us, and what are the adaptation strategies.
Addy, what do you think about that, in terms of, you know, your education background? Do you think that GIS has played a crucial role in changing, maybe, how we think about how we tackle climate change?
Addy: Yes, I would echo what Miles said. The climate models that are being run by climate scientists produce really quite complicated outputs, and they tend to be visualised on a map, because it makes sense, because climate change is going to affect the entire world. But the GIS community hasn’t really, I suppose, got to grips with that climate model output.
We talk about assets and things which are spread out through space, and how they are going to be affected over time. That really is the bread and butter of GIS. It is when we can apply those climate model outputs to our assets and our lives that I think GIS will become increasingly relevant.
You can see a change in the conversation, from this nebulous thing called climate change, which often sounds like it is going to happen to somebody else, somewhere else, but it is actually going to happen to us here in the UK. We are starting to have more impact studies, risk and adaptation, and mitigation studies, and that is really where the GIS can start happening.
I don’t imagine that a GIS team in a university would ever go, “Let’s run a climate model and see what we can do.” I would leave that for the climate scientists. Take their output and start applying it to the stuff that we know and we understand, which is space and time.
Elleni: Yes, so it is almost flipping that use of GIS as a tool on its head, rather than, you know, being an intricate part of that science in modelling climate change, it is a tool that can help to visualise, but then also analyse proximity of certain things. So, for example, sea level rise, the proximity of vulnerable populations towards the coast, all of these sorts of things, where we can bring in those spatial layers, understand that a little bit more, and help to make decisions on what we should do.
So I guess my next question, actually, Miles, I was going to ask you this question; in your space that you have worked with customers, have you seen examples where GIS has been used in that sense? So it has been used to help tackle an impact of climate change, in probably a micro level and in a local level environment?
Miles: I think what I am seeing, which is probably not answering your question directly, but actually is more exciting, is a willingness and an understanding that taking a more spatial perspective on climate could actually have massive benefits. So the work we are doing with the Met Office, as I said, is about looking at how do we take climate data, and also weather data, as Addy said, that really complex scientific data, that is incredibly difficult to create, incredibly complex, and actually quite difficult to understand... It is currently largely released in scientific formats, via scientific APIs, etc., etc. For most organisations, whether government, commercial, etc., that might have a GIS team, they are really struggling to access that data.
So what we are looking to do is to support the Met Office, as their geospatial channel partner, and see whether putting a spatial perspective on it can really put a rocket up the ability for GIS to support. So if we can release climate data, as geospatial services, that means that GIS can play its role. GIS is brilliant at being an interoperable solution. It allows you to bring together completely discrete datasets into a solution that includes geography, so you do not need your common keys, you do not need some database way of joining data together, geography gives you that capability.
If you can bring in climate model data, and you can bring in information about what you are trying to apply that climate understanding to, your assets as a business, but you can also bring in reference geographies at an appropriate scale… So if we go back to your example, about flood levels, we can bring in the climate predictions, we can bring in the current sea levels, and we have got detailed enough reference geography that we can see what a 5cm rise in sea levels will do, geography and GIS can then play their role, which is they can help to allow organisations to understand the impact on them, on their assets, on the things that are important to them. So I think that is where GIS should do what GIS does well, which is integrate disparate data, allow it to be visualised, allow it to be modelled and allow it to analyse against business data.
Elleni: Definitely, I think everything that you have said there, kind of, points towards this is a very complex problem, it involves a huge amount of disparate data sources that do not have a centralised source at the moment, and unlocking that is, potentially, a way of unlocking GIS to play that role in understanding those impacts. So it is really interesting to hear you talk about those challenges that are actually there in allowing us to use GIS as a tool to combat the impacts of climate change.
One of the things I am hearing as well is the accessibility of it. You know, there have been a lot of examples that I have seen, where public data science or citizen science has been used as a tool as well, alongside GIS. It is about making that tool accessible in order to generate that kind of change and generate that influence that we can have in our local communities, but also on a global scale as well.
So, Addy, really interesting to take this back a step and think about, actually, the next generation of users of GIS, you know, starting in education, starting in university, they are going to have a huge, huge impact. Arguably, now they should be looking at these sorts of things and being able to use the tools that we have available. What do you think needs to change? Or what do you think the future of GIS is in climate education?
Addy: Well, I think the fundamental thing with the next generation, are they getting called Generation Zero now? I have heard that being bandied around with COP. If they are the generation that are going to take us to net zero. The important thing is to make sure that they all understand what climate change is and how it will impact lives, both in the UK and wider.
I think the UK has got quite a temperate climate. You know, we have got nothing extreme in the UK, so the changes that we will see will not be the extremes. That does not mean that we need to take our foot off the gas, a really bad analogy there, using gas as an analogy. But we should’nt let up on our mission to get to net zero.
But specifically with GIS, it is about access to data. But it is not about access to data, is it? Because if we think about data, data is gold, but is it useful and usable? Probably not. So we often talk about the transition from data to information, and then that transition from information to knowledge. I see GIS really being the interface between data and information. And if you are good at what you do in your GIS, you can make an output, which might be a map, which then allows non-expert users to extract knowledge from the map, from that information.
If we look at the problem that we have probably got with climate science is that the outputs that come out are already visual, they are already maps, but if you want to get access to the data, the data is very complicated. So there is kind of a gap, and it is not really in a teachable format for your average school teacher, let alone your fledgling GIS student who has had 10 weeks of GIS training in a product probably beginning with Arc. So how do you make that data accessible and usable, so as they can take their enthusiasm and their passion about climate and sustainability, and translate that into the knowledge and skills themselves, which may then mean that they become the next generation of research scientists that actually make a difference to the future of life on planet Earth.
So what we have been doing is, we have been working with the Met Office’s education team to try and take some of the quite complicated climate data from the UK CPA team, and make it accessible and teachable within a schools’ environment. So we the schools as almost the lowest common denominator. I do not mean that in a bad way. But if you can make the data accessible to a 12-year-old or to a school teacher, then anybody can use it, with the exception, probably, of my dad, who would probably still break it. But, you know, I mean, joking aside, if you can get it into schools then what can the teachers do to inform the next generation of what is going to happen?
Because the scary thing is, you know, we are talking about net carbon zero, but if we had net carbon zero tomorrow, which is not going to happen, we would still probably have 20- or 30-years’ worth of climate change happening. So we have to plan for that climate change. We have to mitigate the climate change, which is locked into the system.
This goes back to Miles’s point, if we think about the organisations that Esri works with, in the UK and globally, those organisations are waking up now to the realisation that they need to do something to understand the exposure that they have got to locked in climate change, at the same time as society is trying to work out how it reduces its impact of its contribution towards climate change, over the next 20 or 50 years, which will be from 2050, those manifestations will be from 2050 to 2100.
If you look at the climate models from the Met Office, the model scenarios from actually doing something to carrying on as we are now, the models diverge at 2050. So we have to do something to get to net carbon zero, around about 2050, in my opinion, but I am not a climate scientist, this is just stuff I have been reading.
Elleni: That is incredibly interesting, and just understanding how we make useful information available in the hands of schoolchildren, and the general public, really, that do not have that climate science knowledge, or to the customers that we work with that want to understand how their supply chains are potentially impacting climate change, how all of these interconnected factors are impacting their own businesses as well. So it is really interesting to hear you talk about those sorts of changes that you are working with the Met Office, making it more accessible. I think it is going to be really exciting to see what comes out of that. So thank you, Addy.
Addy: I would add to that as well that part of the work, if you imagine what would happen in a normal teaching scenario, maybe 10 years ago, maybe when you were at school, you would probably have a textbook, and in that textbook there would be a map of the UK, it would have some sort of colour gradation across it, and it would be looking at a climate projection. It is 10cm high, and you are going, “I wonder what it is like where we live?” and then you look in and it is like, “I cannot really tell what colour it is,” and I am looking at the key…
We know that ArcGIS Online gives you a much more interactive tool, and the work with the Met Office was really to take their really, really powerful data and make it into an interactive tool where teachers could look at the UK as a whole, and then they could focus in on, you know, Grimsby or Aberdeen, or wherever the kids were. They can then see what the climate change will be where they are, and where they fit within the spectrum of the UK. Ultimately, you could then scale that out to the whole world, and you can then show them what the impact will be where they are, and what they will have to do to adjust. But what will it be in Melbourne and Australia? What will it be in Delhi? How will people's spatial variation influence the amount of impact of climate change?
I think it is about allowing the kids to ask and answer their own questions. So if you have enthusiastic kids, with a spark in their brain, how can you give them a tool which allows them to drill in and ask and answer their own questions? You do not really get that from a textbook, but we know that you can have it from an interactive map.
That is really what we have been pushing for, but also then translating in risk and adaptation as well. So, you know, how will our railways be affected? How much more flooding might there be? How will crops be affected by, you know, drought in the summer or just unseasonable rainfall? So that could just be really heavy downpours at the worst possible time, just after you have planted the seeds, or when you have got very small saplings or seedlings, whatever they are called, I am not a farmer either…
Miles: So just to add to what Addy saying, I think that, you know, what we have been talking about thus far is really using GIS to evaluate the impacts, getting that data out in an accessible format, using the power of GIS to bring it together with reference geography and asset information, whatever that asset type is, whatever that business data is, to evaluate impacts and assess risk on that organisation, or that part of the country, or that local area.
But I think once people start using GIS in these ways, what will become very clear is that they can also use GIS to start looking at planning for mitigation and adaptation measures. So we will have to start planning for adaptation. As Addy said, climate change is happening, it is going to continue happening, even if we got to net zero tomorrow, which we will not, it will continue happening for the next 30 years, and there will be significant impacts from climate change. How do we as organisations, how do we as a country, how do we as communities adapt to that?
For example, should we be looking at measured retreat from coastal areas? And if so, how do we do that by protecting life and livelihoods of people that live there? If we are looking at energy network assets, for example, how do we better protect those assets, if we know that we are going have more extreme weather, if we know we are going have flooding?
So we can start taking and assessing those adaptation measures, and then, beyond that, I think if organisations, communities, and government bodies are starting to assess impacts, and assess what they need to do to adapt to those impacts, it will definitely encourage people to start thinking, “We need to do more. We need to do more to mitigate the impacts of future climate change.”
So what else can we do to, hopefully, reduce the level of adaptation that we are going to need to do? So can we start using more solar? Can we start reducing our carbon footprint? Can we do X, Y, and Z?
But I think once people have the data, and a tool that allows them to assess impacts that will worry them directly, rather than being a global issue it will be a local issue to them, it will allow them start looking at adaptation, which, for businesses, will be costly, and even for governments will be extremely costly. And once people realise the impact on them, then they start looking at mitigation seriously and say, “We need to do a lot more of X, Y and Z.” I think GIS can play a role in all of those areas.
Elleni: Definitely. I think the key thing that I have heard from both of you on this episode is GIS is a tool, definitely, that can have an influence in how we understand climate change, how we understand those mitigation efforts. But, ultimately, it is that person driving the tool to develop that change. It requires people to be concerned about it. It also requires collaboration between multiple different decision makers, multiple different authorities, businesses, all of those sorts of things in between.
So probably my final question to put to you both, just to make sure that that our listeners have something to go away, and maybe read and learn more about some of the topics we have touched on today. If you were to suggest one key resource to learn more about this, what would it be?
Miles: I think, from my side, there would be a couple of things. One would be, as Esri we have just launched a new climate change page. But it is a very strong focus for Esri, and climate will be a cross cutting theme across everything we do going forward. But certainly, that climate change page is where we will start publishing more and more resources about how GIS can support.
The other thing I would point people to is everything that is going on with COP. So within COP we will be presenting alongside the Met Office, in fact, Addy will be presenting the education resources we have developed. There are various other sessions. The KTN geospatial pavilion, that is 12 days of sessions approaching coming up to COP… There is a lot of conversation in that about how geospatial and spaceborne data can support climate change.
So I think the efforts that are going on in the events and the sessions within COP, but then also referencing from our website. Those are the two main resources I would point to.
Addy: Because Miles had more than one, I am going to go for more than one as well. I will probably have three, plus a pearl of wisdom that came my way a while ago. So my three resources…
The first one I would have to plug is, obviously, the resources that the education team at Esri UK has been working on. There are in our Teach with GIS hub, and it is an entire set of resources aimed at school kids. We are tackling key stage two, three, and four, so that is essentially from seven all the way to sixteen. We are showing them climate science, and then the impact and adaptation, as a separate resource.
These resources have been created in collaboration with the Met Office’s education team. So we know that the science is as good as it can be. It has been raked over a couple of times by really passionate climate scientists, and without that input it would not be as strong as it is. Then it has got the ArcGIS engine in there, with lots of dashboards making it interactive.
I would also say that, at the moment, I think if that is in the hands of schoolteachers, they have now got better information than many CEOs of organisations, as to the actual impact that climate change will have on the UK. Because this data, the impact data, comes from an academic paper that was only published in May, and we have hacked the data out of the appendices. I think that is the first time it has been made publicly available in such an interactive format. The authors do know, and we are co-presenting with them at COP. It is fantastic. So finally teachers are ahead of the game, rather than lagging behind waiting for publications to come out.
What was my second one? There is a UK climate risk report, and that is very good. It is broken down into sections, such as transport and energy. There is also a kid's report, which is, sort of, seven PowerPoint slides, which is an amazing introduction if you do not have time to read all the other the other reports. But the UK climate risk report, and they have a website, is fantastic, because it is all about the UK and what we have to do to mitigate the climate change which is definitely heading our way.
The final one is going to be left field, but if you have got a holiday coming up, it is half term or it might have been halftime, read Bill Gates his book on how to avoid a climate disaster. It is interesting. He is an interesting character. It is not a book of doom; it is a book of hope. It says technology is the key to escaping the problem that we are heading towards. So it is a book of hope. They are big problems, but you have to start. I mean, you have to overcome big problems by taking the first step. The first step that we can take is reading somebody else's writings, and he has distilled it down.
What was the last thing I said? A pearl of wisdom…. So I asked an awkward question in a public forum a while ago, and that was: why wasn't GIS necessarily being taken seriously at COP? You know, we have got a pavilion next to COP…. And Vanessa Lawrence answered the question very well. She said, “Do not worry about it, COP is all about politicians talking about things that their governments are going to promise to do. And there is very little space to say anything or be heard at COP. What we, the GIS sector, need to do is wait for the outcomes of COP to come out, for both global and local, i.e. the UK, and work out how we, as a sector, can contribute to making a sustainable future.”
I thought that was a good way to look at it. It is like, “Do not worry. Do not worry we are not at the top table of COP, because we are going to wait to hear what they say, we all know what we need to do, and then we will start doing it, because we know our tools are relevant.” So I thought that was a nice way to look at it.
Elleni: No, that is definitely giving more hope. I think that might have been five.
Addy: Sorry about that. Miles started it.
Elleni: (Laughter) But no, thank you, that has been brilliant.
We will be sure to link out to some of those resources in the episode page on our website.
So Miles, Addy, thank you so much for coming on. Thank you to you, our listeners, for tuning in to the Spatial Jam. We are always looking to improve our podcasts and make them right for you, so if you do have any ideas or feedback, please get in touch at podcast@esriuk.com. And do not forget a subscribe for your chosen podcast channel, it really does make a difference for us. So we will hope you will join us again soon.
Voiceover: The views of the presenters may differ from those of Esri UK.
Addy: Remember, we are not trying to save the world, the world will be fine. It is just we are trying to save ourselves.
END AUDIO