Extreme weather events are becoming more common, more unpredictable and more severe. This is apparent all around the world. The flood events in the UK this winter forced many people to evacuate their homes. With World Water Day 2020 on the 22nd March 2020, we have decided to explore some simple flooding statistics for the UK’s five longest rivers… resulting in this river-themed GIF!
Water know how we made it? Keep wading on…

After reading John Nelson’s ‘Rivers of Plastics’ blog, we wanted to make an interesting visual piece to show our appreciation for the UK’s watercourses. However, it seemed fitting to tide this in with World Water Day 2020 as this year’s theme is ‘Water and Climate Change’!
We used ArcGIS Pro to display the UK’s five longest rivers, analysed some interesting flood data and brought it to you as a GIF!
Anyway, that’s enough context, let’s get to the mapping! I ashore you, it’s worth a read!
FIRST, THE DATA.
Let’s start at the (data) source of the river…
-
Rivers – OS Open Rivers data was imported straight into ArcGIS Pro from the ArcGIS Living Atlas of the World.
-
River Mouths – Open Street Map ‘River shapes’ polygons were downloaded from overpass turbo (a website which allows you to extract Open Street Map data) using the following query: waterway=riverbank or water=river
This returned data for all UK rivers. Next, the data was downloaded in a GeoJSON file and then converted into features using the Conversion tool in ArcGIS Pro. This data was used to show the real width of the rivers.
-
River Basins – HydroSHEDS data (specifically the European Basin data) was downloaded from the World Wildlife Fund.
-
Flood Alert Areas - Environment Agency Flood Alert Areas data was also imported straight into ArcGIS Pro from the ArcGIS Living Atlas of the World.
-
Number of Residencies – the Ordnance Survey's addressing product, AddressBase® was used and sourced through Esri UK’s Premium Content team.
Next, the confluence of data and processing.
The five rivers were analysed separately. A definition query was run on the river name attribute of the OS Open Rivers data to show a specific river, for example, the river Thames. The Open Street Map data did not have a river name attribute, so polygons that intersected with the OS Open Rivers data were selected using the Select by Location tool. This layer was exported as a new layer and visual inspection verified the results. Next, the Dissolve tool was used to combine the multiple river polygons into one single polygon. The relevant individual river basin was exported from the multiple basins layer as a new layer. All tributaries or streams which did not flow into the main river were removed from the map by using the Select by Location tool on all of the selected OS Open Rivers which fell within the river basin.

The projection…
You will probably have noticed that all of our rivers flow west to east. We altered the projection to make the five rivers easier to compare.
We created a new projected coordinate system, based on Equidistant Conic. Then, played around with the Standard Parallel 1 and Standard Parallel 2 values to straighten the river (this requires a bit of trial and error). We also rotated the river to create a false north. If you’re an avid ArcGIS Pro user, you may already know that you can hold down Shift on your keyboard, right-click, and rotate the map (so feel free to use this shortcut to your advantage)! For more lasting change you can also rotate the map by changing the Central Meridian value, making rivers flow west to east!
Now, let’s channel some energy into the symbology of those rivers…
A Hex code of #337E8D was used for the main river layer and the tributaries layer. A 70% transparency was applied to the tributaries layer to make them appear more subtle in the final map.
For the background colour, we added a simple rectangle to fill the page in layout view. We applied an off-white Hex code of #F6F3E9 at full opacity to dull down the sharp white tone, much like a classic styled map.
The river coastlines were made in the Layout view, by tracing the real UK coastline. Two copies of the coastline were made, symbolising one layer using a blue to white buffer gradient and a second layer using a linear gradient of the background colour to transparent.

The Stats!
Thank you for keeping your excitement at bay as we sailed through to here. Now we’re onto the spatial analysis!
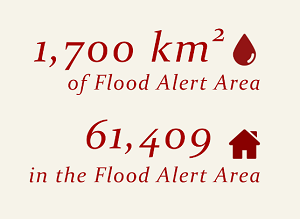
How large are our Flood Alert Areas?
To calculate this, we used the Summarize Within tool to summarise the Flood Alert Areas which fall within each of the River Basin polygons we made earlier. This was repeated for each river, and the Area was our answer!
How many residencies are within our Flood Alert Areas?
To calculate this, we used a definition query on the AddressBase® data to show only residential points and then used the Summarize Within tool again to calculate our output.
We’re getting close to the end now, so I anchorage you to keep reading!
Finishing touches…
Having five rivers, with no spatial context, is challenging to understand. Therefore, we added spatial context by making a new point feature class to show the major cities along each of the river networks. Then we added Town Name labels and used the Convert Labels to Annotation tool to symbolise them in the font type and colour we desired.

Moving rapid-ly on to the overall look and feel of the layout… The title font was imported from the Text Format Gallery, under Water (Large) from our ArcGIS 2D Scheme 2 style. We changed the font colour to match our river blue, helping us to achieve that classic map look and feel. The final additions were the river length and its length ranking.
And what you’ve all been wading for… the GIF!
We used a third-party product, Animated GIF Maker, to overlay the exported layouts of the five rivers. To maintain the flow of the GIF, it was important that all repeated information was kept in the same place on the five river exports. Therefore, we used Guides in the layout view to line up the title, stats and sources.

Have you made your own World Water Day inspired map? We’d love to sea it!
Tweet us @EsriUK to share your creations!