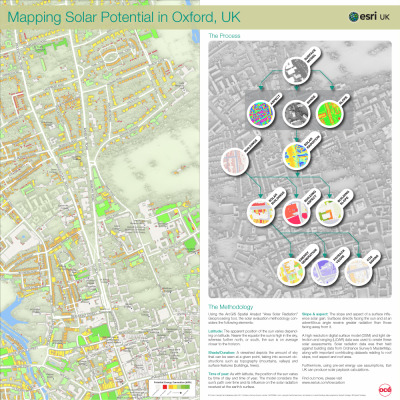
If you’ve recently visited our Office HQ in Aylesbury you may well have noticed a poster proudly displayed in the foyer showing Solar Potential Mapping. I’ve been producing a number of posters showcasing work that Esri UK are undertaking and this is one example. The poster explains how GIS can be used to model Solar Potential as part of some of the Low Carbon work being carried out by Esri UK. This blog article will briefly describe how this poster was created and the main tools which I used.
Please click map for a higher resolution (2.2mb) version in a new window.
The Geoprocessing tools in ArcGIS Desktop were used to undertake all of the necessary calculations and create each layer used within the map. These were then combined with ModelBuilder to process the data for an area surrounding Oxford City Centre, an area which many people are familiar with. The cartography in the main map was produced using a combination of standard ArcGIS Desktop tools, Maplex for ArcGIS, Cartographic Representations and some of the more advanced Cartography tools to perform processes such as simplifying the road system. This combination of tools allowed me to create a very pleasing cartographic output. Each map inset in “The Process” box was also created as separate layer in ArcGIS and exported as individual images.
For this poster I was keen not only show the interesting mapping outputs generated from calculating solar potential, but also to explain the broad process behind how to create these outputs. I hand sketched numerous layouts before deciding upon the one presented in the final poster. The layout of this poster, in particular the complexity I wanted to use in the process section, helped with my decision to use Adobe Illustrator for the final poster production.
All of the insets, logo’s, titles, drop shadows, arrows, and text placement were carried out in Illustrator.
The process flowchart/diagram was also constructed in Abobe Illustrator. I was particularly keen that the round insets maps acted as “magnifying glasses” through to the appropriate layer of interest. This visually represents the power of a GIS being able to peel away layers of information to reveal more interesting data! All of the map layers and cartography for these were produced in ArcGIS and exported as TIFF images and then all placed in Illustrator. I used the greyscale duration layer as a basemap to add context mainly because I thought the output was so visually interesting! The geography of each “magnifying glass” matches the geography on the underneath.
There are various different options for interoperating mapping between ArcGIS and Illustrator. For the purpose of this poster though I exported the maps out as high resolution images and then placed them into an Illustrator document. I decided to use this method mainly due to simplicity and I didn’t want to modify any of the cartography within Illustrator. However, it is possible to export to Adobe .ai format from ArcGIS which is another option for working between the two applications. This will give you more control over the exported features so you can modify the elements in Illustrator rather than exporting just an image. If you decide to export from ArcGIS to .ai then there are a number of issues to be aware when creating your Map Documents (MXD’s) prior to exporting. These include not using transparency in your layers and also not nesting your layers in the Table of Contents.
