We featured a basic digital twin in our 2024 Scottish Conference, but for this year’s Annual Conference we wanted to extend it to something extra special (and a little bit risky) to highlight the value of digital twins. Many of you will have seen the results in our conferences – starting with the closing plenary at the Annual Conference.
A digital twin is a virtual model of a real-world system, that can be used to simulate various scenarios. A digital twin of a car, for example, could be used to simulate how each component would respond to the stresses and strains of a life on the road. By analysing this in the digital world, we can identify potential failure points and take steps to mitigate them before they occur in the real world.
A spatially enabled digital twin is, as you can imagine, the type of digital twin we come across most in the GIS world. As the name suggests, these models incorporate geography as the link (or foreign key) to integrate multiple systems such as utility networks, transport infrastructure, and weather systems into a unified digital environment. The spatial dimension allows us to model complex interactions between systems and combine datasets that, with any other index, might seem un-combinable. After all, everything that exists in the physical world has a location.
From map to model
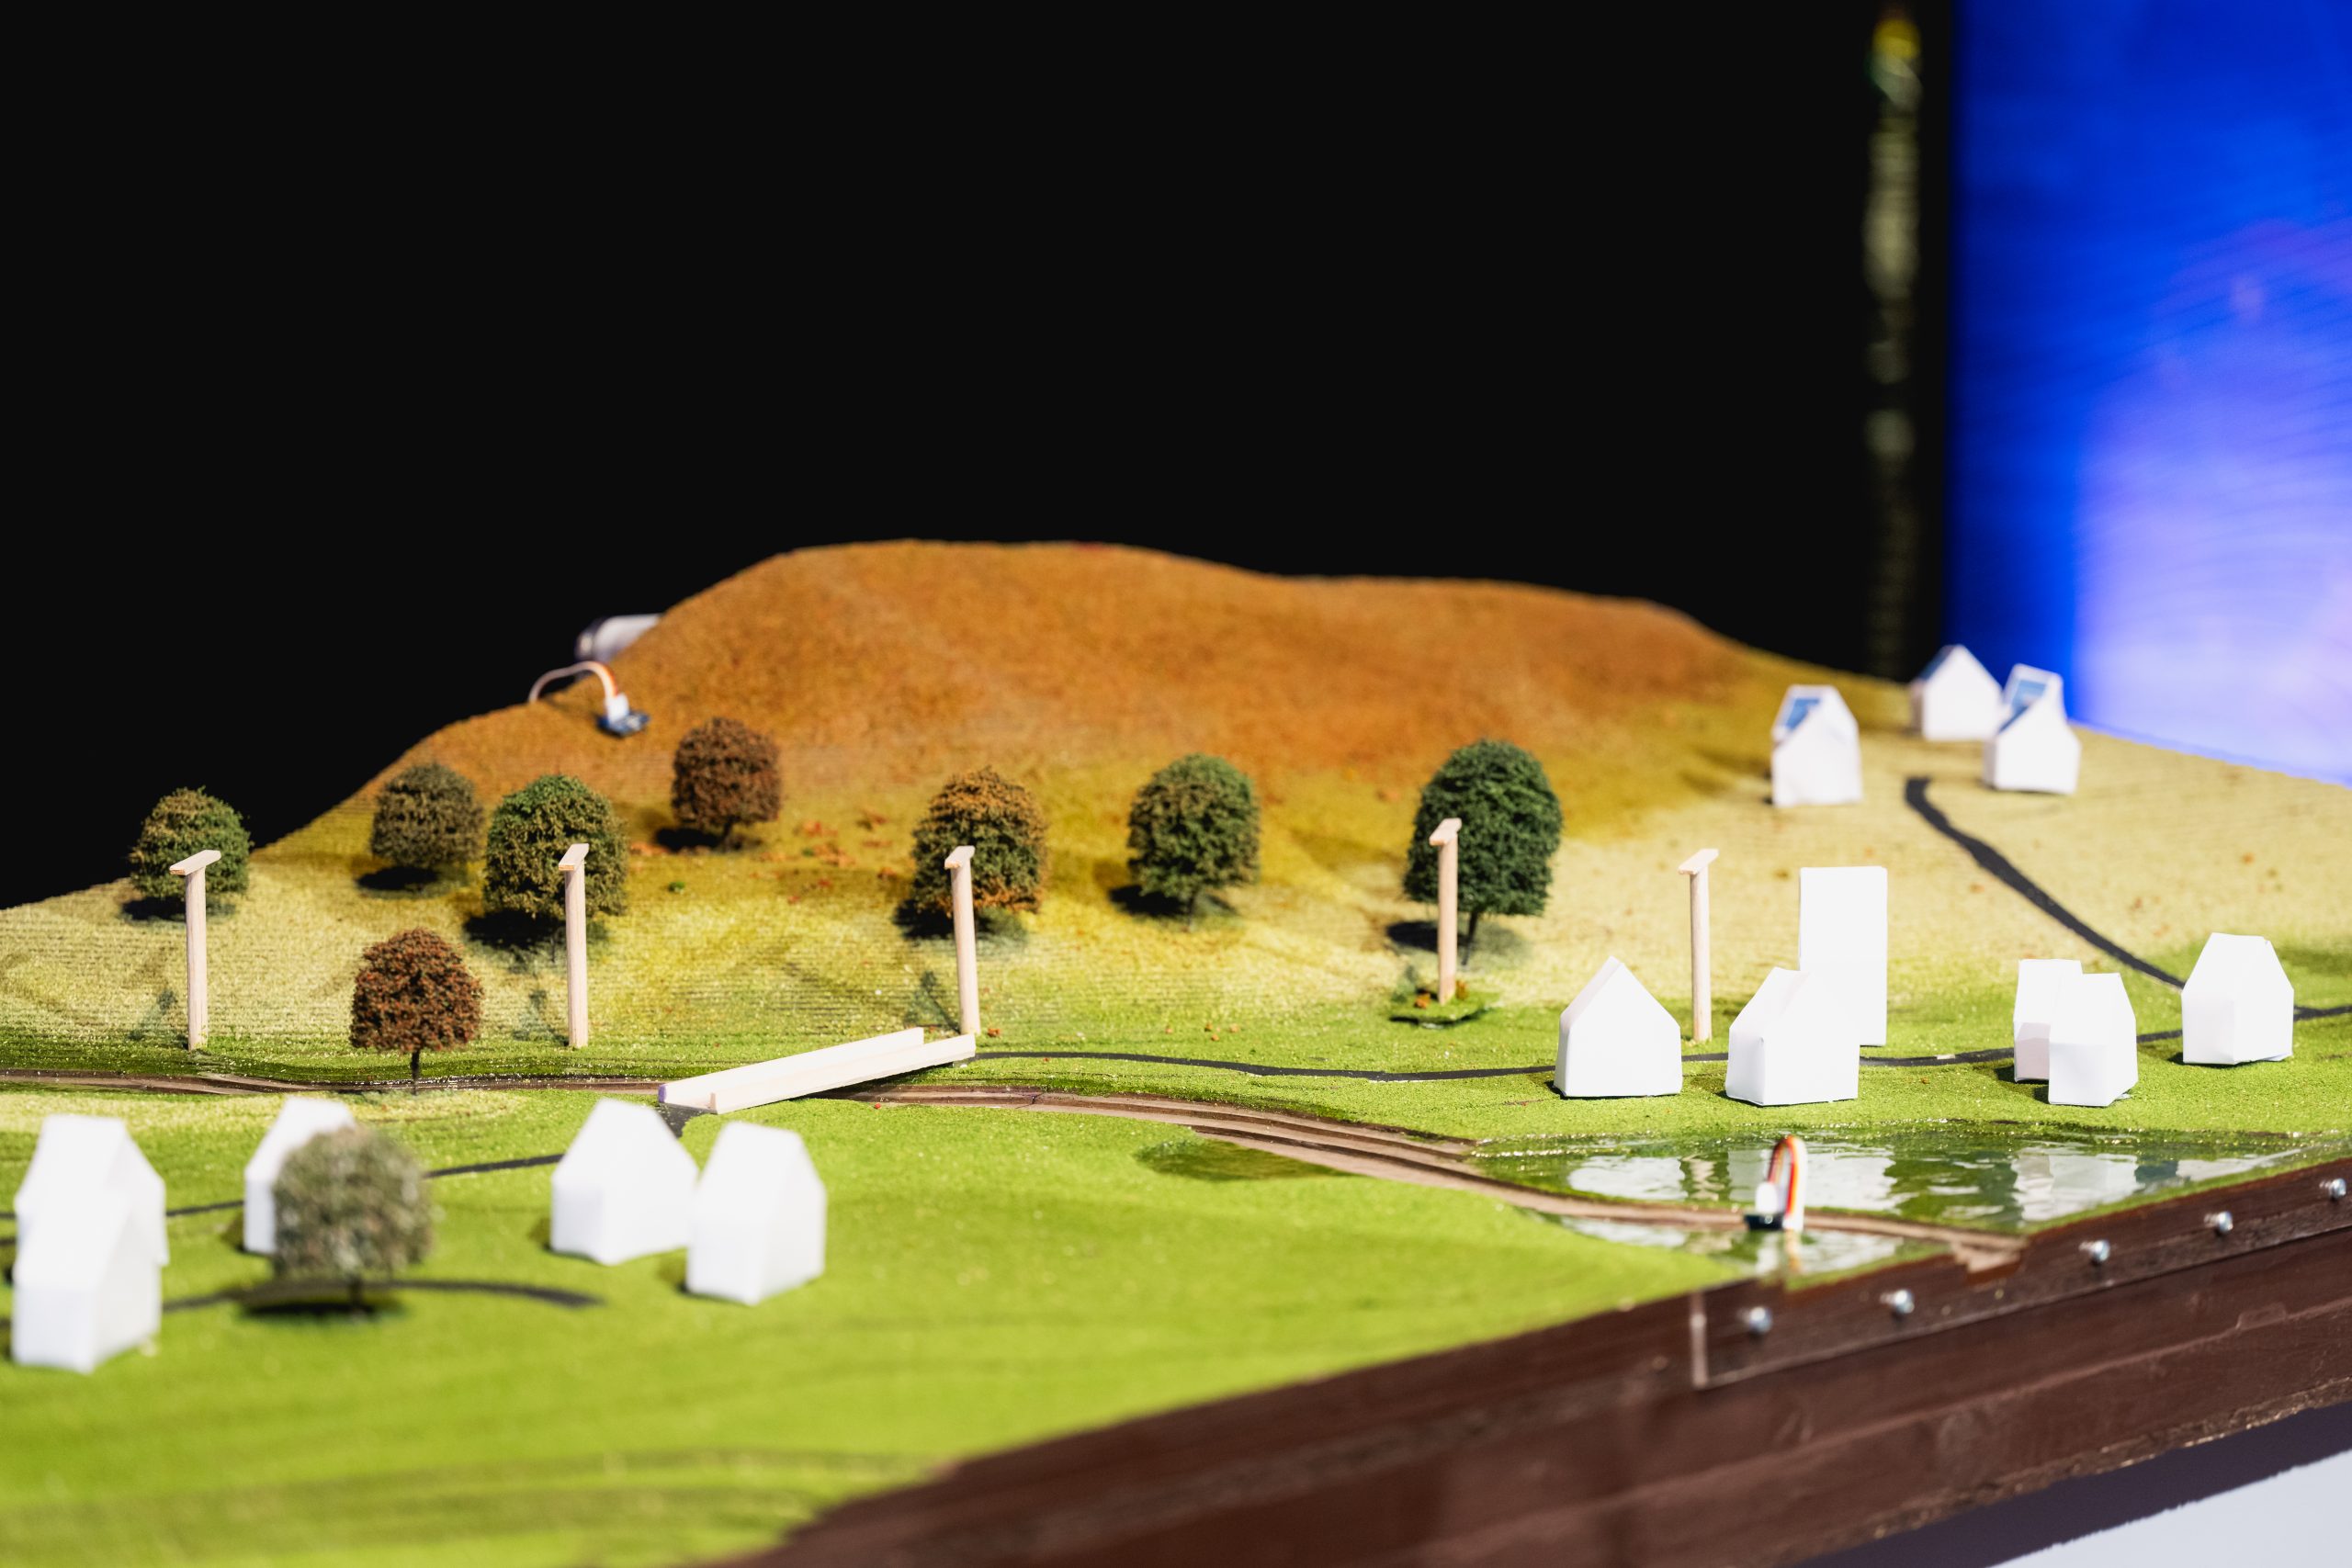
To help bring this concept to life and demonstrate the value of a spatially enabled digital twin, we built something physical: a detailed model of an area in the Scottish Highlands – our very own topographically-accurate model village.
The model featured terrain derived from LiDAR data and vegetation that matched real-world distribution. The roads and neighbourhoods reflected those you would find in the actual area, and it even had its own power network. During the conference demo, we put the model to the test by simulating a storm. Sensors embedded throughout the model allowed us to track and visualise the storm’s impact through a connected digital twin.
In this blog, I’ll take you behind the scenes of the construction process and highlight some of the key technologies featured in the demo. You can watch the full demo recording here. And if you’re curious to learn more about digital twins in the real world, then there is a wealth of examples over on our website
Building the Terrain
The model was built using layers of Greyboard (a thick card made from recycled paper pulp), with each layer representing a contour layer derived from Scottish Government LiDAR data. 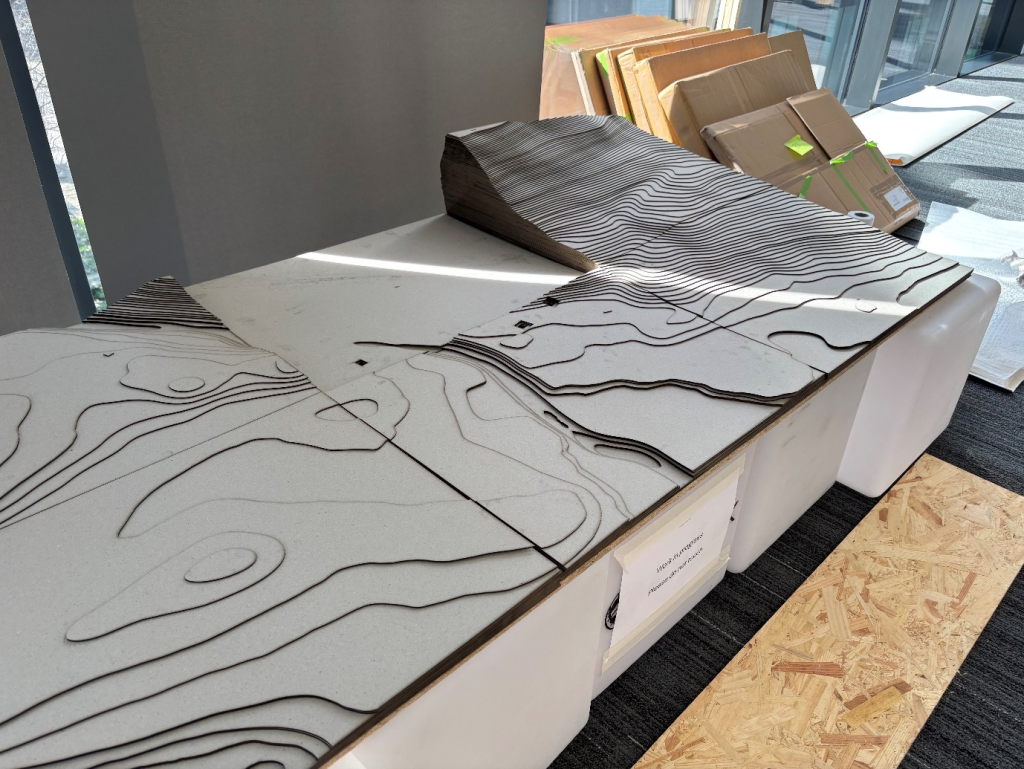
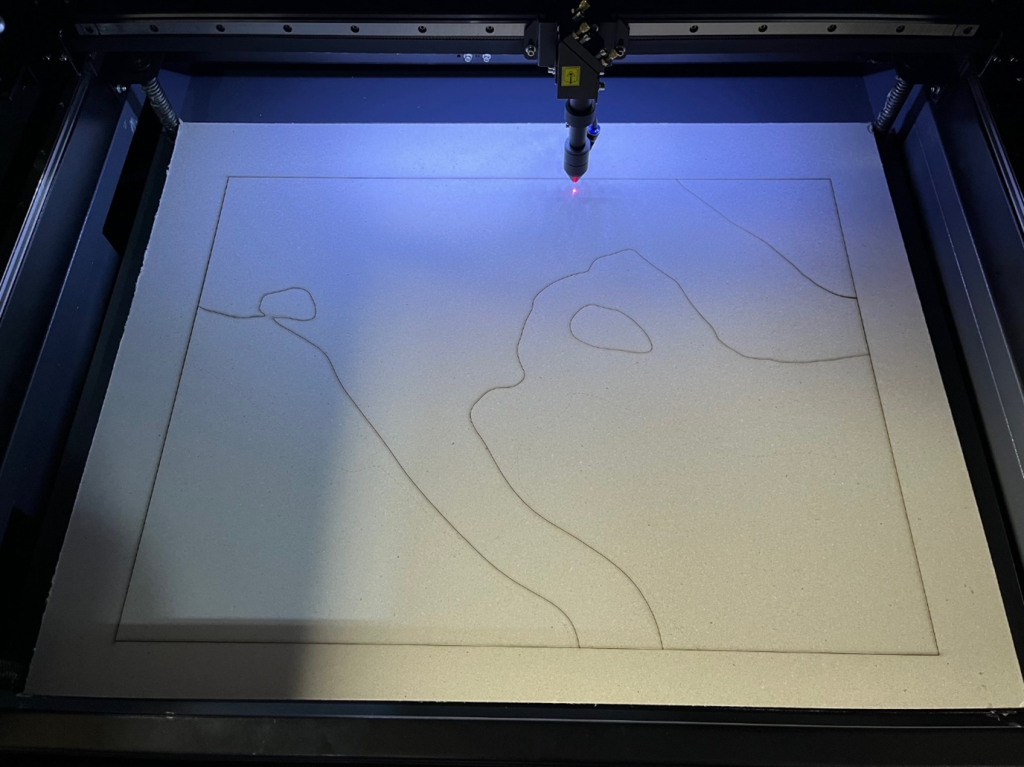
- To create these contour layers we followed John Nelson’s excellent How To Make This Paper Terrain Map of Germany tutorial for ArcGIS Pro.
- The contour layers were then Split into separate feature layers, and added to a Layout where we then applied labels to aid the reassembly of the layers.
- As there were several hundred layers to administer, we made use of ArcPy to automatically create these layouts, centre them over the relevant portion of the contour layer, and export them as an SVG.
- As an SVG, we could bring the data into and from there, cut the contours on a laser cutter.
- The layers – around 400 in total – were then painstakingly glued together over the course of a few days. With the terrain complete, we made a trip to one of the fantastic model shops here in Edinburgh to acquire trees, grass and a road building kit, and applied the finishing touches.
And back again… (connecting the physical and digital)
While the terrain was important, the story we wanted to tell wasn’t solely focused on how you can use ArcGIS Pro to create physical models. Essential to the story of the model was the ability to change environmental conditions in the real-world which are then reflected in the digital twin. For our demo we wanted our digital twin to look as much like the real world as possible and so built a custom WebScene-based app using the ArcGIS Maps SDK for JavaScript: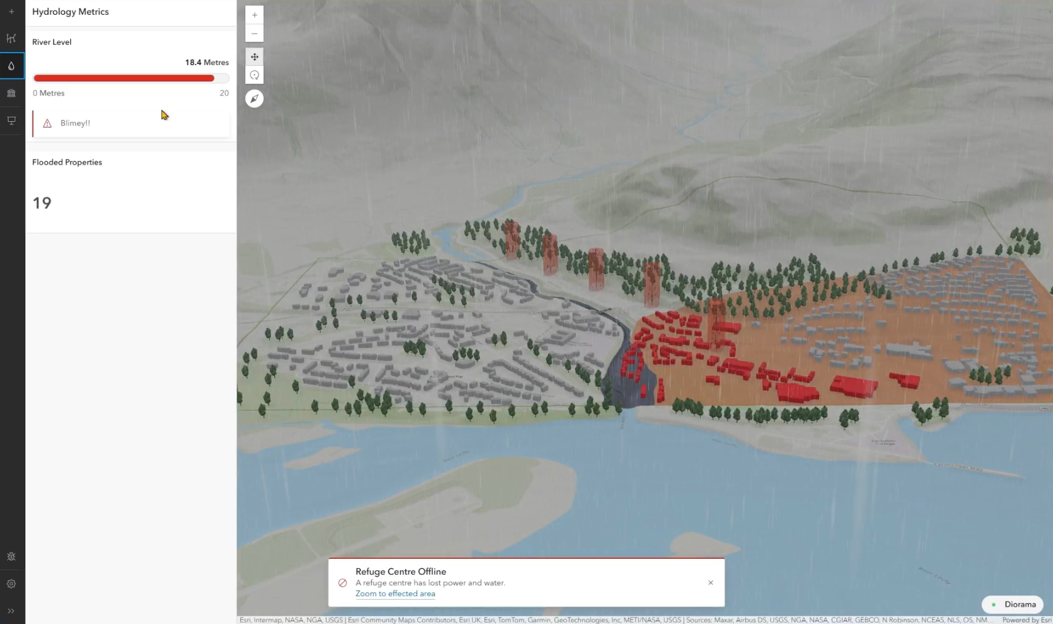
But how do you get a cardboard model speaking with a WebScene?
For starters, we positioned various sensors throughout model. A light sensor monitored light level, a water sensor monitored water level, and magnet switches monitored the bridge and network of (model) electricity pylons for any breaks. These sensors were connected to an Arduino plugged into a laptop that communicated with a Websocket server via HTTP requests.
This server in turn spoke with our digital twin which (among other things) visualised these changes. The process for sending data from the sensors to the digital twin was relatively standard so we’ll just be looking at a couple of examples here, starting with the light sensor.
Light sensor to sunset
To introduce the synchronicity between the model and the digital twin, we made use of the environment property in the WebScene. This allowed us to adjust the position of the sun and light level in the digital twin, and create a really smooth sunrise / sunset animation.
When we dimmed the lights in the conference centre, a very low light level value was passed from the light sensor to the digital twin, where it was converted to a time between sunset and nighttime. The light change was gradual and the speed of the data transfer between the model and the digital twin was very fast, so this resulted in a nice smooth sunset animation.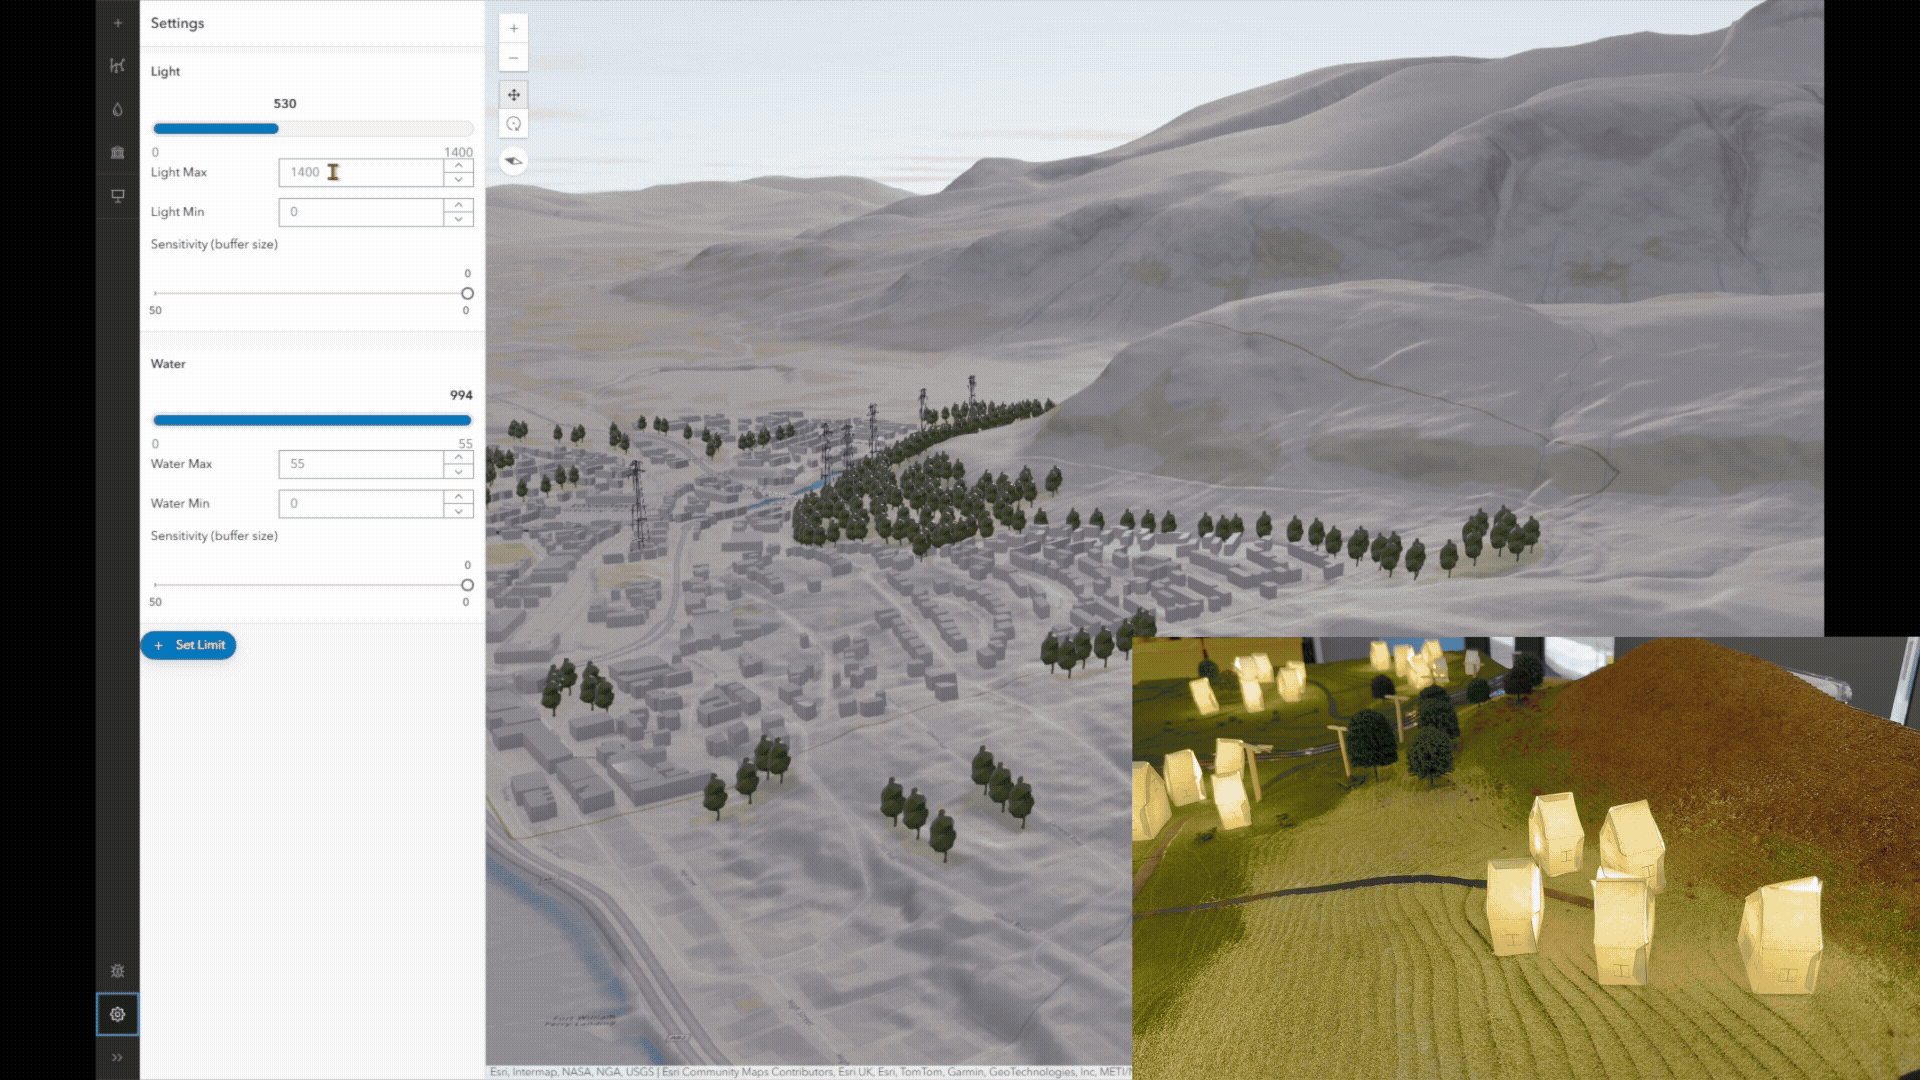
Water sensor to flood visualisation and analysis
The ‘riskiest’ portion of the demo was when we initiated a flood simulation by pouring a jug of water onto a portion of the model’s river that we’d waterproofed with a UV-cured resin.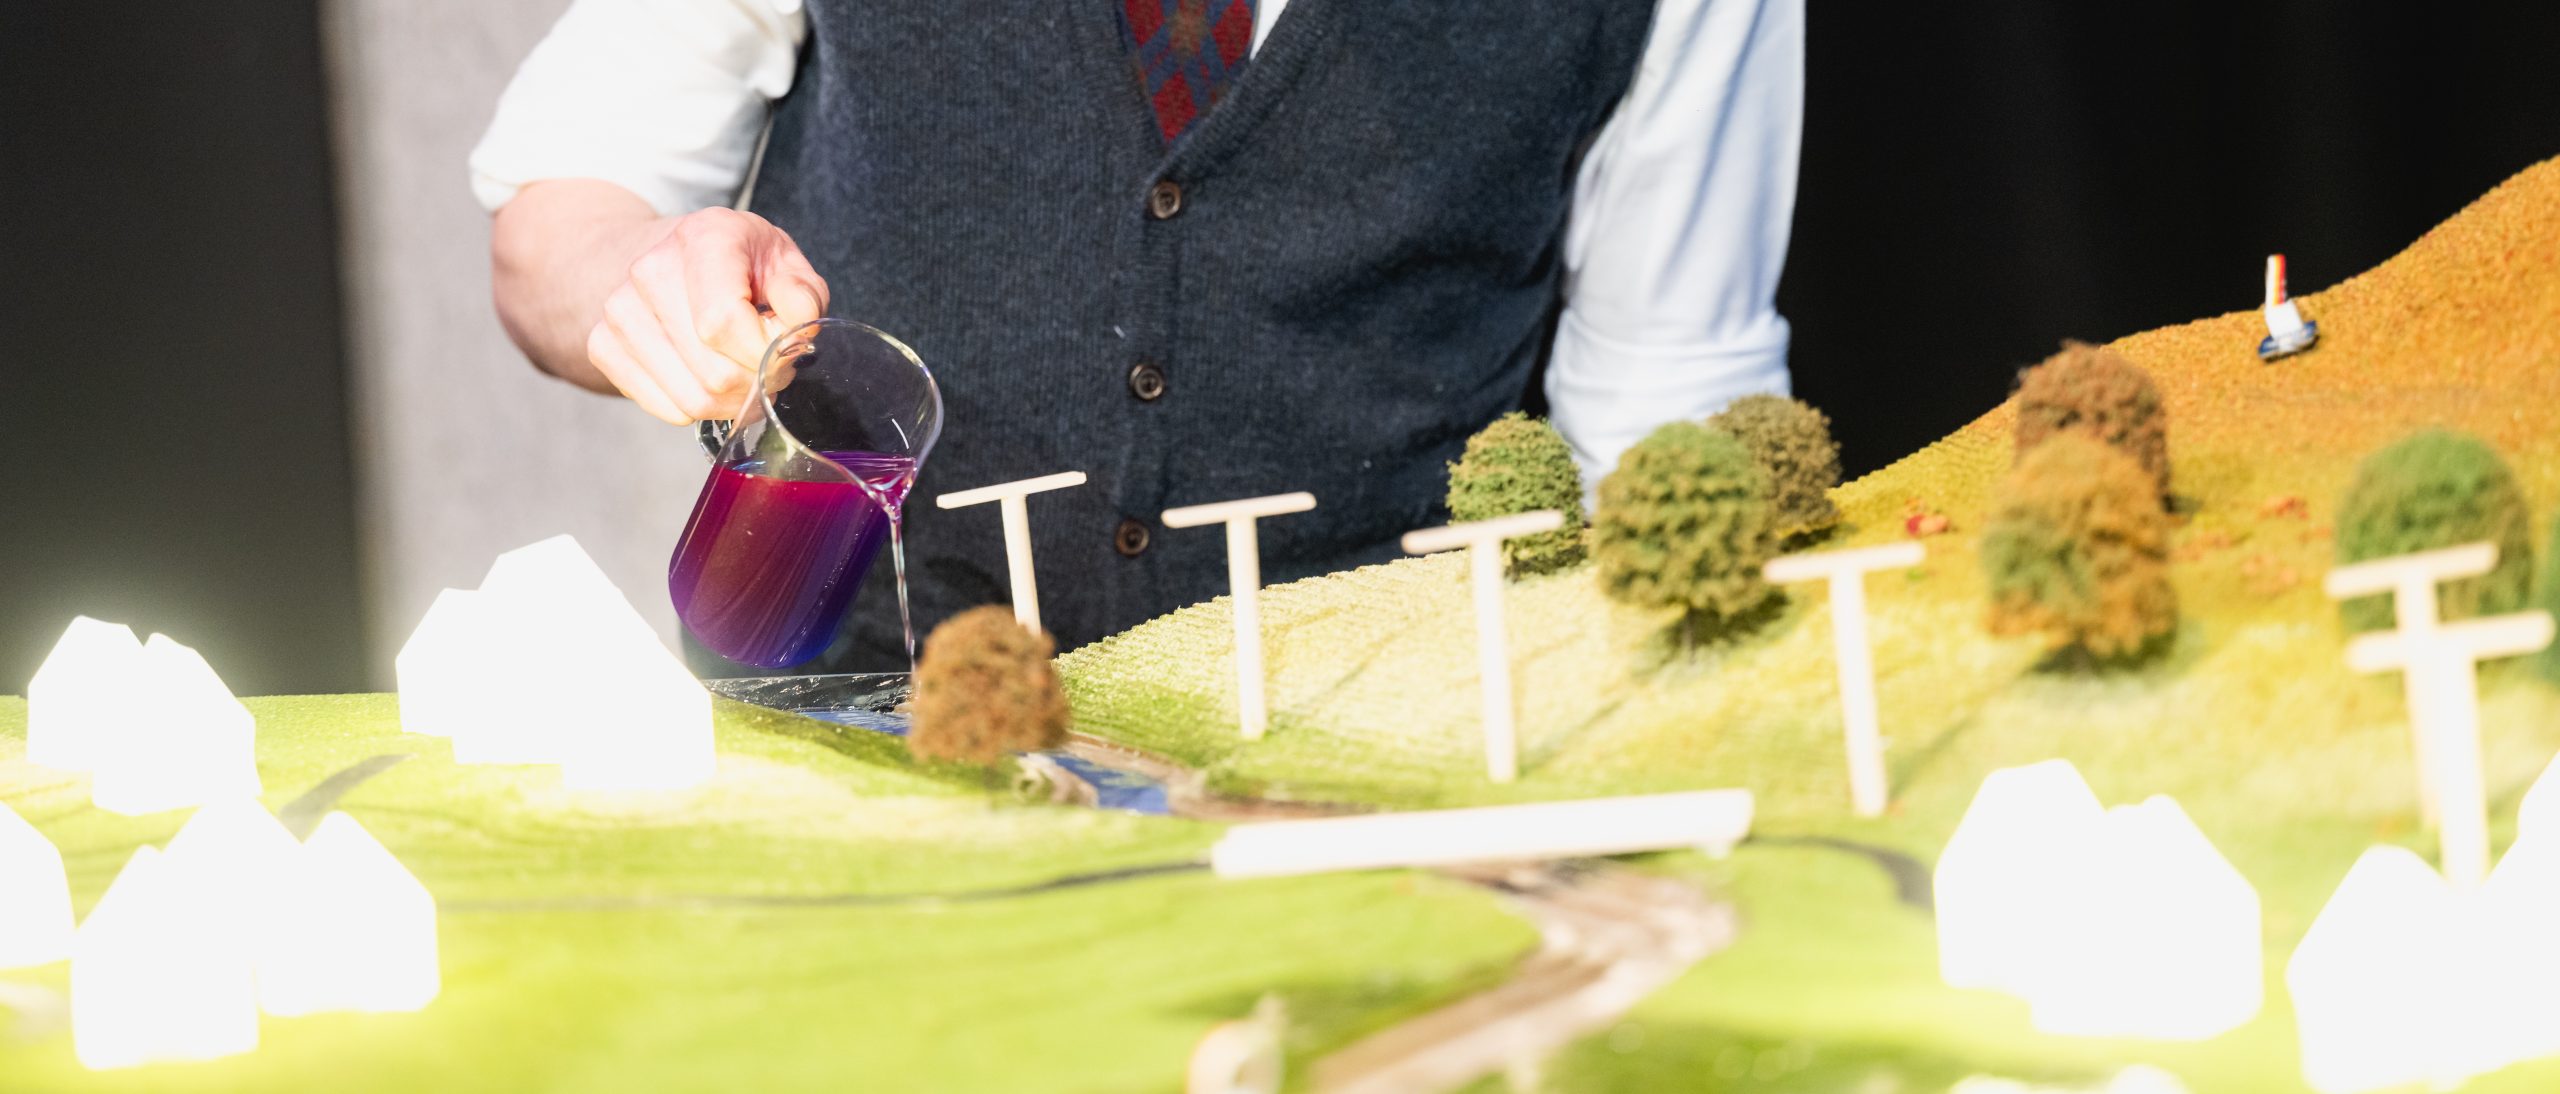
As the water trickled down the river – a scale representation of the River Nevis near Fort William – it eventually hit a water sensor at the end of the river. This sensor recorded a 0-100 value based on how wet it was. Like the light sensor, the data from water sensor travelled from the model to the digital twin, where it was visualised.
This visualisation was purely symbolic, being a dynamically redrawing Graphic, rather than the output of flood simulation (If you are interested in flood simulation then I’d recommend looking at my colleague’s overview of ArcGIS Pro’s Flood Simulator). We could however use the geometry of this dynamically updating Graphic to perform some real-time analysis. Using an intersect Query (Feature Service/Layer) via the ArcGIS REST API, we were able to identify the number of properties in our buildings feature layer that had been flooded.
Physical utility network reconfiguration
During the simulated storm, a “gust of wind” (a colleague’s hand) knocks down one of the model’s electricity pylons. As the pylon falls, a magnet at its base loses contact with a magnet switch on the ground. The Arduino detects this and sends a message to the digital twin, indicating that the pylon has fallen. A (digital) Utility Network representation of the physical network of pylons is edited to reflect this change. It then runs a trace to identify the affected customers.
The result of this trace is then transferred back to the physical model where a relay allowed us to switch off the lights to the effected (physical) houses. Of course, we couldn’t finish the demo with the lights off so moved the pylon to a location where it wouldn’t be affected by the wind. With another magnet switch, we were able to follow a similar process by repositioning the pylon, updating the Utility Network, restoring power and bringing the lights back on.
This moment of recovery was a fitting way to close the demo—not just because the lights came back on, but because it highlighted the dynamic, responsive nature of digital twins. They’re not just about simulating complex problems; they’re about helping us solve them.

I hope this blog has given you an interesting behind-the-scenes look at some of what was involved in our digital twin demo, and also an idea of the technology that would be involved in building a digital twin like this in the real world.