Creating detailed 3D building models can be a time consuming and/or expensive process. In this blog I’m going to look at a DIY option – the Extract LOD2 Buildings tool introduced in ArcGIS Pro 3.5 – which makes it much easier to generate accurate multipatch models straight from your data. Whether you’re working on urban planning, smart city projects, or environmental analysis, this tool could help you speed up your 3D workflows and get high-quality results with less hassle.
To extract buildings, you need three things: a height source, building footprints and the 3D Analyst Extension.
What is LOD?
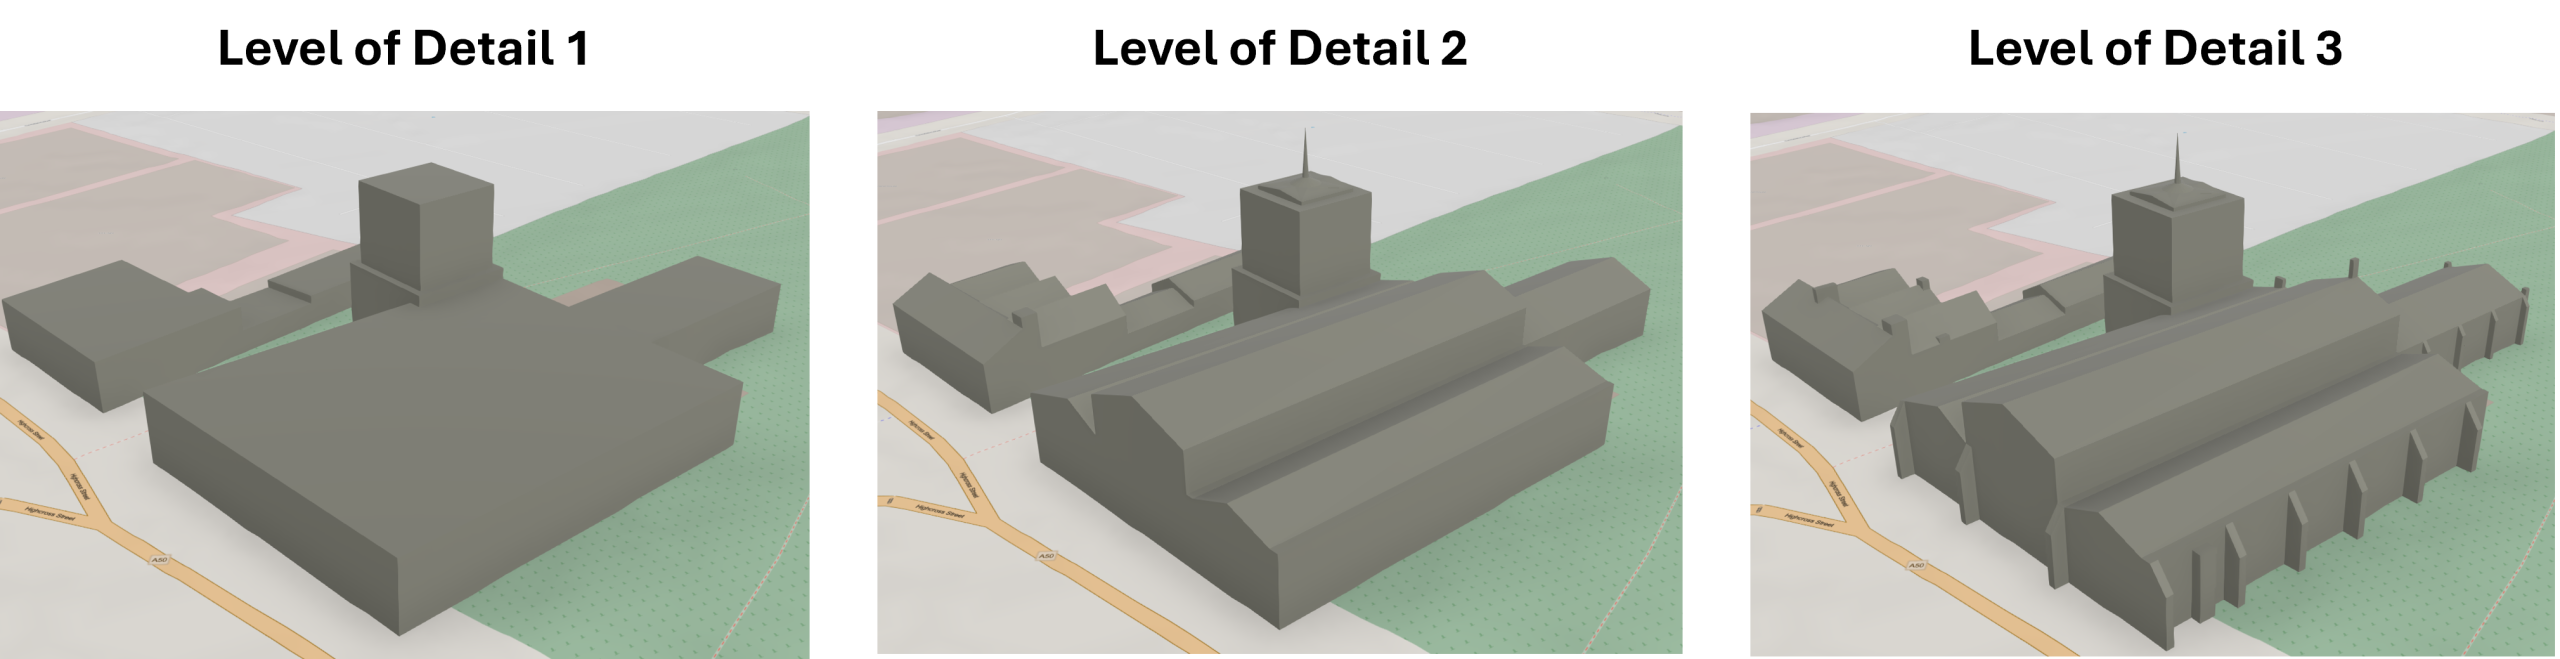
3D building models are defined by their Level of Detail (LOD) – effectively a sliding scale of model complexity. There are three core levels:
- LOD 1 – Simple block buildings
- LOD 2 – Enhanced LOD1 models with extra building details like roof shape (this is the output of the new tool)
- LOD 3 – Further refinement of LOD 2 with fully modelled roof structures, including chimneys and other smaller details
Prepare your Input data
Height source
Provide either a raster or mosaic layer that acts as the height data. I used a Digital Surface Model (DSM) and if you want to try it with a free dataset try these sites for England, Scotland and Wales:
- England: Defra Data Services Platform,
- Wales: LiDAR viewer | DataMapWales
- Scotland: Scottish Remote Sensing Portal
Building Footprint
This is a polygon feature representing the footprint of the building(s) that will be extracted. This could be your own data, but other great datasets include OS NGD buildings or OS MasterMap. If you are looking for opensource data do check out OSM Buildings and you can use a tool like overpass turbo to export the features ready to load into ArcGIS Pro.
Results
The results of this tool can vary, I have experienced both good and bad. Usually this is based on a couple of factors like; input data, the size of the area of interest and the complexity of the buildings. I have found that when running the tool for standalone buildings that are simple you can tailor parameters to make the best output. When you introduce more complex buildings like semi-detached buildings with extensions the tool can struggle more. If you just want to produce a “good enough” data set that can be used in the background of a 3D Scene, then using this tool is perfect.
Tweaking the model
The LOD 2 Extraction Tool has a small level of customisation. There are three levels you can set . You can also set the Smoothness level and Extraction Accuracy.
LOD Rating
If you want to quickly output results with less detail you can configure the LOD rating to be 1.2 or 1.3, these models use a flat representation of the roof reducing potential inaccuracies.
Running the 2.0 Model captures the roof slope and orientation of the roof.
Smoothness level
Choose a number between 0.0 and 1.0 to change the extent to which the building with be preserved or generalised. Closer to 1 will give a Smoother more simplified output. Closer to 0 will provide more sub-elements of a building. If your height source data has lots of noise keeping this value higher will help combat that.
Extraction Accuracy
This affects the broader accuracy of the final building model. There are three options: Low, Medium and High.
Low—a broader tolerance for the resulting 3D models will be used, which may lose some details in the building. This option has the shortest processing time.
Medium—a balance between building model accuracy and processing time will be used. This is the default.
High—the highest accuracy for the resulting 3D models will be used. This option will extend the overall processing time.
Final thoughts
Now that you’ve transformed your flat 2D maps into rich, interactive 3D scenes with LOD2 buildings, it’s easier than ever to explore and understand the built environment. While the capability to build 3D GIS scenes has been part of ArcGIS Solutions for some time, this latest iteration offers a more streamlined and intuitive experience. The tool bridges the gap between widely available open data and the creation of more immersive 3D visualisations for your area of interest – enhancing accessibility and enabling more informed decision-making.
By integrating CAD and BIM data, you can add even greater detail and context—whether you’re visualising a new development or building a digital twin to support smarter planning and creative applications.
Additional resources:
- Extract LOD2 Buildings (3D Analyst)—ArcGIS Pro | Documentation
- Point Cloud Processing & 3D Analytics Software | ArcGIS 3D Analyst
- overpass turbo
- OS NGD Buildings | OS National Geographic Database
- Defra Data Services Platform