The November release of ArcGIS Online brought beta access to enhanced demographic for England, with a huge new variety of data variables for you to use.
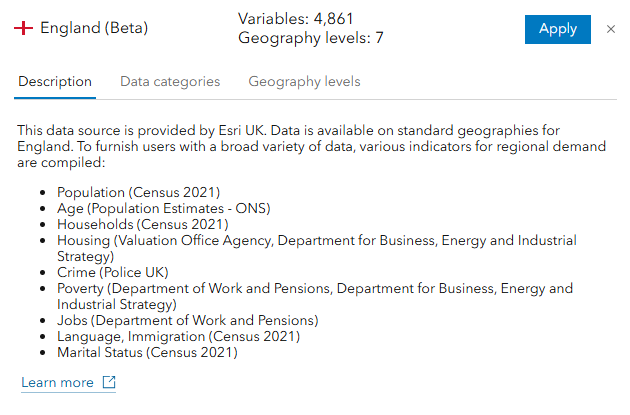
Nearly 5,000 variables covering Population, Age, Housing, Crime, Poverty, Job, Ethnicity, Language and more will now be at your fingertips to provide greater insight and resolution to your analysis. This is the culmination of several months work behind the scenes to make our National Data Service accessible to a wider audience and our the data for England is our first step towards further in enhancing the demographic data available for the UK.
What’s new and improved?
ArcGIS Online provides access to 138 demographic variables for the UK provided by Michael Bauer Research.
This is now enhanced by the beta option to access 4,861 variables for England from authoritative data sources including ONS, Police UK, the Valuation Office Agency and more. They are all available down to Lower Super Output Area (LSOA) geography.
Age profile
Age counts for every single age (rather than 15-year age bands) – allowing you to more accurately profile and target key age groups as well as Age and population count for each year from 2016-2024 – allowing you to understand population change.
Socio-economic indicators
Poverty, benefit claimant and deprivation data – allowing you to target communities most in need of services and support.
Population diversity
Detailed ethnicity, religion and language variables – allowing you to better understand and respond to diversity within your communities.
How to access the new data
The best way is through ArcGIS Business Analyst which provides tools, workflows and access to the data to support your analysis. The Business Analyst Web App Standard is available to any Creator user (or above) and is a great place to get started. If you are new to Business Analyst, this technical blog introduces what it has to offer.
The data can also be used with the Enrich Layer tool in the Map Viewer. In either case, you will need to change the data source to England (Beta):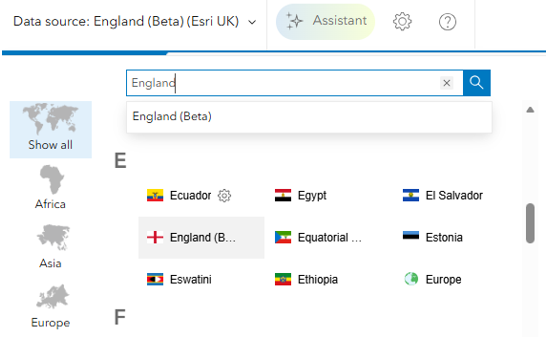
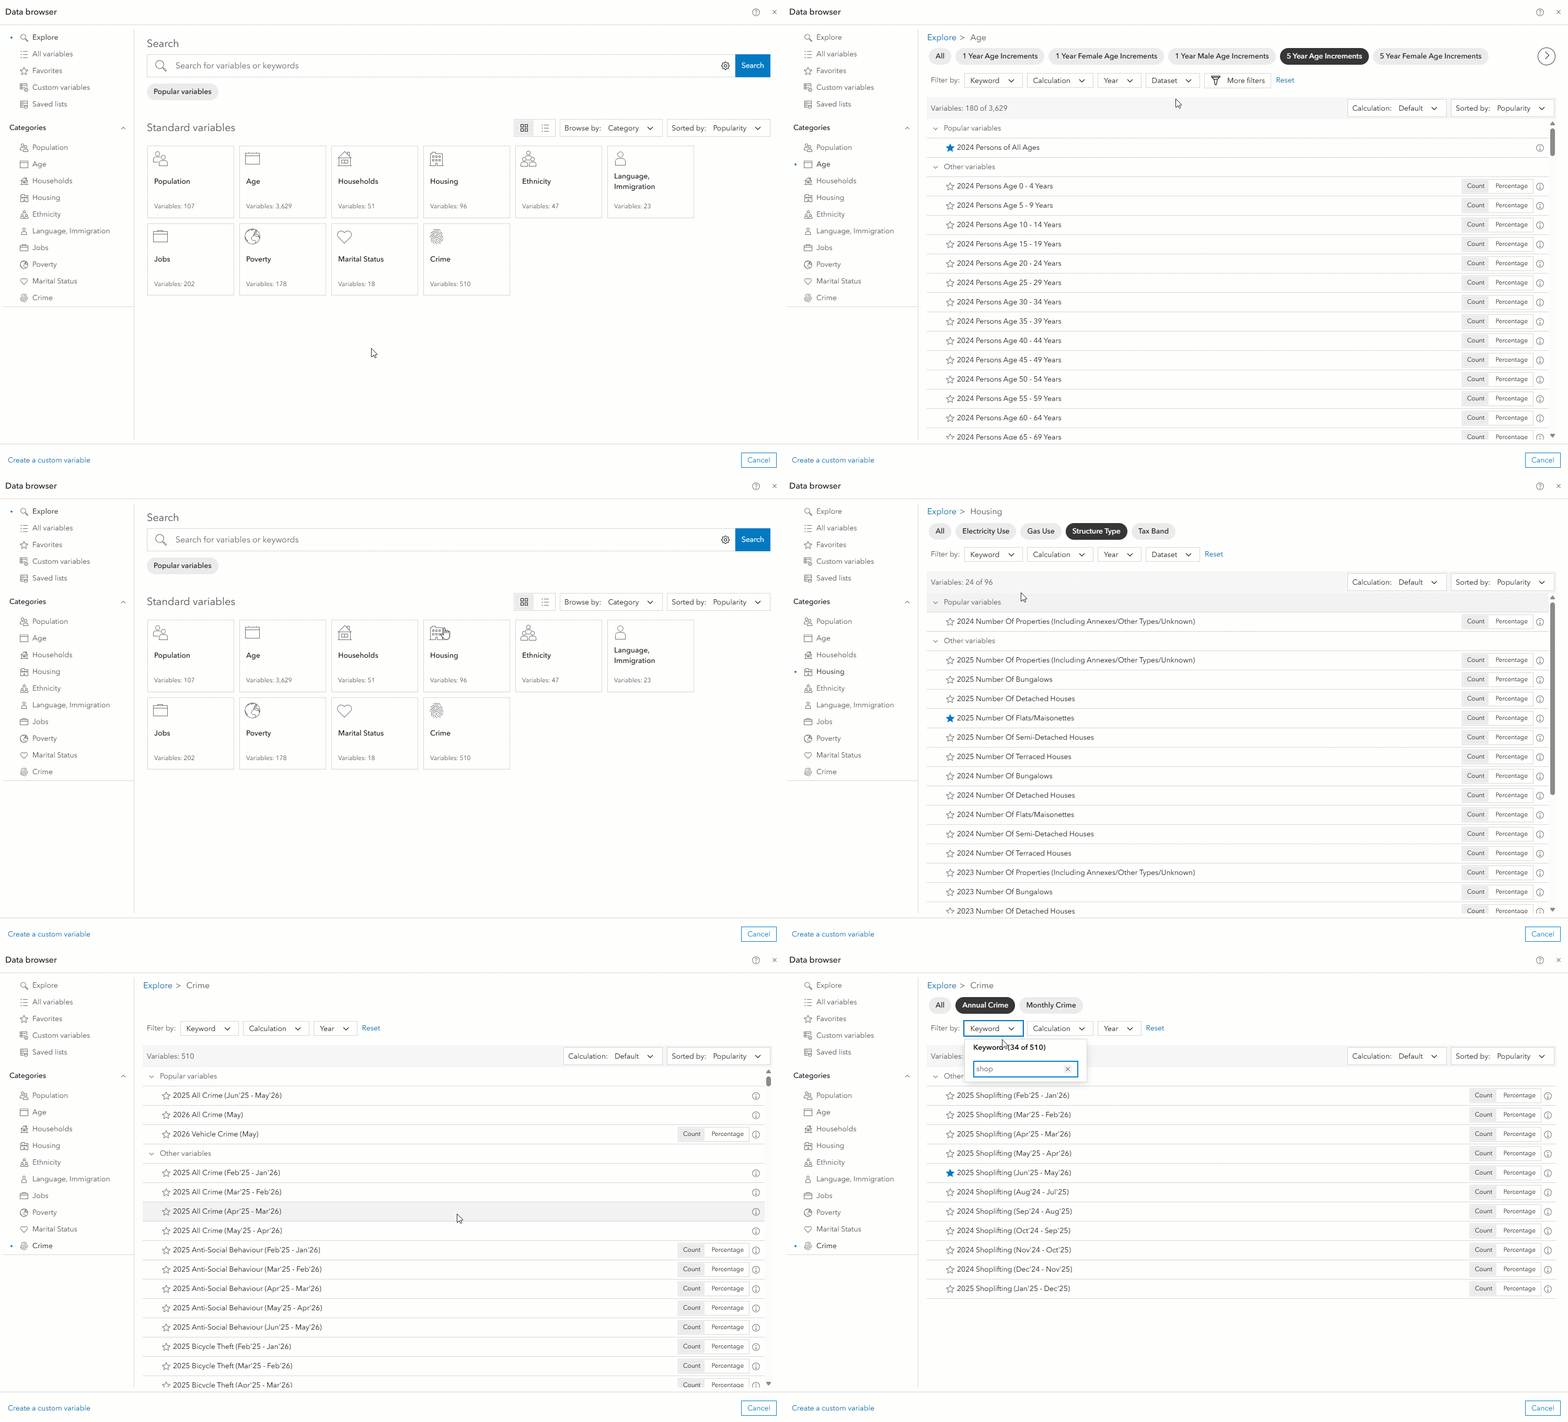
The Business Analyst user interface makes it easy to explore the variables through the built-in data browser which groups them into themes and sub-categories and allows you to save your favourites for future use:
You can even create your own custom variables by combining others together to target specific demographic indicators of interest. For example, if you wanted to target areas with population growth in the 20-34 age bracket between 2019 and 2024, you could create your own indicator as shown below.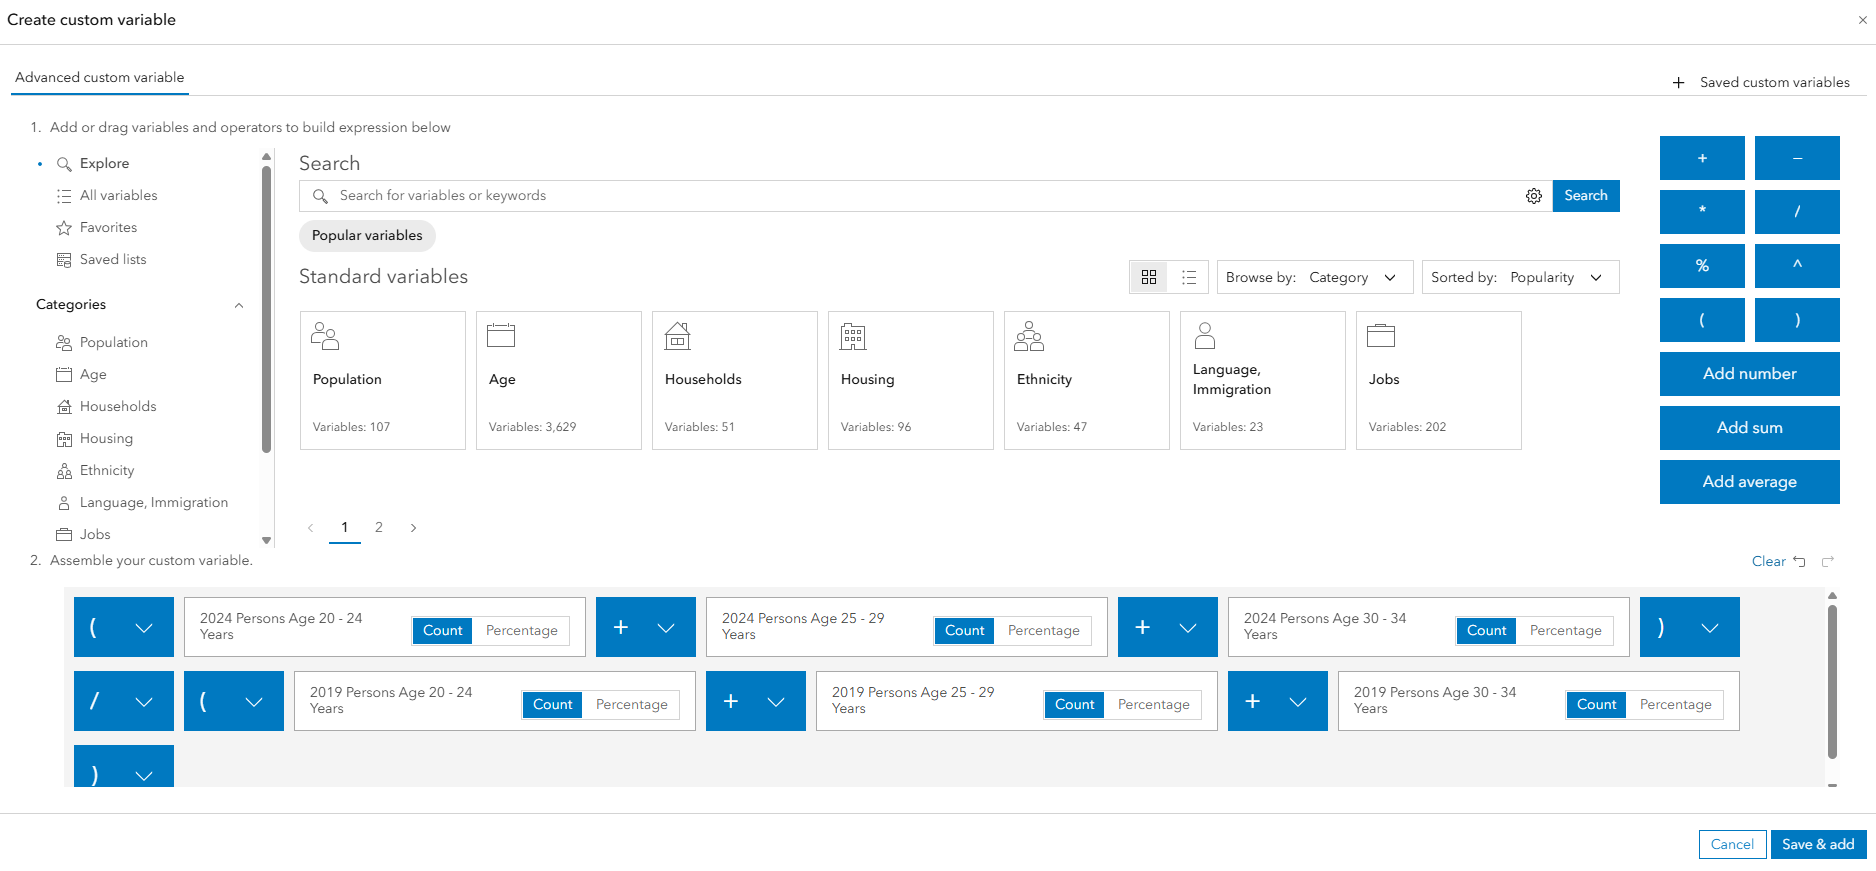
Alongside the new data, users can also access a variety of new infographic and report templates specifically designed to showcase the key insights available through this enhanced data.
For example, the new Housing Market Summary infographic clearly presents information about household composition and structure type for your area of interest and allows you to understand how that relates to the national average.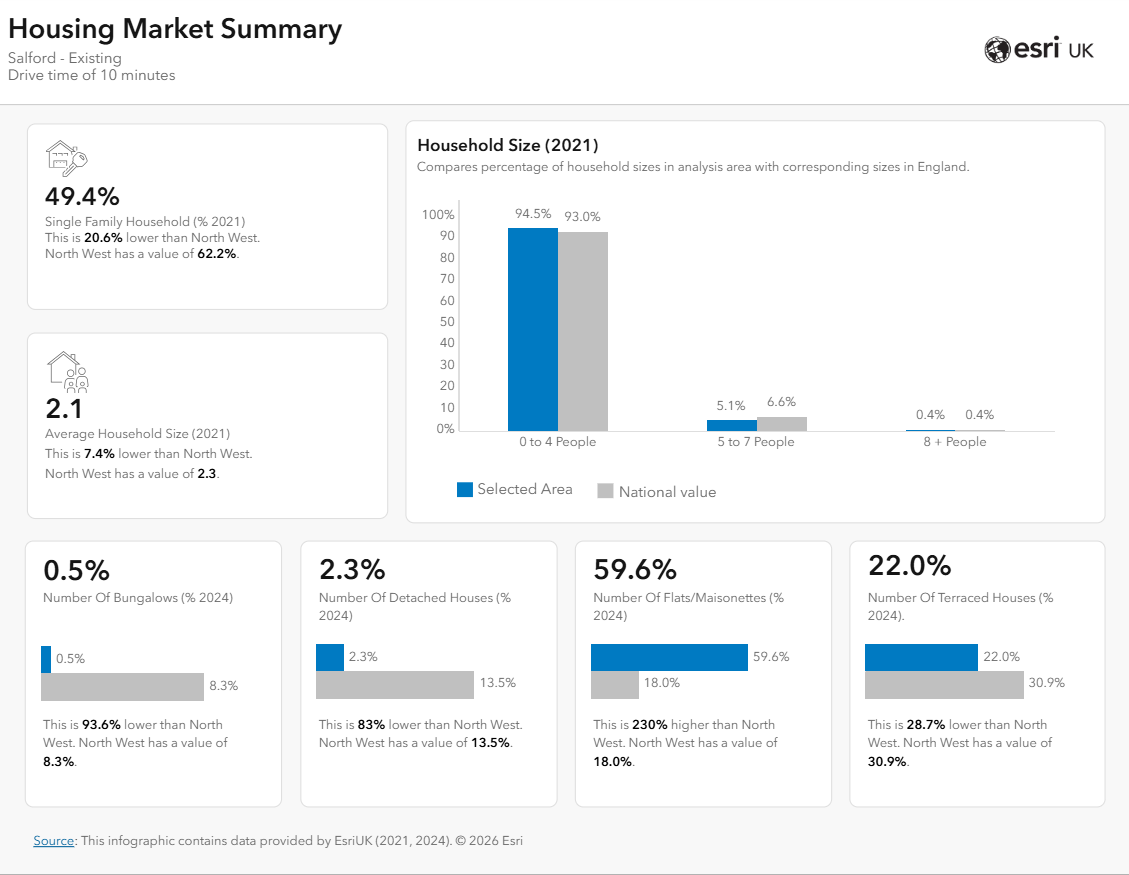
Going further
For users with access to Business Analyst Web App Advanced, you can go even further by using the enhanced England (Beta) data as part of advanced analysis workflows such as suitability analysis – where you can score a series of sites based on how well they match your chosen demographic mix.
Business Analyst Web App Advanced also lets you reference your own organisation’s data and use it alongside the new data to better understand how local demographic differences influence variations in your own data. You can even combine all the data together into custom reports and infographics and then share this understanding with other stakeholders through ArcGIS Dashboards and ArcGIS StoryMaps.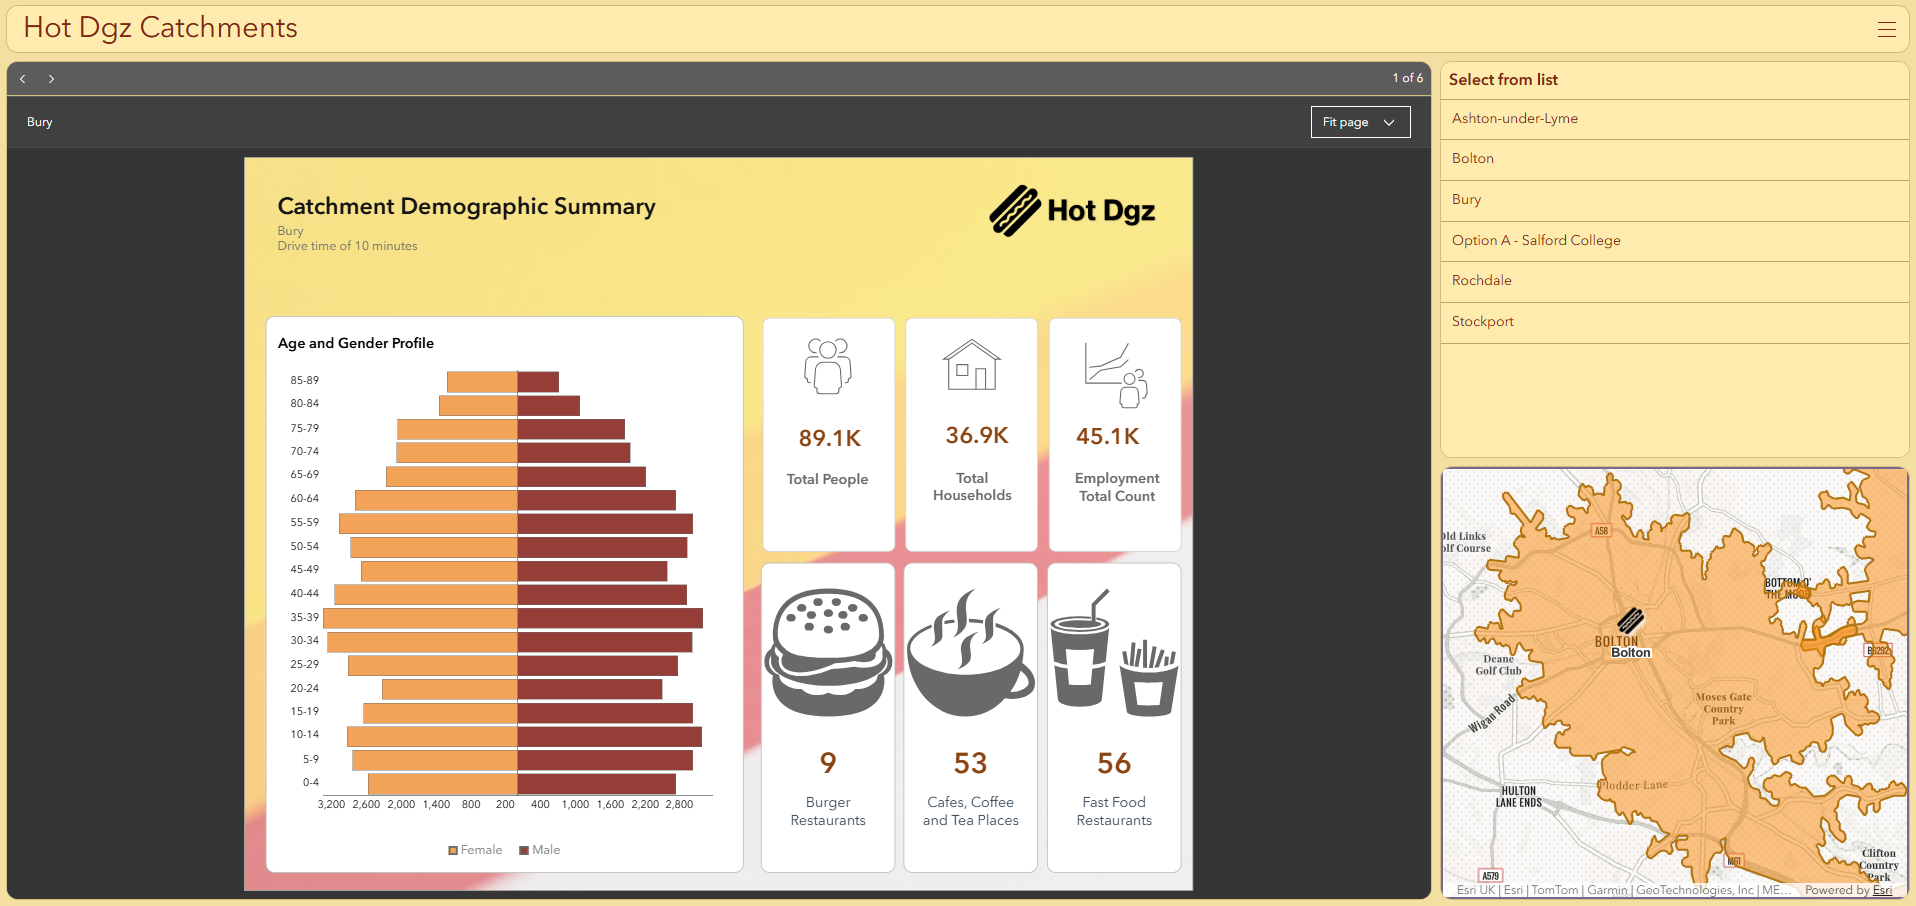
Sounds great. Is there a cost for accessing / using this data?
Access to the enhanced data for England is included with your Creator and above user types during the beta. Note, credits are consumed for mapping, conducting analysis and generating infographics and reports. The credit costs for Business Analyst can be understood here.
So, what next?
Give it a go! We would love to hear how you find the new data. What do you find useful? What else would you like to see in the future? Your feedback will help us shape further enhancements to the data and software offerings, ensuring we continually improve the tools and experiences we deliver.