One year on from the launch of Insights for ArcGIS, the data analytics workbench tool has been released for use in ArcGIS Online. Now available as a premium app, users are able to exercise explorative analysis techniques on their datasets without the previously required entry-point of ArcGIS Enterprise. In this blog post, I will be covering the merits of using Insights for ArcGIS in your online environment, as well as exploring the new features that come with the update. If Insights is completely new to you, I’d recommend first checking out our previous blog post What is Insights for ArcGIS?, as well as having a browse of the product page to see some examples of it in action.
Same same but different
Insights for ArcGIS Online comes with the same look and feel as the on-premise version, but it’s the under the hood that’s changed. Dragging and dropping of interactive cards is still present, allowing you to blend spatial and non-spatial data. However, the data is likely to be coming from your content area in ArcGIS, rather than through database connections or ArcGIS GeoAnalytics Server. These features cannot be integrated as they are specific to ArcGIS Enterprise – a caveat to bear in mind with this release.
The first noticeable advantage of this new way of accessing Insights for ArcGIS is that it is more accessible, and less cumbersome than its Enterprise counterpart. I was able to create myself a workbook and start performing analysis on my data within minutes – cutting out the pre-requisite of any installation or configuration. It was also impressive to see how well Insights performed with a relatively large dataset (I was using Asset Registry Property from the Cabinet Office with ~8000 features). I could select areas and interrogate my dataset both spatially and through tables with a level of ease which was not previously possible in ArcGIS Online. This is also true of the Analysis View, where I could easily take a look at my workflow and undo/redo parts if needed – using caching capabilities which are not available in the ArcGIS Online analysis tools.
I found Insights for ArcGIS Online to be quick and intuitive for easily manipulating my existing datasets, whilst also giving me the option to work with all the great stuff found in the Living Atlas. This important development comes fresh with the new release where, as opposed to the Enterprise version, the full suite of Living Atlas geographic information is available at your disposal. This allows you easily supplement the discoveries made with your own hosted feature layers with the wide-range of available public datasets (e.g Canal & Rivers Trust).
Analysis
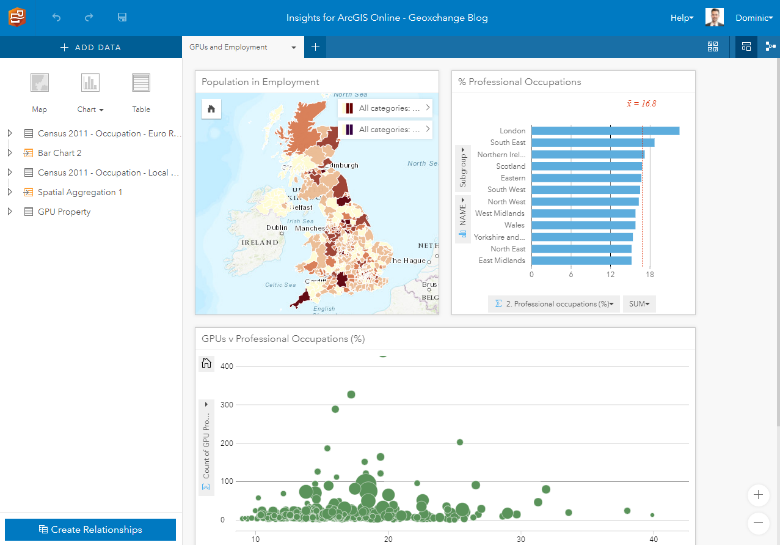
A couple of new additions to the analysis tools can be found in this version – the first of which is the addition of z-scores. Calculated by measuring how many standard deviations each feature lies from the mean (for the chosen field), this can be an effective means of exploring how dispersed data is. This tool can be found in the ‘How is it distributed?’ option under the analytics pane.
 How dispersed are ‘Sales and Customer Service’ roles around the United Kingdom?
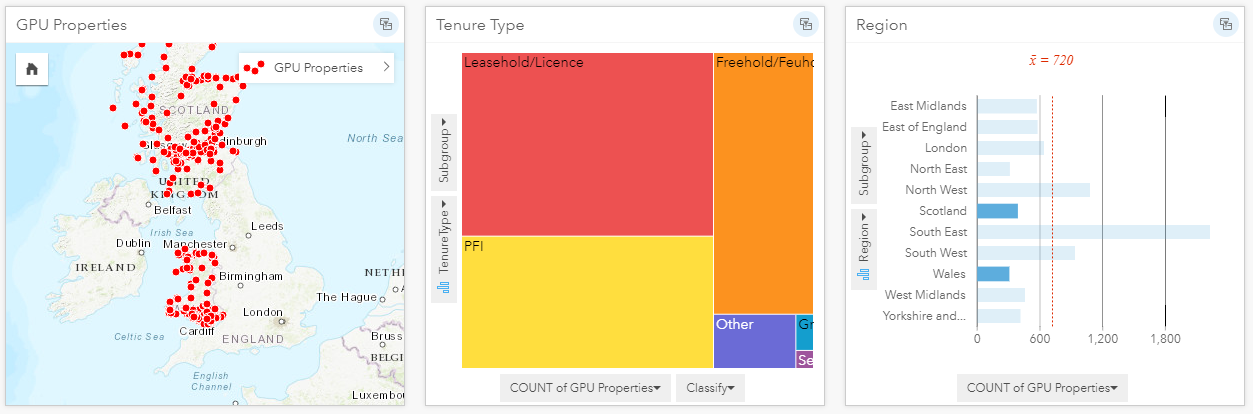
Once you’re satisfied with your array of maps, charts and/or tables, cross filters can be activated to link these together. These enable a linked-view between cards with a simple click of a button; whether it be a selection of rows in table, one or more variables on a chart (by holding CTRL) or a spatial selection on a map. Cross filters allow you to quickly interrogate your newly created dashboard. An extra tip: hold SHIFT when clicking to inverse your selection on any of these – eliminating one or more variables.
The cross filtering can be cleared by simply clearing the selection.
Maps
Are you working with a large dataset in which you need to quickly determine where the data is located and how it is distributed? If so, binned maps are now available as a new map type for aiding large or clustered datasets.
This visualisation style can be enabled in the layer settings for point features, by choosing Bins as the symbol type. Features are then dynamically aggregated within bins at each scale – summarising as a statistic, such as sum or average.
Other Additions
It is now possible to stack charts, both bar and column charts, that have been created with two string fields, making it easier to break down and compare parts of a field. You can switch between grouped and stacked in the chart settings on the specific card.
Finally, it is had been made easier to rename fields, simply by clicking on the data table as though you were to highlight the field. This will make changes within your workbook, but not to the underlying dataset. If you do wish to save these changes, you can do so by sharing your data to create a new feature layer.
Take a look at this story-map if you’d like to learn more about selecting the right data visualisation. For more on Insights for ArcGIS in general, be sure to check out the help pages as well as this blog post from Esri Inc.
![]()