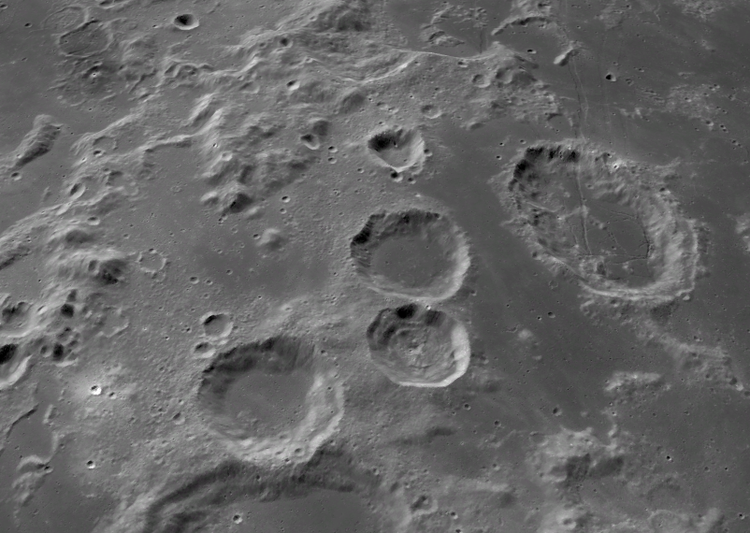
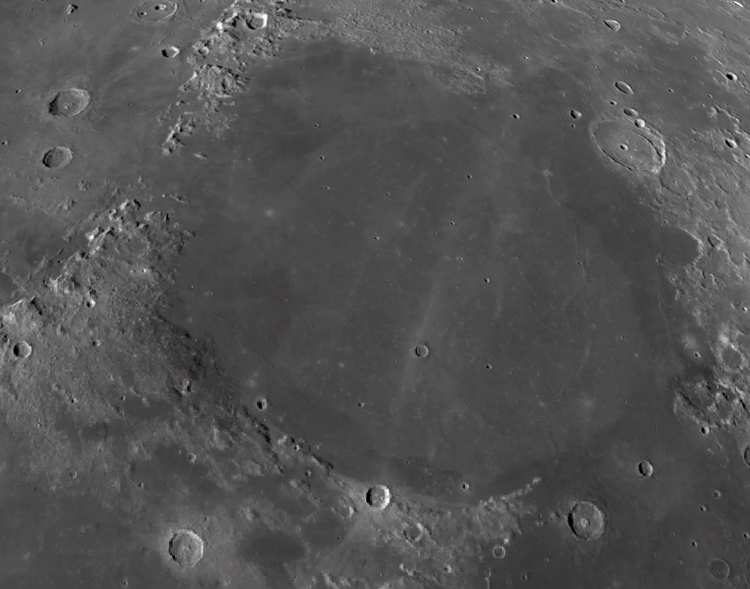
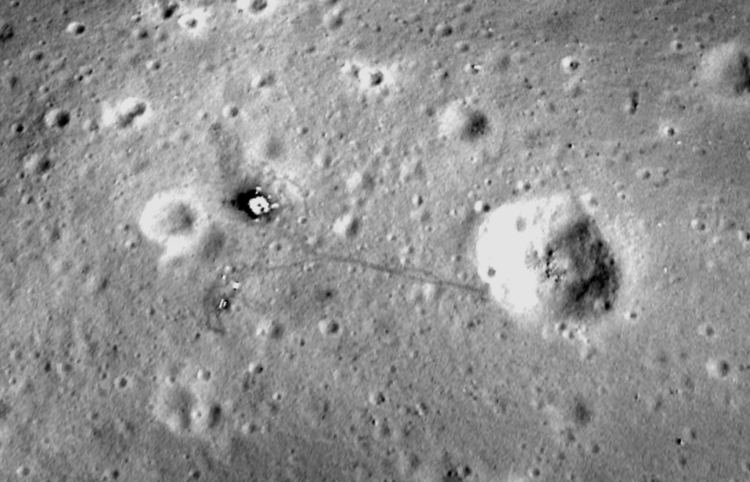
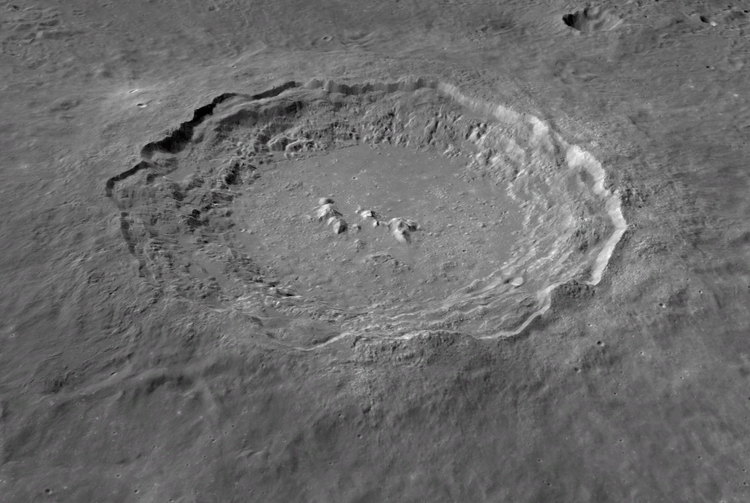
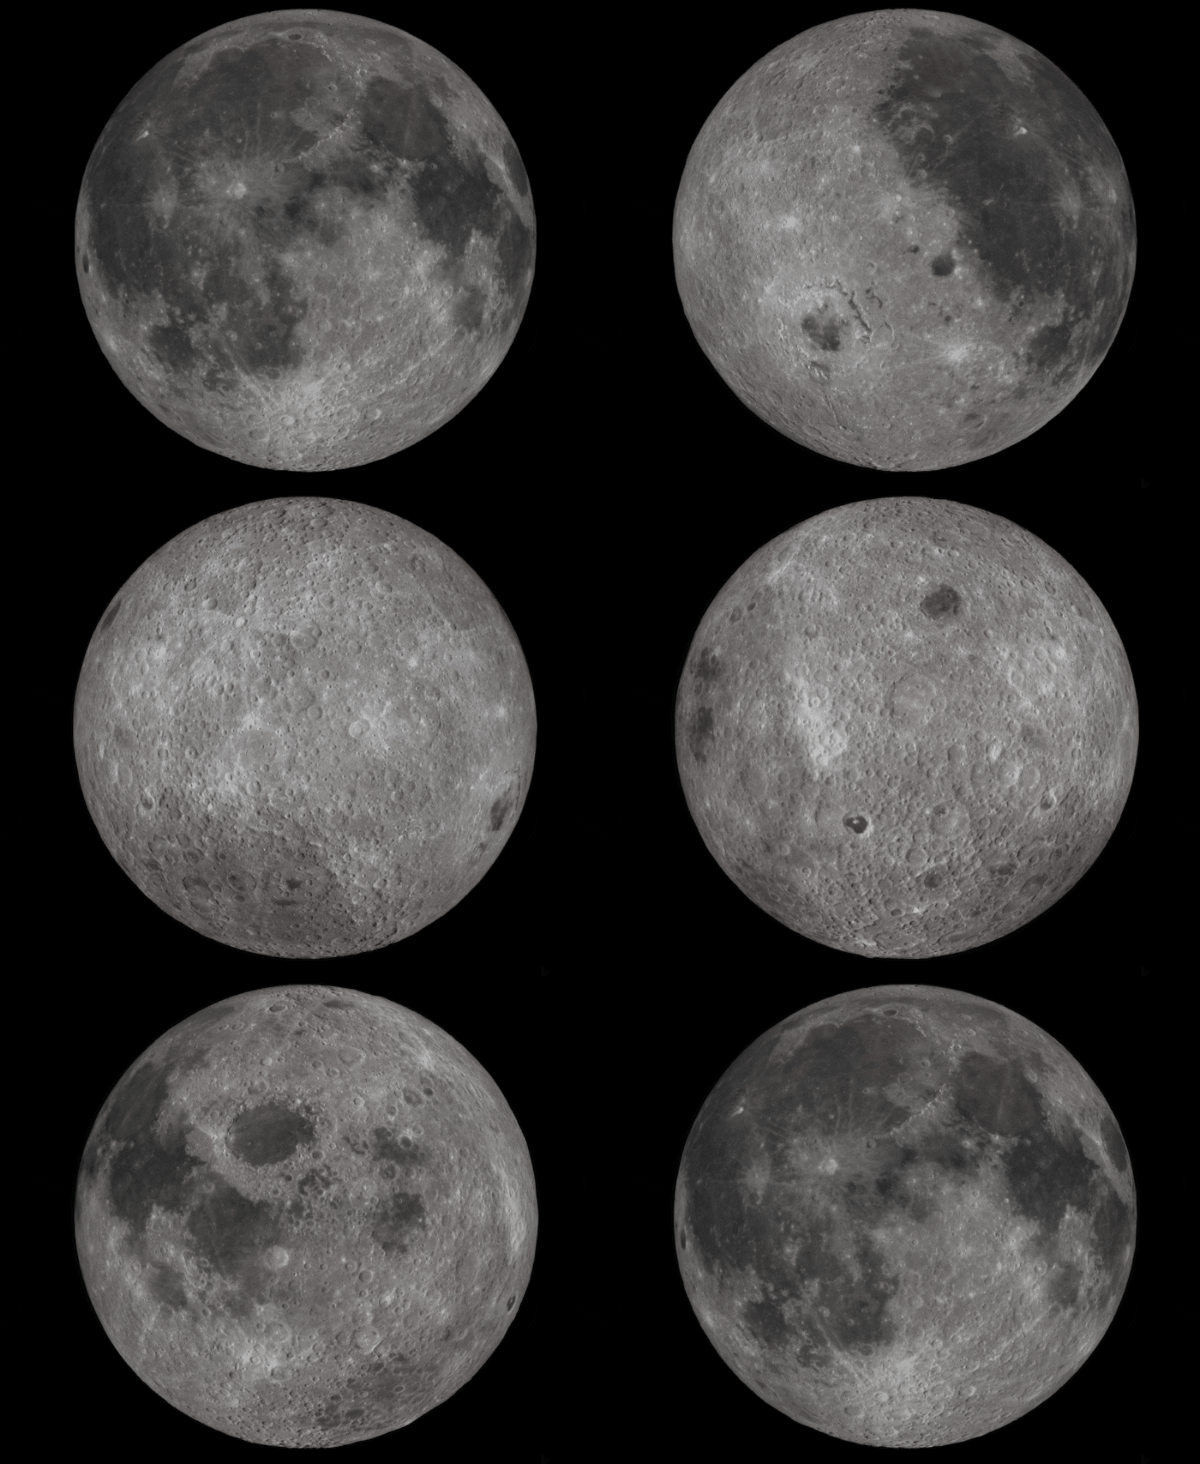
This year marks the 50th anniversary of the Apollo 11 Moon landing and with it humanity’s first tentative steps onto another planetary body. This momentous event pushed our horizon further out into the solar system, sparking a wave of further manned landings and exploration. As a map and space nerd myself (Remote sensing WOOOOT!), I saw this anniversary as the perfect opportunity to create a 3D map of the moon.
History of the Lunar Landings 3D Map
In this map it is possible to explore the weird and wonderful lunar surface and zoom in to investigate incredible high-resolution imagery from each of the Apollo manned landing sites.
Interested in how you too can take your own first steps beyond Earth-based GIS? Read on to learn how and explore the exciting frontiers of Planetary GIS.
One small step…to find data
Data wrangling is the first step of any mapping project, and for my map I needed to find some high-quality imagery data. Houston, we have a problem.
Luckily, NASA has got us covered. Planetary imagery data is relatively easy to acquire. Since the 1990’s, NASA has been a leading advocate for providing full and open access to all of their spectacular data. This means that there is a wealth of stunningly detailed imagery available for everyone. NASA share the processed (as well as raw) imagery, so we don’t even need to make any major adjustments to start using it.
Most of the data I used was sourced from the following Open Data portals:
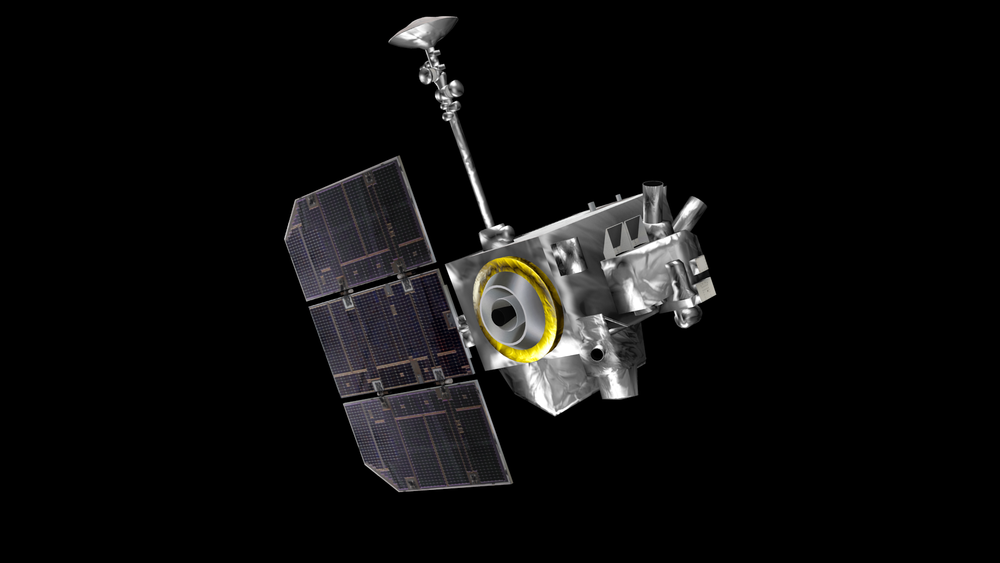
This i show we get the spectacular imagery data.
The Moon imagery comes via the instruments on board the NASA’s Lunar Reconnaissance Orbiter (LRO) spacecraft, which is beaming down a whopping 155 GB per day of data down to Earth each day (that’s 55 Terabyte per year, as much as would be required to store every book ever written!).
One giant leap…to create a map
I’ll walk you through how I prepared the Moon imagery in ArcGIS Pro, added the all-important elevation service, and put it all together in a 3D map in ArcGIS Online. I used ArcGIS Pro for all my imagery preparation. Usefully, Pro has coordinate systems for all the major planetary bodies and objects in the Solar System (!).
My two key imagery components were:
-
Lunar Imagery - Acting as the Basemap to our 3D map, this will be published as a hosted tile service from ArcGIS Pro.
-
An Elevation layer - used to create the 3D relief in the map
Imagery prep
Firstly, to create the Lunar basemap I combined a mosaic of single and multi-band imagery raster data. The imagery was then shared to ArcGIS Online by publishing the map from ArcGIS Pro as a Hosted Raster Tile Service.
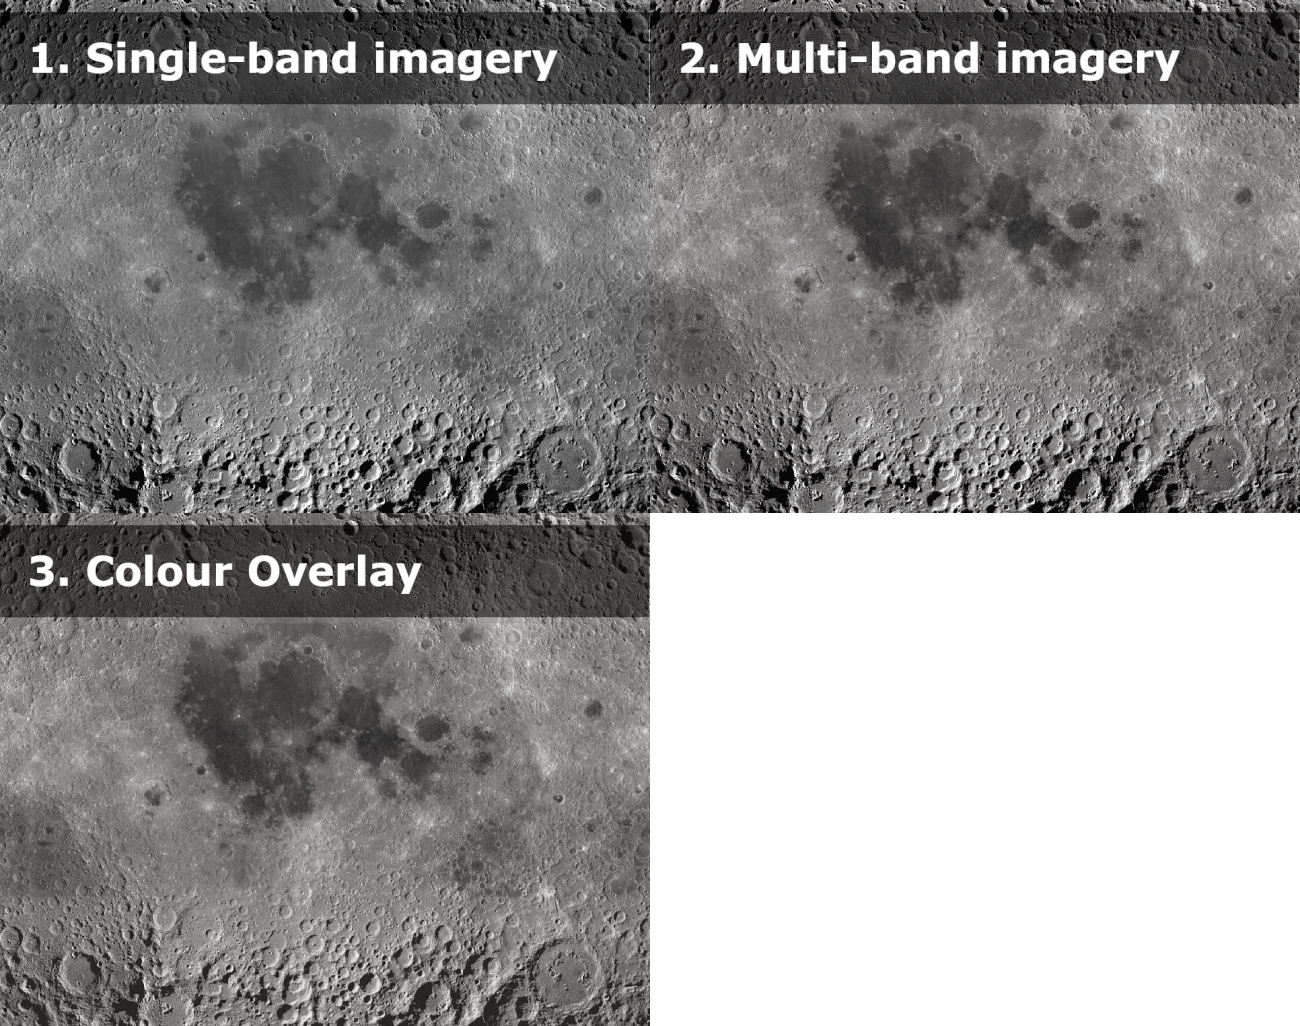
A variety of imagery data was combined to create the lunar basemap.
Publishing a Tile Service
Tile services are a highly performing and scalable way of sharing raster imagery layers online. I published the data in the same format as Esri’s Earth imagery Basemaps (methodology is here).
A key consideration when creating a tile service is the level of detail (the zoom level) down to which to pre-render map tiles. In my case this came down to a balance between having a good level of detail on the map whilst also having a manageable tile cache size. High levels of detail in a tile cache can quickly balloon the hosted service file sizes to 100’s if not 1000’s of GB.
As well as having lunar surface imagery, I also wanted to people to be able to explore the Apollo landing sites with high-resolution imagery (I’m talking 1 meter resolution!). So, to do this I created a separate tile service just for the Apollo imagery and overlaid it on my Lunar basemap.
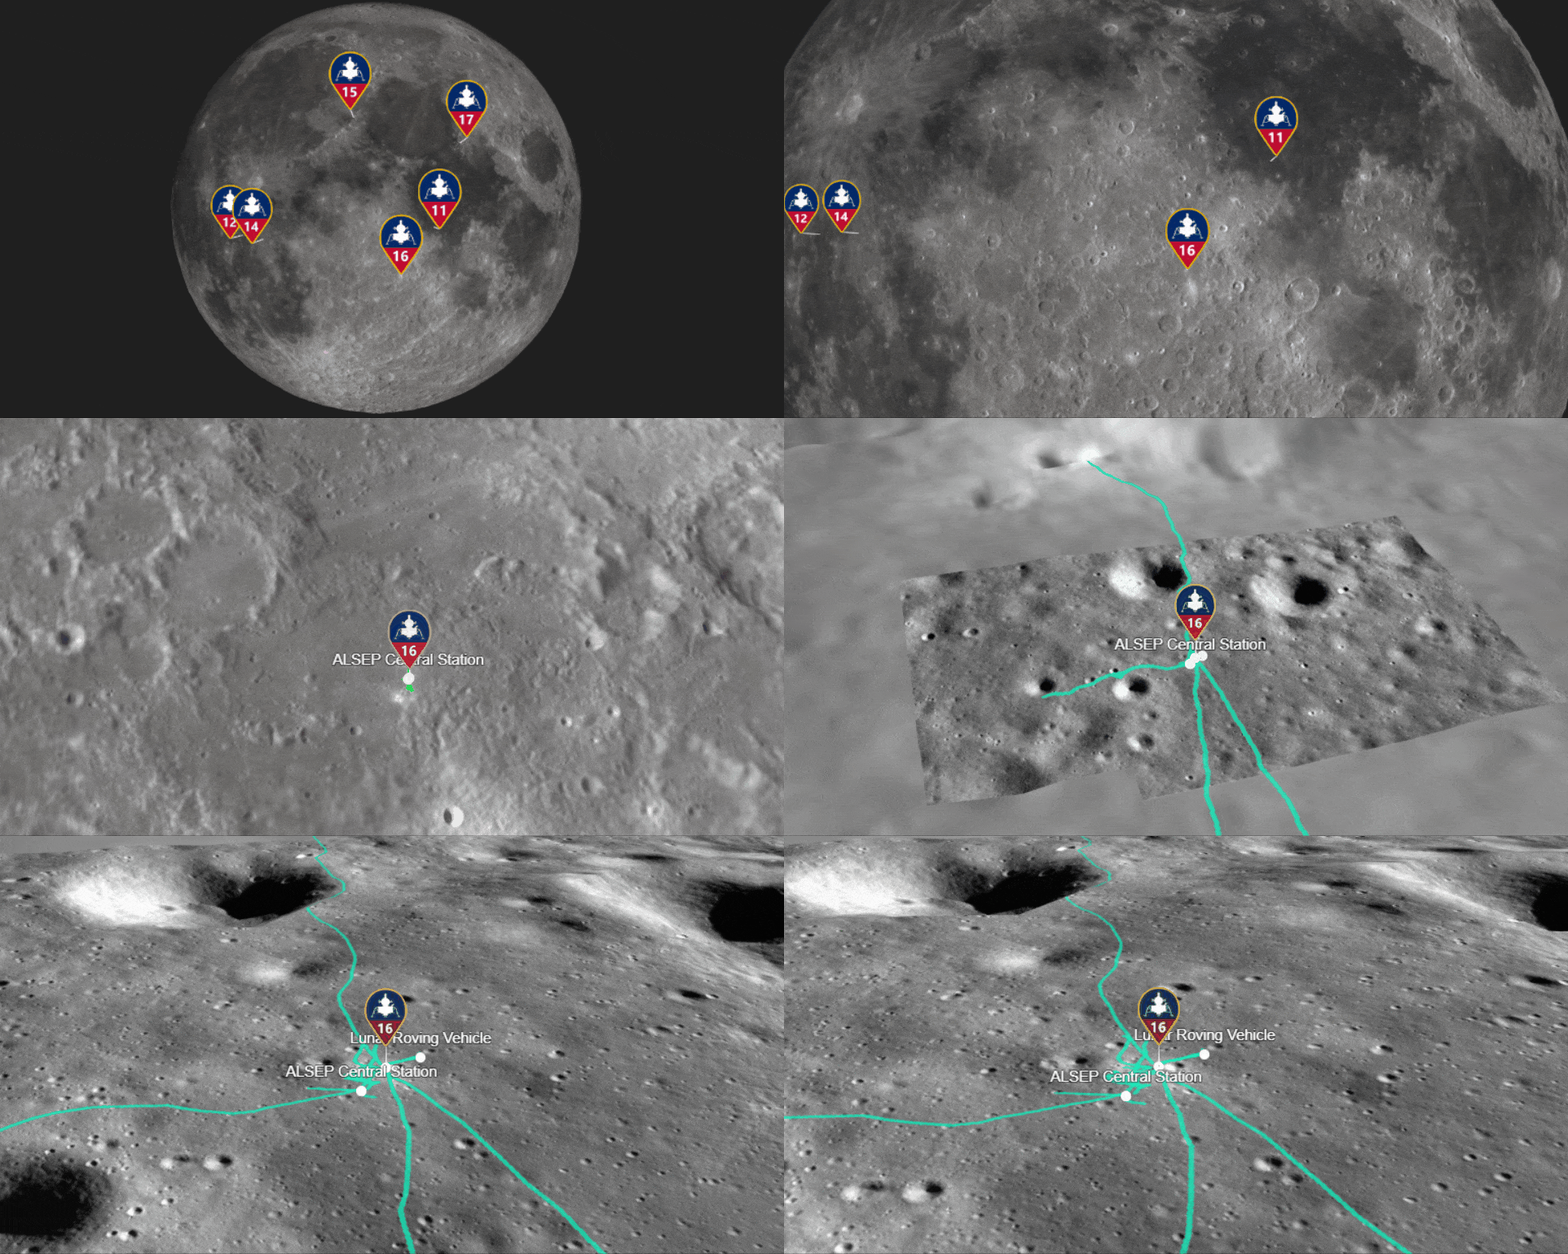
Watch the tile services instantly appear through a massive range of zoom levels.
If you’re going to give this a go, it is worth noting that global scenes in ArcGIS Online only support tile layers in Earth coordinate systems (Web Mercator or supported GCS: WGS 84 or CGCS 2000). To overcome this, you can either:
-
Manually reproject or georeference all layers to an Earth based coordinate system (I chose this method as it personally gave me a better-quality map).
-
Or, use the share web-tile-layer option and let ArcGIS Pro handle the conversion for you.
Creating Moon Elevation
Now, to really make the Moon craters shine, it’s time for the Elevation layer. Did you know you can publish your own Elevation layers to ArcGIS Online via ArcGIS Pro? I was helped by this blog to set-up and publish my own.
I decided to vertically exaggerate the Moon’s surface by a factor of 4 to make the topography of the craters stand out more to on small screens for mobile-accessibility. Note: The published Elevation layer (from ArcGIS Pro to ArcGIS Online) won’t keep any elevation set in Pro, so you will need to manually exaggerate the imagery data via the raster calculator.
Creating the 3D Moon map
Now I have the Moon imagery and elevation surface layers published to ArcGIS Online, I can make the 3D map. To do this I chose a global scene (used for ‘global’ data sets where curvature of the earth/moon is an important element) rather than a local scene (used for smaller extent content in a projected coordinate system).
I added in the Moon imagery as a 2D layer and the elevation surface layer in as a ground surface layer. To finish it off, I added some labels to show where the various ‘Seas’ are and crafted my own special Apollo Mission icons to mark the location of each Apollo landing site.
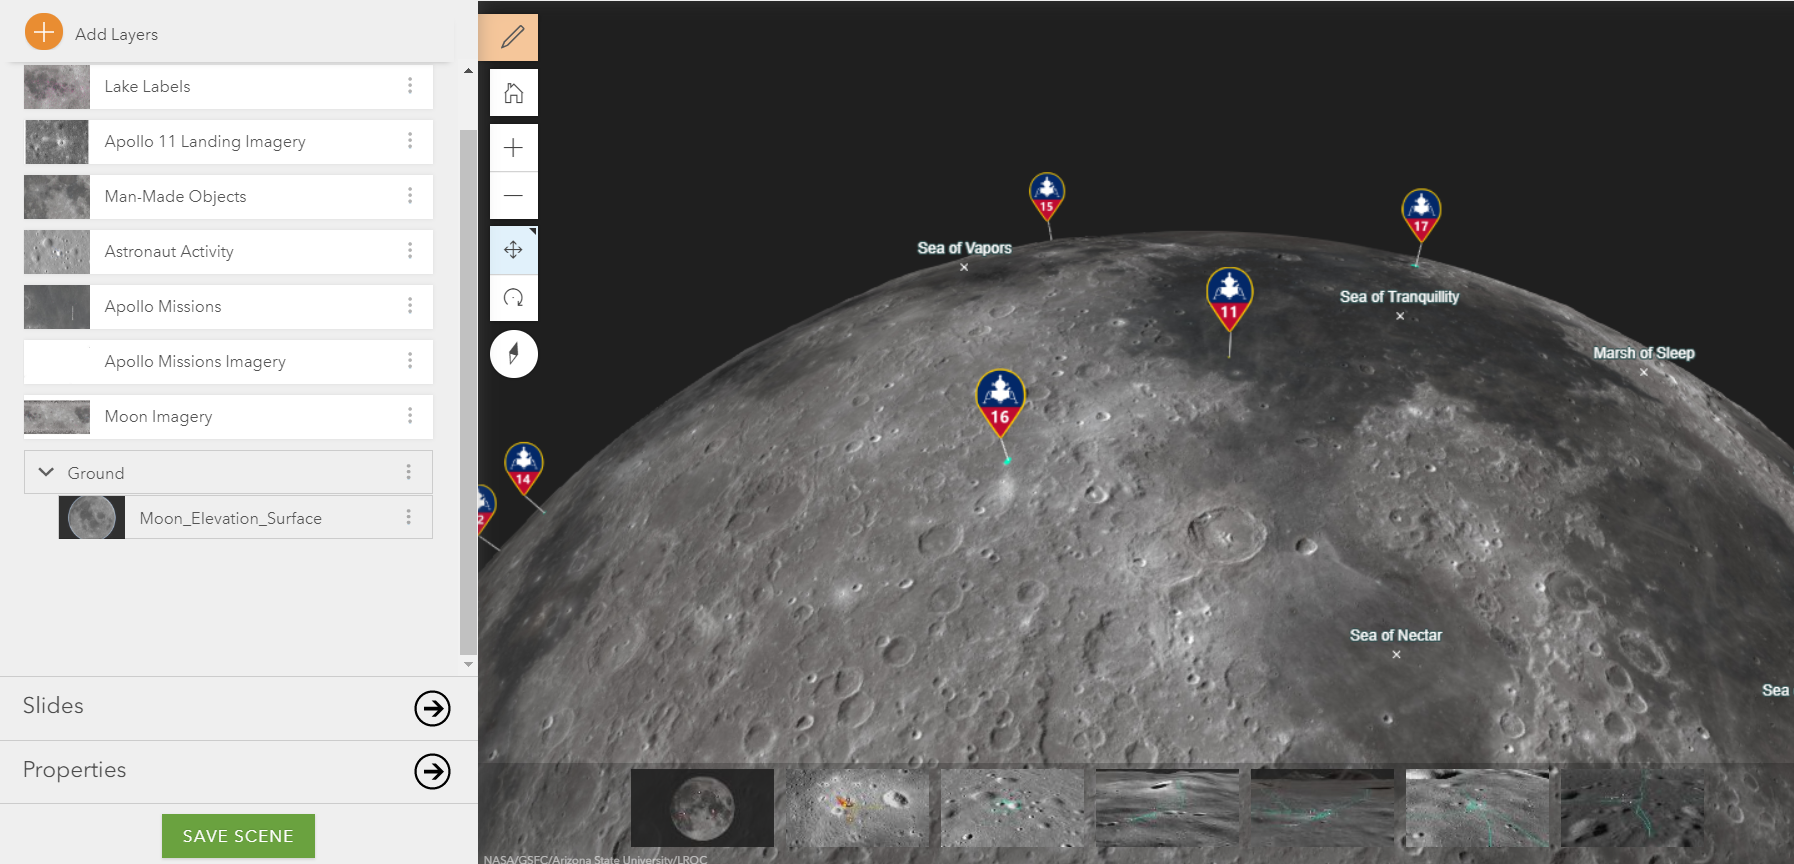
Its all coming together!
Future and beyond
As I’ve had so much fun making this map, it got me thinking where else in our solar system could we map? How about a map of Venus, Mercury or even Jupiter? I’ll leave that thought there…
Happy mapping!
