In part 1 of this series we demonstrated the processes for preparing your data for use in ArcGIS.com. Now we will start creating content on ArcGIS.com to share with colleagues and the wider world. As part of this section we will upload all of the datasets that we have created earlier (below) for sharing within our organisation.
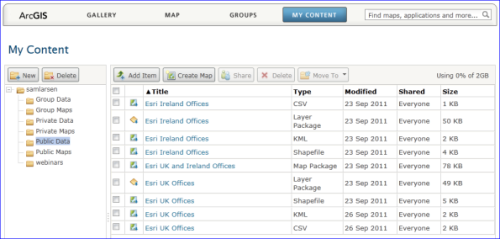 My Content on ArcGIS.com
View all the content on ArcGIS.com
Map and layer package sharing
 Open Map Package from ArcGIS.com
First we will have a look at the sharing of map and layer packages with others. This is as simple as uploading your packages to ArcGIS.com, filling in the appropriate tags, descriptions, usage constraints and sharing the content with the appropriate groups. Map and layer packages can be either uploaded directly in ArcMap using the upload selection when you create the package or they can be uploaded via the Add Item tool in the ‘My Content’ section of ArcGIS.com. Take a look at the best practice advice for sharing content on ArcGIS.com. Once you have shared the items via ArcGIS.com you or anyone who can see your content can then open it directly in ArcMap using the file open drop down (right).
View the map and layer packages on ArcGIS.com
Creating web maps with Shapefiles
Now we are going to create a map using the compressed shapefile we created in part 1.
- Create a new map by navigating to http://explorer.arcgis.com.
If you are not presented with a map, click the New Map button at the top left to start a new web map. - Add the appropriate basemap layer.
Again, I will choose OpenStreetMap as it is my basemap of choice. 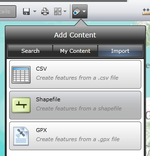 ArcGIS Explorer Online: Add ContentClick the Add Content button button and choose to Import data from a Shapefile.
- Follow the dialog instructions to upload your shapefile zip folder into the map.
- As this is a small data point data layer I will choose to not generalise my data when importing, so choose to ‘Keep original features’ when importing and continue.
- To configure the symbology you will need to click on the ‘Layers’ tab (1) on the left-hand panel. If, like my map, you have to change the name of your layer to remove unsightly underscores, click on the ‘Organise’ button at the bottom and edit the name of the layer. If there is a layer called ‘Map Notes’ that has already been added to the table of contents, remove it using ‘Organise’ also.
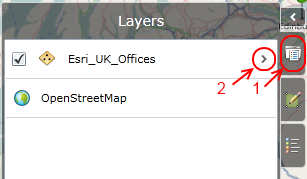
- To symbolise the layer, drill down into the layer properties (2).
- On the next screen, select Display -> Configure and then choose a symbol that is appropriate for you.
You can use your company logo icon if it is hosted on a web server somewhere, you can do this by choosing the custom symbol type and linking to the location of your logo icon. - To configure the popup, select Pop-ups -> Configure.
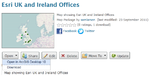
- First we will add the office image to our popup. Navigate to the ‘Media’ tab and then select ‘Add’.
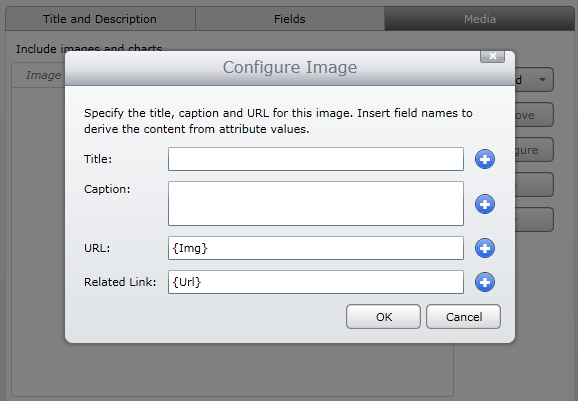 Remove the default title ‘Image’, we won’t display this. Add the Image URL to the URL field by using the blue Add buttons on the right of the field. Then do the same for the web address which will act as a link when the user clicks on the image.
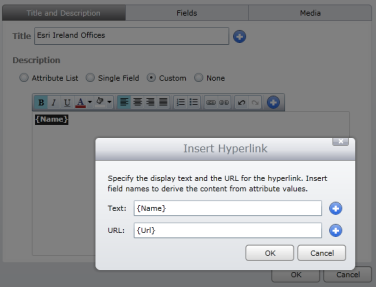
 - Then we need to configure the text content of the popup. Navigate back to the Title and Description tab and then select the ‘Custom’ option from the description radio buttons. Now we can add free text into the description. Here you can also use the blue Add button to add data attributes as text to the popup. We add the Name, Address, Phone and Fax fields on separate lines. For the Name field, we have chosen to make it a hyperlink back to the Url that we defined in our original data. To do this, select the ‘{Name}’ text and then click on the ‘Insert Hyperlink’ button and add a hyperlink using the {Url} field as the link location.
Now that we have finished creating our map with the shapefile data we can save it, fill in the metadata and add full public access to this map so that we can consume it in our website as an embeddable map.
View the shapefile web map on ArcGIS.com
Creating web maps with CSV files
Creating web maps with CSV files is much the same process as that used for the above shapefile workflow. The only difference is that the importing of data is slightly different. We’ll jump in at step 4 of the shapefile process:
- This time select CSV as the import format.
- Choose to browse for your file on disk and then follow the dialog to locate it.
- The data will be displayed in the text area to show you that the file content have been accessed, then click Next.
- The import tool will automatically select the ‘Address’ field as the Location field (this means that it will use the address field to geolocate the data). As we have already added coordinates to our data in the Point_X and Point_Y fields we will want to disable this by setting the data type of the Address field to Text. The second part of this process will be to register the X & Y fields as the spatial fields.
- To reference the Point_X and Point_Y fields as the locations fields we simply need to set the data type to Location, then in the subsequent Location Type drop down, choose the coordinate type (Longitude for Point_X and Latitude for Point_Y).
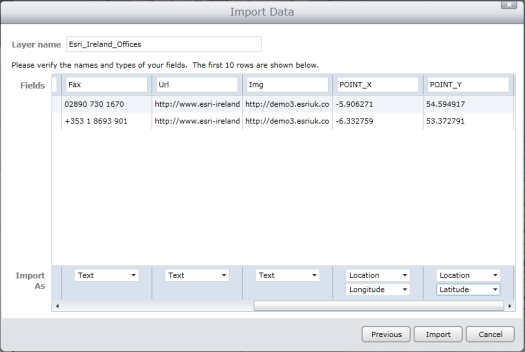
- Click Import and the data will be added to the map.
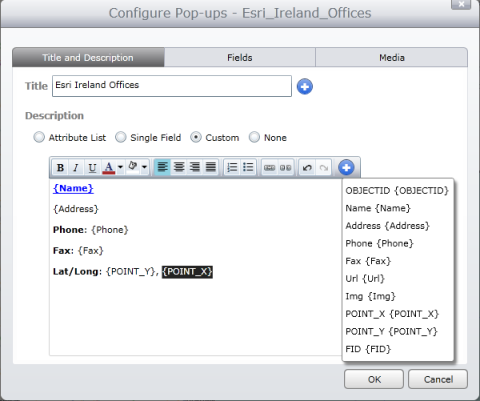
The CSV data we added also has the latitude and longitude fields which we can now add to the info window text. We do that much the same way as we did with the other text attributes (below).
Now that we have finished creating our map with the CSV data we can save it, fill in the metadata and add full public access to this map so that we can consume it in our website as an embeddable map.
View the CSV web map on ArcGIS.com
Creating web maps with KML files
Creating maps using KML files is a slightly different process, here we can access the KML files that we have uploaded to ArcGIS.com. When adding KML files all we need to do is add the KML layer from ‘My Content’ to the map. The symbology of the data is defined in the KML layer configuration therefore we cannot change the look & feel of the layer in ArcGIS.com.
View the KML web map on ArcGIS.com
OpenStreetMap Attribution
The OpenStreetMap (OSM) basemap layer does display the OSM attribution which is required by the licence, but I also add links to the project and the license in the Access and Use Constraints and the Credits fields of the web map in the form specified by the project.
Web Maps
I have made all of the above web maps fully publicly accessible to allow us to embed the web maps in our company website. You can do this using the ‘Share’ button when you are in the map and then selecting ‘Embed in Website’, that will give you the code that you need to drop into your website. The embeddable map is created using the ArcGIS API for JavaScript Compact Build, which, in short is a smartphone accessible web map meaning that people viewing your website on a smartphone (who may well be looking for your office) are able to view and navigate the map.
View all three web maps on ArcGIS.com
Conclusion
We’ve seen how to create and upload our office locations data to ArcGIS.com in various formats. We’ve also seen how we can consume that content on ArcGIS.com to create maps which we can embed in our website or share with others. ArcGIS.com is an evolving platform and new features are being added on a regular basis. Watch this space for new feature announcements.