It’s longer than I care to admit since I learned about Landsat as an undergraduate Oceanographer. Although I didn’t use satellite imagery in my subsequent research posts I did keep coming up against the challenge of accessing detailed data in a digital form. The growth in directly accessible digital data has seen a marked jump in the UK in the last couple of years. This can only help us to further our understanding of our world and our societies.
US Geological Survey (USGS) has been working to make Landsat imagery more readily available as a global resource. Their new LandsatLook Viewer platform provides visualization and simple image processing services that cover the whole world. Open access allows anyone to browse through over 3 million+ Landsat scenes using an ArcGIS for Server application to choose location, time and image enhancement. In some locations there are over 1000 overlapping scenes available going all the way back to 1972, allowing it to be used to explore how our world is changing through time. LandsatLook also allows users to perform basic manipulations, analyse scenes, and gain a basic understanding of the value of satellite remote sensing. The same site can also be used by the GIS and science communities to quickly locate suitable scenes, obtain detailed metadata and then download scenes for detailed analysis.
Alongside this, Esri have produced a similar website, esri.com/landsat. This site supports many Landsat image services that are free to anyone who needs to use Landsat. The services make multi-temporal and multi-spectral Landsat data accessible from within almost every computing platform, device and applications. Recent enhancements released within the ArcGIS Online Landsat Community group include better radiometric corrections and on-the-fly functions such as Tasseled Cap transform and de-striping to reduce the influence of the scanline corrector errors. For a remote sensing lay-man the description of the Tassled Cap transform was an interesting mental challenge, but I like the derivation of the name.
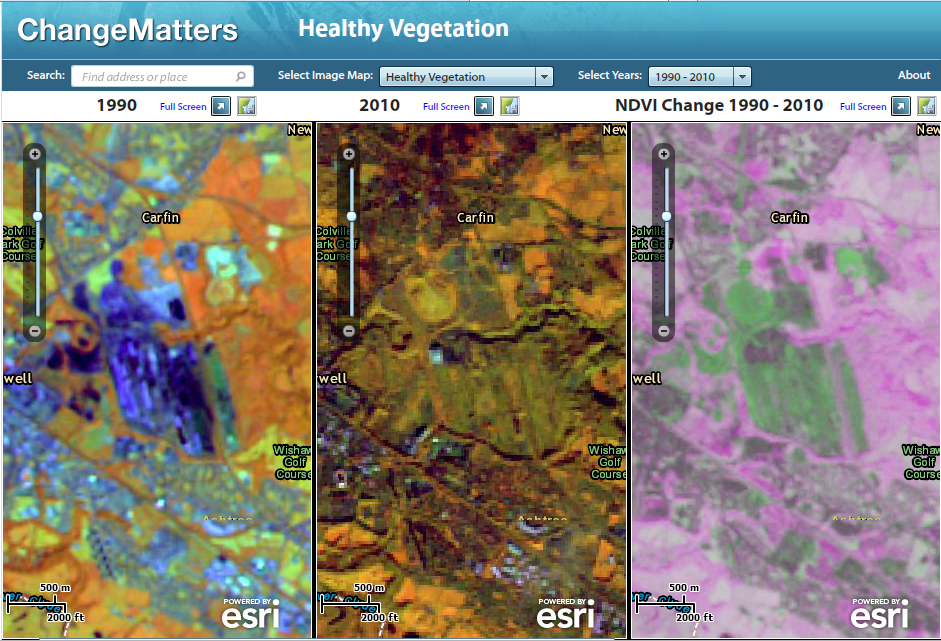
Esri developed these services collaboratively with the Department of Interior with the goal of making it easier for people to use Landsat data for understanding earth changes for the past 40 years. This site requires no software and processes the Landsat data dynamically in the cloud. There are some striking examples for: deforestation in Paraguay, wildfires in the Grand Canyon or urban growth on the Change Matters site with a tour function to illustrate the interpretation of the change.

Once I’d looked for where I live on a Landsat image, I wanted to find a UK illustration of land-use change. In contrast to the examples above, mine shows a “greening” of post-industrial land for the site of the Ravenscraig steelworks (which closed in 1992). The map panels are centred on the site with the left and centre panels showing it in 1990 when it was still operational and in 2010. The right hand panel highlights the change with the site showing as the large green area in the centre.
It would nice if the land had been reclaimed as an area of park or woodland but a quick look on ArcGIS Online shows that it languishes as a post-industrial wasteland.
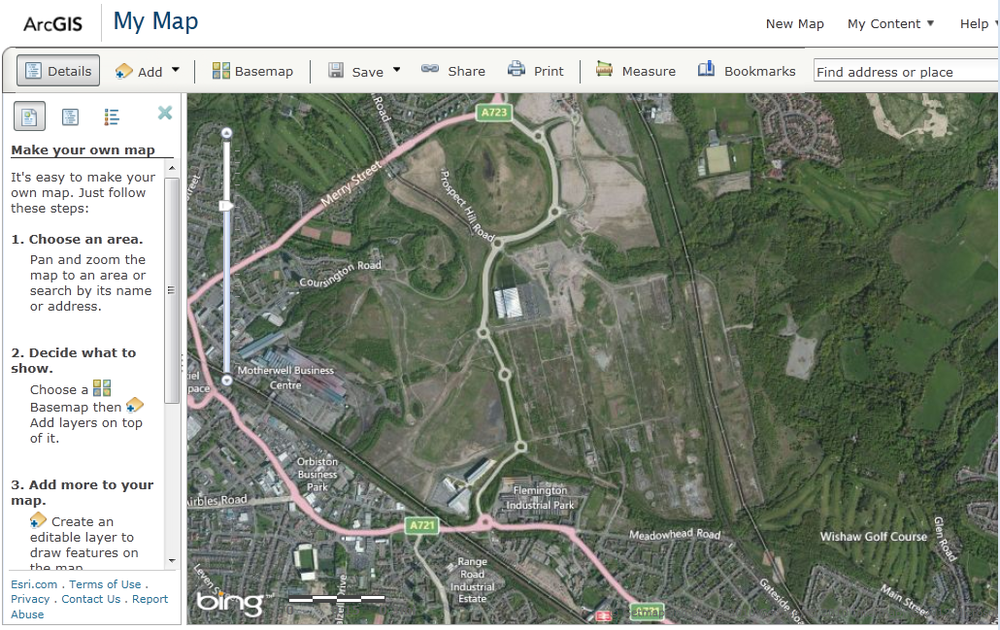
It has now been earmarked for the development as a new town (http://www.ravenscraig.co.uk/index.asp.) so in a couple of decades the Landsat images will show the vegetation/land-use pattern turning full circle.
The Esri Landsat services are showing a steady growth in usage and are being incorporated directly into projects for earth monitoring. Sometimes we increase our understanding when existing data is re-examined from the perspective of a different discipline. Perhaps the wider availability of Landsat imagery will be such a catalyst for insight.