One of the challenges I often come across working with Crime and Intelligence Analysts is how to identify hot spots of activity both spatially and temporally. Often referred to as Near Repeat Victimisation, the aim is to identify those areas prone to repeat incidents in a given time period. For example if neighbouring houses get burgled a year apart that may not be significant, but if 3 properties within 1km of each other get burgled within 10 days of each other then that is significant.
Using ArcGIS Desktop there are a number of ways to look at patterns in space or time. Spatial clustering can be identified using kernel density, aggregation to polygons or using cluster renderers. Temporal clustering can be identified using time clocks or summarising tables. Identifying clusters in time AND space is more challenging.
Previously I have tried to do this by creating multiple-layers split by time or using time aware layers, but these techniques involve chopping the data into specific time periods (e.g. a week, a month). Such techniques do not, therefore, help us to identify clusters that cross time periods. For example, what if the burglaries mentioned above happened on a Saturday and Monday and we were looking at one week (Sun-Sat) at a time. Also, these techniques rely on visual representation as the means of identifying patterns so are subjective at best.
At the release of ArcGIS 10.1, a new ‘Space-Time Clustering’ capability was introduced which provides tools for exactly this problem. Essentially this capability is an enhancement to the existing Hot Spot Tools within the Spatial Statistics Toolbox, but in a nut-shell this is how it works:
1. Using your incident data, create a Spatial Weights Matrix
This tool essentially models the relationships between features in your dataset. Traditionally it does this purely spatially (and there are a number of techniques for doing this), but at 10.1 it also includes an option for doing by space and time.

By selecting the SPACE_TIME_WINDOW for the Conceptualization of Spatial Relationships parameter, you can define both space and time settings:
Space – by specifying a Threshold Distance value
Time – by specifying a Date/Time Field, a Date/Time Type (such as HOURS or DAYS) and a Date/Time Interval Value.
For example, in my burglary scenario, I might set the distance to 1000m, theDate/Time type to days and the Interval Value to 10.
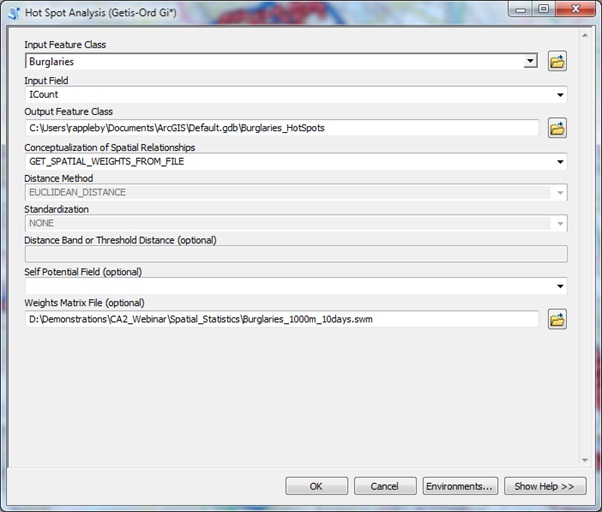
2. Having created a Spatial Weights Matrix, run the Hot Spot Analysis (Getis-Ord Gi*) Tool
This tool will then use the Spatial Weights Matrix file to identifies statistically significant hot spots and cold spots within your data using the Getis-Ord Gi* statistic.
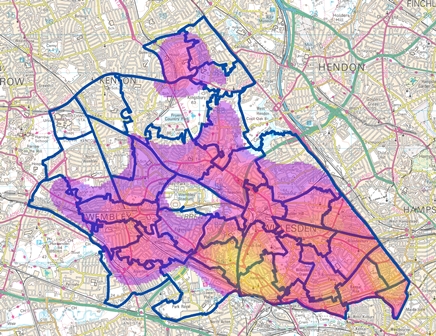
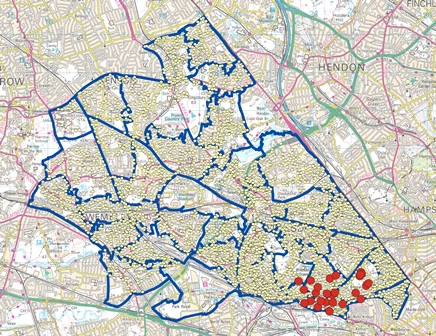
The result is really interesting as the two images below show. On the left is the typical density analysis I would run looking at spatial clusters only. On the right is the result of my Space-Time Cluster Analysis. Not only are the clusters outside of the density ‘hot zone’, they are also few in number and at specific locations, meaning that it’s far more useful for preventative policing actions. Finally, as the results have been generated using Getis-Ord Gi* they are not just ‘Hot Spots’ but spatially significant Hot-Spots; meaning the results are no longer subjective!
For more details on the Spatial Statistics Toolbox, refer to
http://esriurl.com/spatialstats
For a video overview of the Space-Time Cluster Analysis, see
http://video.esri.com/watch/2003/whats-new-in-spatial-statistics-space_dash_time-cluster-analysis