I was pleased to see that the 3.1 release of ProductivitySuite for ArcGIS 10.1 in April enables you to convert Ordnance Survey VectorMap Local (VML) data into an Esri geodatabase.
What is VML?
VML is a relatively new large scale mapping dataset from Ordnance Survey which is derived from the 1:10k colour raster and provides detailed mapping of roads, railways, vegetation, boundaries, urban extent and buildings across Great Britain.
Using our online map services
If you want a hassle-free basemap incorporating VML data, don’t forget that Esri UK provide two VML based Premium online map services which you can subscribe to:
- The OS VML Basemap is ideal for mapping where detail down to MasterMap level is not required.
- The OS VML and MasterMap service combines the VML and MasterMap data to provide a highly detailed map, enabling you to seamlessly zoom down through road, railway and urban extents in VML to the detailed roads and buildings of MasterMap.
Converting and managing VML data yourself
Perhaps you need more control over how you view and use VML data? If you have many varied requirements and want to create basemaps based on different combinations of features for specific projects, you can process and manage your own data holding using ProductivitySuite 3.1.
OS Data Converter
Here I just want to highlight the steps in the OS Data Converter wizard which are new for VML or where the VML options vary from those for the other OS datasets. The changes are as follows:
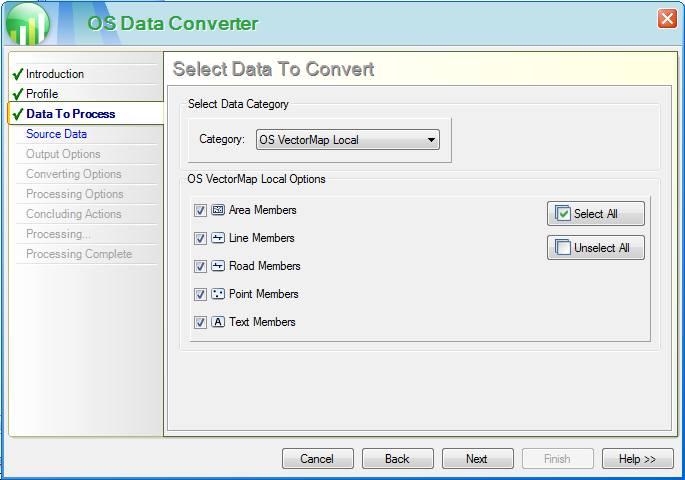
1. On step three, Data to Process, you can now pick VectorMap Local from the pull-down list of datasets. This selection determines the wizard pages you then see.
 Tick at least one type of feature to load, either by ticking them individually or using the Select All button. Options are:
- Line Members (all linear features, e.g. administrative boundaries, road outlines, building outlines)
- Road Members (all roads, which may include associated name and/or number)
- Point Members (all point objects)
- Text Members (annotations)
In step five, specify the Output Options including the storage type. For VML data, you use the same processing and loading options for full loads and for Change Only Update (CoU). This is because each affected tile in a VML CoU is updated rather than just the individual features (as in MasterMap etc.).
2. Converting Options are specified in step six. VML data works with both layer files and representation classes and, subject to having a Standard Desktop licence, both are created when the data is loaded. You can select a symbology style in this step and also choose whether you want to save the cartographic representations in an ArcMap map document. If you are using a Basic Desktop licence you will get errors during the load saying ‘unable to assign style to dataset’. In the next release the help and wizard will be updated to warn you of this at an earlier stage. You will still be able to use the layer files.
3. Style Options: there are five styles available for setting the symbology used to define representation classes in the database: Black & White, LandPlan, Standard Style 1, 2 and 3 and Streetview. The layerfiles used by each style are installed in subdirectories under the install folder <install>\symbology\VML. Layerfiles draw quickly and use less disk space so are ideal for national or large datasets.
Map Document: you can create a map document to store the representation classes and optionally save the symbology in the map document.
A note on Cartographic Representation classes: these are stored in the geodatabase as part of the feature classes. They enable you to represent features cartographically without having to modify the underlying feature geometry by using a combination of symbols, rules, overrides and graphic edits. So, for example, you can display a dataset in many ways depending on the scale and detail required without having to store multiple versions of the data. Representation classes are also worth considering when you want patterns in a shading to retain their proportions as the map scale changes. However, they are generally slower to draw, use more disk space than layer files and require a Standard licence to create and modify them.
Please see the ArcGIS for Desktop 10.1 help for detailed information on representations.
Here I’ve selected Standard Style 1 and created a map document to store the symbology.

I can immediately use it in ArcMap by opening the map document as shown here.
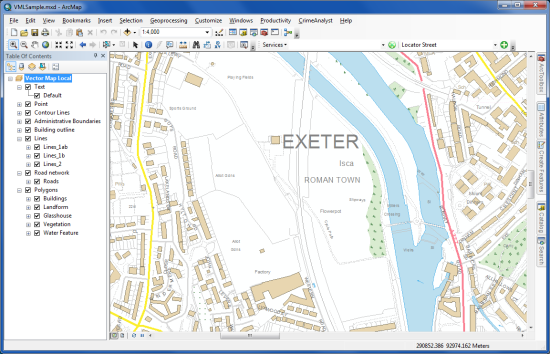
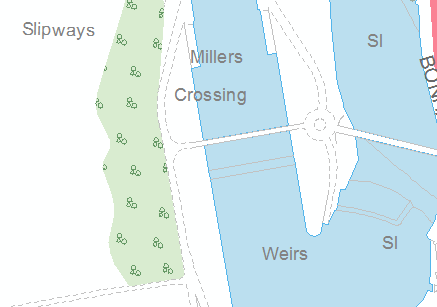
Notice how the patterns in the woodland areas display correctly at all scales thanks to the use of representations. The same symbols appear at the same location within each feature as I zoom in and out.
So these are the VML support highlights in ProductivitySuite 3.1.
Further information
- The installed ProductivitySuite help for a more detailed discussion on the whole conversion process. For symbolisation see ‘VectorMap Local – Additional Information’.
- The Ordnance Survey’s VML guide for details on the different stylesheets.