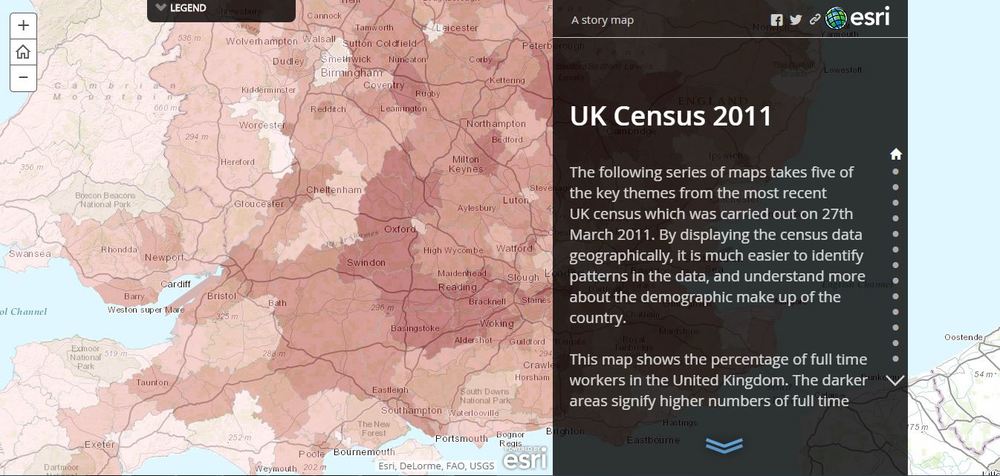
We have been working on improving the way to access UK census data and have provided 2011 UK census data as a series of dynamic map services allowing users to change symbology, view pop-ups and carry out analysis using the data in the ArcGIS Online Platform. These services will replace the Census map services currently available for the UK through the free Esri UK Online services. These services will be retired on the 8th of December 2014.
The Census web maps and layers available through ArcGIS Online take five of the key themes from the 2011 UK Census and symbolise these using three sub-themes for comparison purposes. The individual maps have also been consolidated into a ‘UK Census 2011 Story map’ available from the ArcGIS Online homepage – http://www.arcgis.com/home/
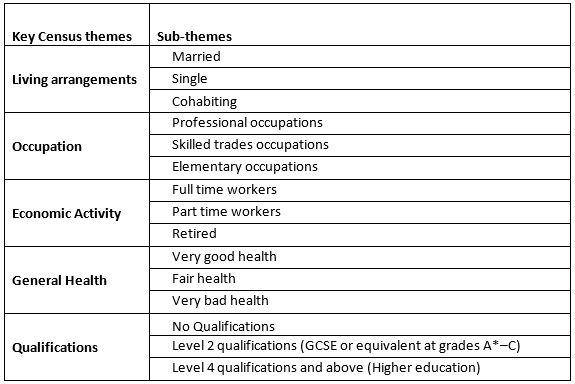
The table below shows the themes and sub themes that are now available as web maps:-
The web maps can be viewed through the ArcGIS Online viewer or within ArcGIS for Desktop. The maps are built using 5 levels of geography which are scale dependent to ensure better display performance. The following table shows the boundaries that will be displayed based on the zoom scale of the maps.

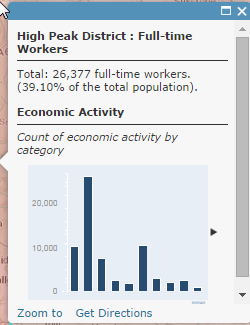
The maps all have dynamic pop-ups allowing you to query the data. They show absolute values as well as a percentage of the total to allow easy comparisons between areas. Tables are included which show statistics of related variables for the theme (as seen in screenshot below).
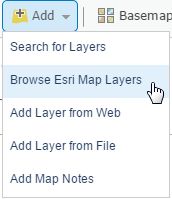
The data is also available as dynamic feature layers and can be added through the Esri Map Layers dialog box. Simply sign in to ArcGIS Online, open a map centred over the United Kingdom and Select ‘Add’ > ‘Browse Esri Map Layers’.
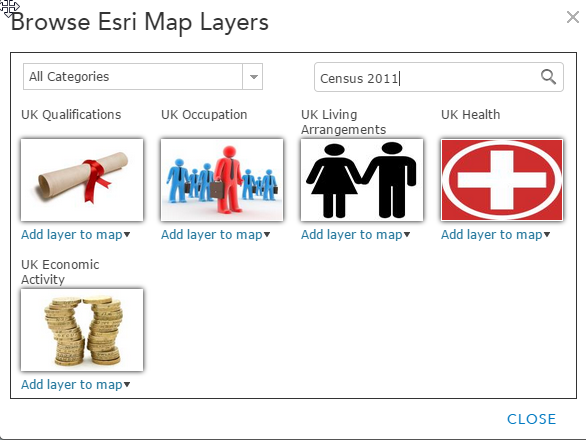
There are five layers, one for each of the themes listed in the table above. Tags have been applied to the layers to help make them easily searchable within ArcGIS online. All the maps and layers have been given the tags ‘people’, ‘demographics’, and ‘Census 2011’. Additionally the tags ‘Qualifications’, ‘Occupation’, ‘Living Arrangements’, ‘Health’ and ‘Economic Activity’ have been applied to the appropriate layers.
These layers can be added to the web viewer or used within Desktop for further analysis. The visibility thresholds applied in the web map also work in the feature layers, and as they are dynamic the symbology and pop-ups can be configured to suit the user.
If you have any comments please get back to the Content team at Esri UK. content@esriuk.com