As ever, this update to ArcGIS Online brings us a mixture of new capabilities and further refinements to the content management and administration functions. I’m just going to cover a couple of the key changes, so please take the time to check the what’s new page for the full list.
The big Item
Perhaps the biggest change in this release is a major restructuring of the Item page – to make it easier to view and manage the properties of your ArcGIS Online GIS resources. The page for each Item now presents an extended set of functions, across a set of tabbed views, rather than being a semi-static information page with links to options. This works particularly well for feature layers:
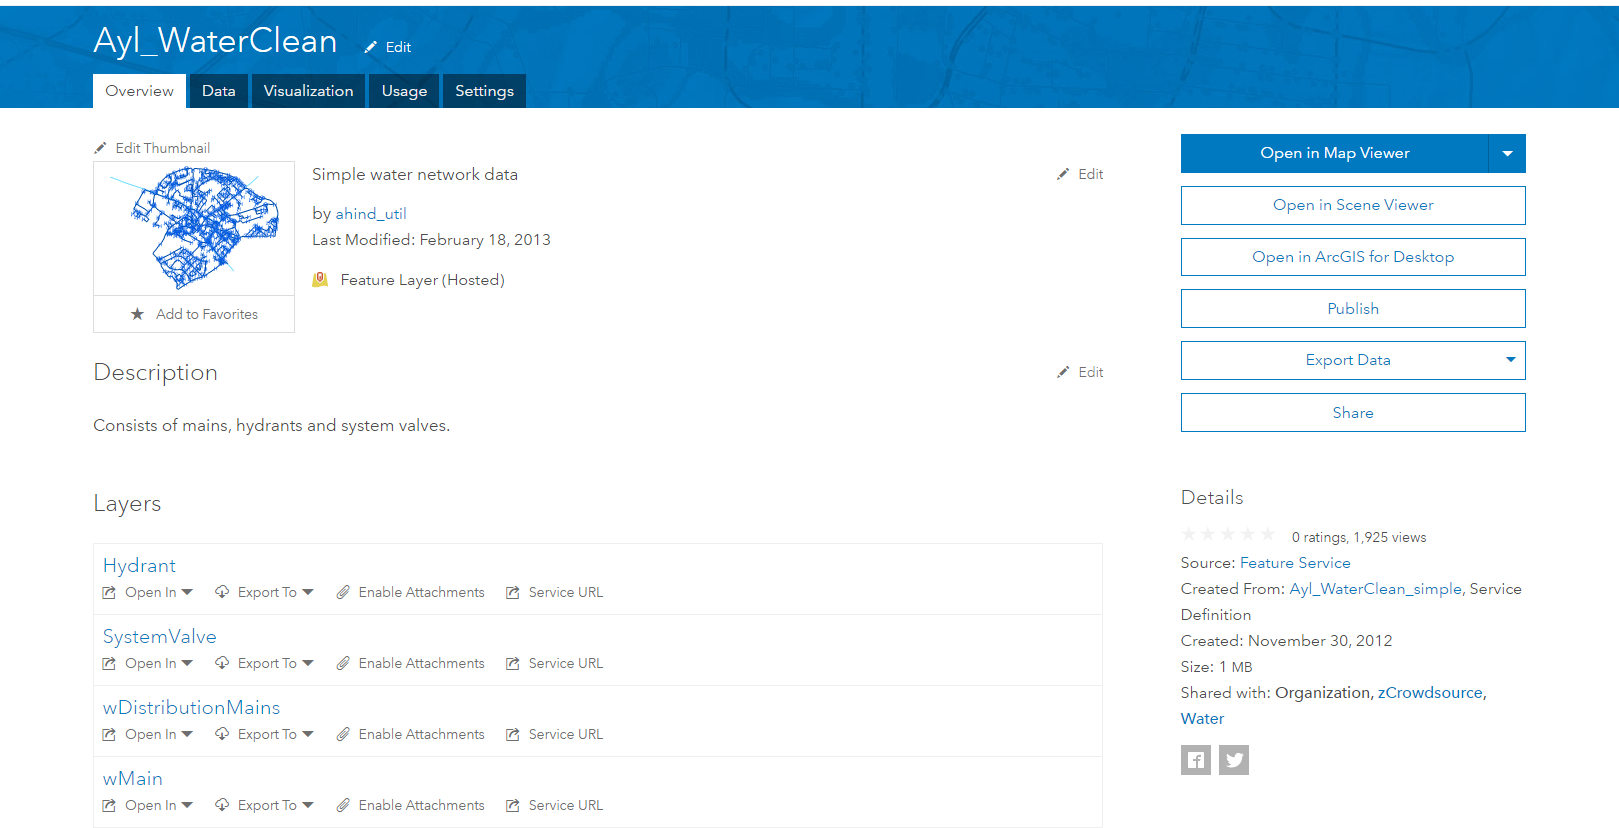
If you are accessing an Item that belongs to someone else then the Overview tab shows the item owner and all the important descriptive details. For a feature layer item the action buttons at the top right allow you to add the layer to the Map Viewer or Scene Viewer. The other tabs though, provide new options – you can view the data directly using either the Visualisation tab, for a map view, or the Data tab for a table view of the data.
The new structure makes it easier to get a feel for a feature layer but it really comes into its own for managing layer’s that you own. As the Item owner the tabs allow you to update the layer configuration and even the data directly from the Item view. In the Overview tab each metadata element has its own edit option. The Data tab lets the Item owner view, sort and edit the data fields – as well as viewing summary statistics. In the Visualisation tab the Item owner can update the layer settings for: the default symbology, the pop-up menus, the labelling and apply a filter. It also gives the option to Save As to create a duplicate copy of the layer. The owner also gets access to additional tabs. The first gives you usage information – similar to the usage graphs the organisation administrators can access. The other new tab lets you change the Settings for the Item. For a Feature layer this is where you change the edit settings and choose whether a layer can be exported and/or synced.
There is a video that takes you through the new functions in this Esri blog.
Time is of the essence in the new Smart Mapping options
Coming back to the smart mapping tools in ArcGIS Online after working in ArcMap makes me appreciate just how easy they make it to symbolise data. In this release a set of new options have been added to visualise time based aspects of your data. You can show how old different features are, or when events occurred. There are also some less obvious options like showing whether the time value for features is before or after a date. You can also show time combined with other data. Thanks to my colleague, Chris, you can see examples of these presented in this storymap (incidentally Chris used the new Story Map Cascade app that got it’s beta release in this update). There are more details about the new functions here, with links to example maps.
These symbology options are complemented by the option to filter by date and a new version of the Time Aware app template with improved configuration options for date and time fields and “what’s new in the last 24 hours” option. This could give you a live view of current incident data or a map of new data being captured (remember to consider Operations Dashboard if you need more information panels).