This ArcGIS Online update includes lots of new functions and capabilities across the board, so lets take a look at them by category.
Mapping
If you follow John Nelson’s blog posts you might already know what firefly symbols are. If not, have a look at the example below. These are now available and are great way to make data more striking – especially against the Dark Canvas Basemap. They work with clustering too.

Have you got line features that have direction? Arrows can now be added to lines, with or against the direction of digitising.
We recently looked at using Arcade to enhance mapping and labelling in ArcGIS. Imagine if you could follow this on-the-fly approach but using geometric expressions… …now you can. How could you enhance your maps by normalising data by area, testing spatial relationships or computing distances?
Also, GeoJSON files can now be added to a map.
Analysis
The big story in analysis is the introduction of Insights to ArcGIS Online. We’ve talked about this exciting, interactive approach to exploring spatial data before and if you’ve been to our conferences you’ll have seen it in action. The introduction of Insights makes ArcGIS Online an ever more powerful system for analysing, as well as presenting, GIS data.
I’ve used the point aggregation tools a couple of times and, although there were preconfigured grid and hexagon bin layers, it’s nice to see the option of generating custom bins within the Aggregate Points and Summarize Within tools.
There’s also a new tool for generating the centroids for line or polygon – with the choice of creating true centroids or a within feature centroids.
The new Operations Dashboard for ArcGIS comes out of beta in this release and you can now create and share dashboards all through a browser. I needed to put a dashboard together this morning and being able to build it within ArcGIS Online felt a lot more intuitive. The way the builder works is different to the old Windows app, but I got a feel for it pretty quickly and found it very easy to rearrange items in the dashboard. I used two map panels and added some actions to synchronise these and update the other controls to reflect the features visible in the maps. Well worth a look.
Data collection and management
Although feature layers can be used to capture new data directly, there are cases where it would be better to bring new data in through a different path and periodically add the new features. Layer owners and administrators can now append data to an existing hosted feature layer, without needing to overwrite the entire hosted feature layer.
If you are using ArcGIS Online to map data that is being managed as a CSV or an Excel spreadsheet you can work directly with files stored in a cloud drive, such as Microsoft One Drive and Dropbox.
Hosted feature layer views introduced the ability to control the data users see, but this becomes a lot more flexible with the ability to define an area of interest. A customer recently asked if they could set up apps for their different regional teams, that just showed the data for their region, and now there is an easy way to do this.
The edit options for hosted feature layers and hosted feature layer views have been made more flexible – with a wider set of options under What kind of editing is allowed?
Content and organisation management
Data changes over time and sometimes the best way to manage this is through a phased transition. You can now mark an item as Deprecated or Authoritative – to help users understand when an item is moving to retiral and what they should use instead. When a user is adding layers to a map there is a new tick box to search only for authoritative layers. Any marked items will show the appropriate tag when it is listed in content views.

The app launcher in ArcGIS Online gives quick access to the Esri apps but can now do more for your users. As an admin you can choose additional apps to feature in the app launcher, another way for users to find your key apps. If you don’t have an icon for your apps you can choose an short code to make them easier to spot at a glance:
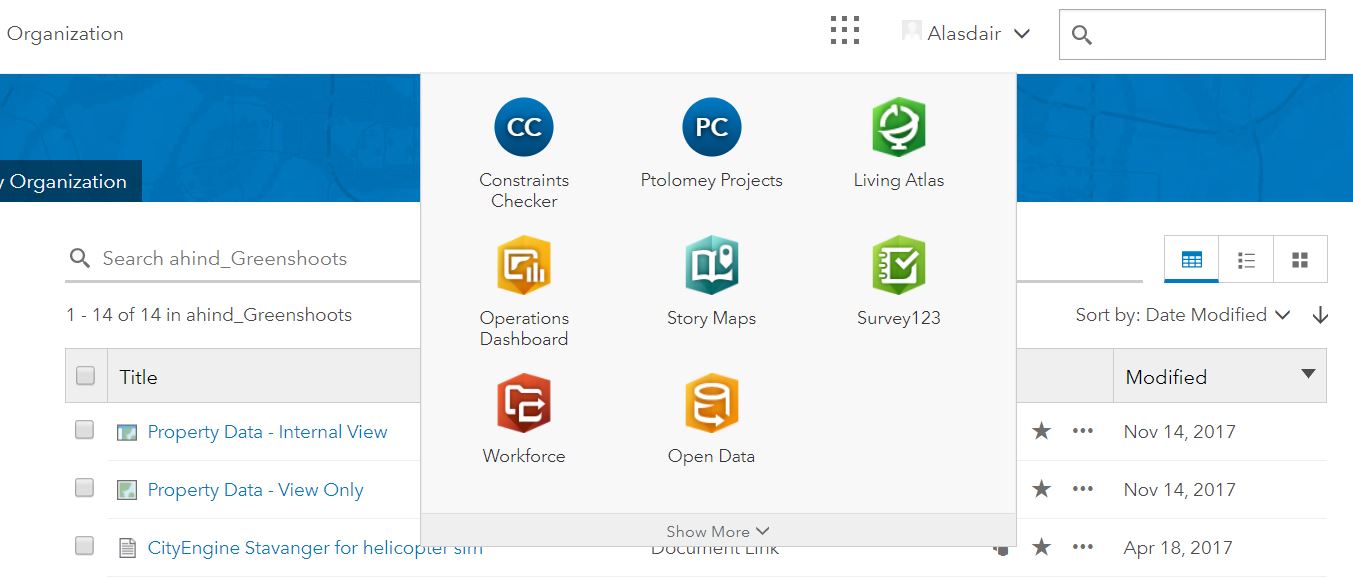
Users will have different goto apps and can now arrange the items in the app launcher. They can also drop ones they don’t use into a panel that defaults to hidden. You can still access these by clicking Show More.
There are lots of other new features for administrators. These include the ability to use SAML based enterprise groups for controlling the membership of new organisation groups. If you delegate the ability to update member account information this now includes being able to reset passwords. You can also choose to prevent ArcGIS Pro users from taking their license offline, if this better suits your working practices. You can also change the url for hosted layers to reflect their changing purpose, e.g. a layer that has moved from dev to production.
3D
Presenting your data in 3D can add a new level of understanding for your audience. If you’ve gone to the trouble of creating 3D representations your users can now get more from that data by taking measurements in a Scene. The tool provides feedback to show where on the feature the measurement will start and end. Rather than just the point to measurement you also get the horizontal and vertical differences:

Behind the scenes there’s been lots of work on improving the performance of Scenes and get a more consistent front to back drawing sequence. Also, your organisation can now have custom web styles for Scenes configured to help maintain a consistent look to apps. Support for 3D symbols has also been extended.
There may be a couple of things I’ve missed from this tour so, as ever, take a look at the What’s New page for the full list.
![]()