Over the past few months, the Living Atlas has been bolstered by great new additions from some of the UK’s most recognisable organisations. As such, I thought I’d challenge myself to use as many of these as possible on a hypothetical project. As a geography graduate, I have seen my fair share of land suitability maps – although, and I probably shouldn’t be saying this, I had never actually built one using ArcGIS. In this blog I’ll walk you through the process of finding a suitable site for a new housing development, taking into account various social and environmental factors provided by the Living Atlas. It is worth noting that to recreate the steps, you will need a copy of ArcGIS Pro, a named-user account to access the Living Atlas, and the Spatial Analyst extension for much of the analysis.
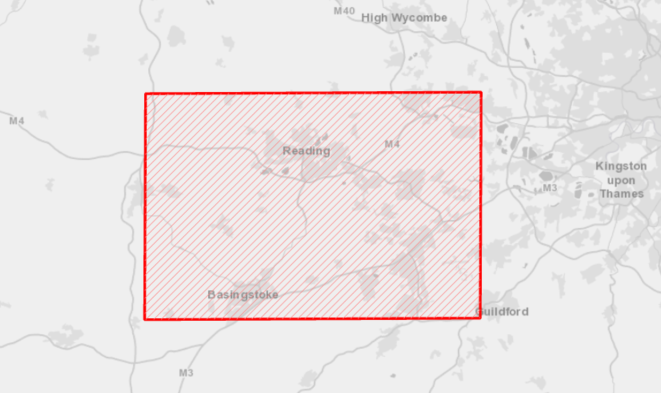
In my fictional scenario, a property developer has enlisted my GIS powers to identify a site for some luxury new retirement homes in an area in the south of England. The site must be a 2 km square within the AOI (below), but not in the local authority districts of Reading, Rushmoor or Bracknell Forest. It is crucial for the site to be as level as possible but not in danger of flooding. To add value to the development, the site should be as close as possible to areas of natural beauty, road access links and other retirees, while keeping a distance from Crossrail works.
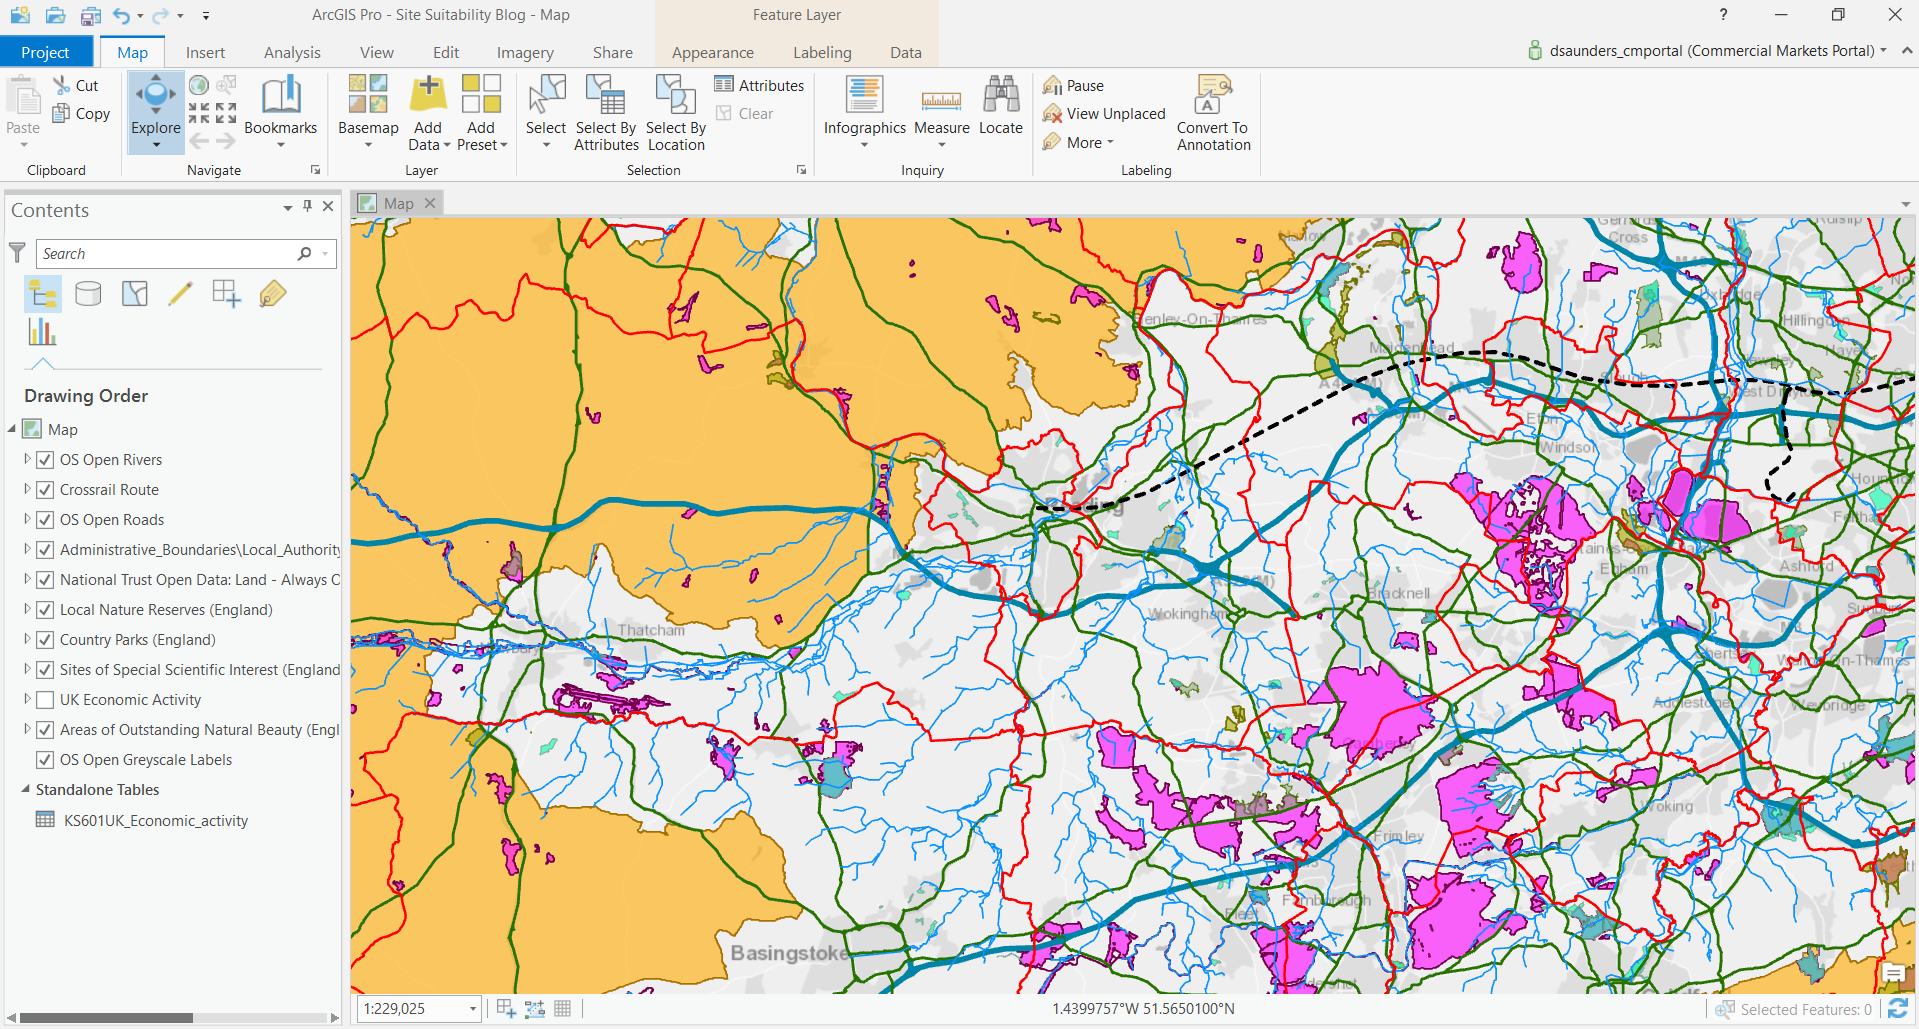
I’m going to use a dozen datasets from the Living Atlas to help me determine the best location for the site.(listed below). When all of these datasets are overlayed it is overwhelming:
Here’s the full list of the datasets with links to their item page:
Ordnance Survey
Natural England
- Sites of Special Scientific Interest
- Country Parks
- Local Nature Reserves
- Areas of Outstanding Natural Beauty
National Trust
Environment Agency
Crossrail
Office for National Statistics
Esri UK
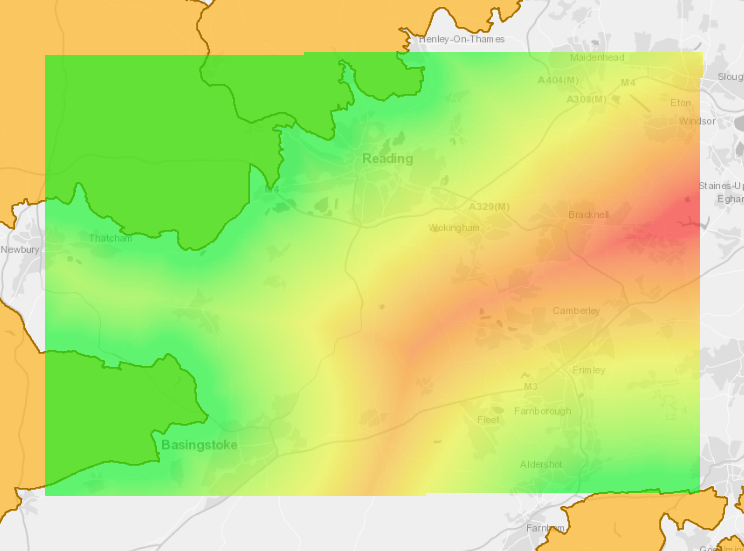
To make sense of all of this information, we need to start performing some analysis. Various geoprocessing tools can be used in ArcGIS Pro to mark inputs as factors and constraints. Factors are those inputs that might be scored according to their proximity (e.g. it is beneficial to be near to a lake), whereas constraints are those areas in which we cannot build (e.g. we cannot build on a lake). The next image shows the proximity to Areas of Outstanding Natural Beauty (AONB) produced using the Euclidean Distance tool. Each pixel is scored according to its straight-line distance to the AONB (the areas in orange), with green denoting the favoured areas of the raster:
I also used the Euclidean Distance tool for the additional environmental factors that are also constraints, like the lake example. In these cases I also masked the factor areas with Reclassify, because it’s not possible to build inside any of these areas. For each of these the outputs were normalised using the Raster Calculator, to score each from 1 to 100. This is so that I had a standard scoring system to input these factors into my site selection later.
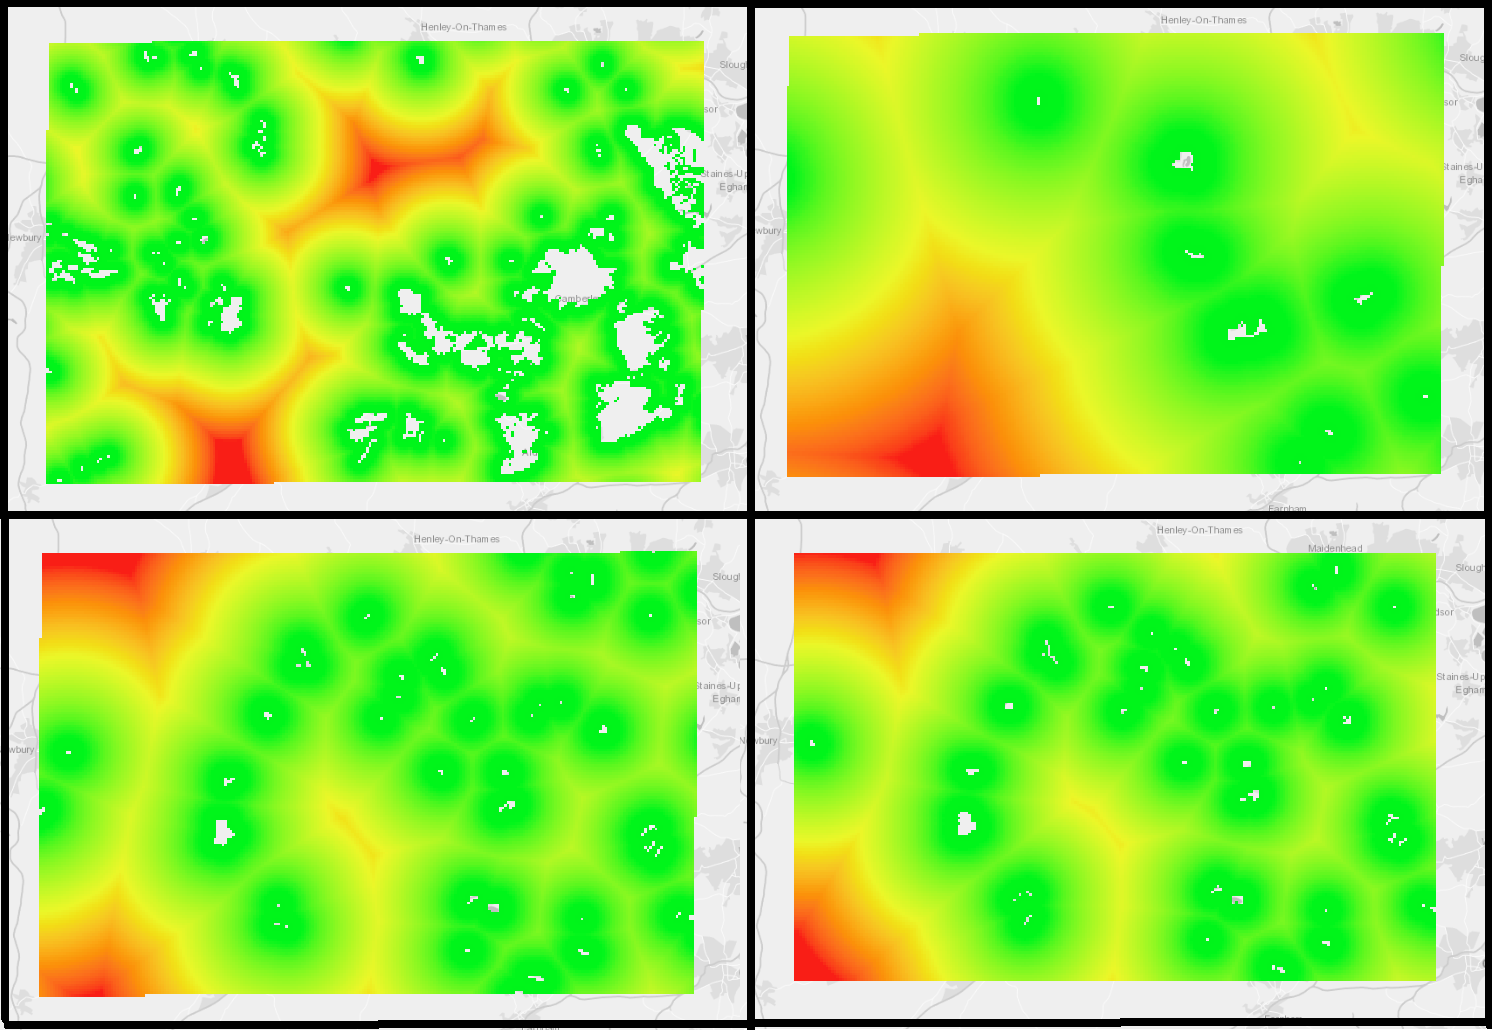 From top-left: SSSI areas, top-right: Country Parks, bottom-left: Local Nature Reserves, bottom-right: National Trust Open Land
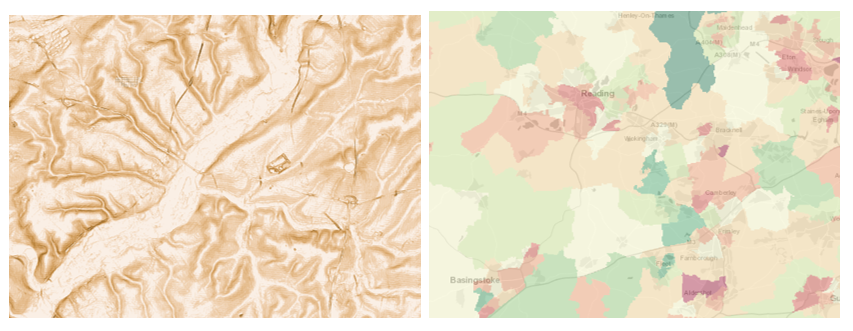
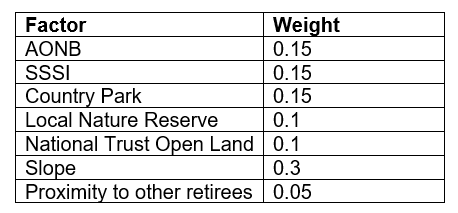
That left two remaining factors to consider before I moved on to look at combining the scores: slope and retirees. I obtained the slope (in degrees) by applying the Slope geoprocessing tool to the global Terrain layer. Retirees were taken as the average population percentage, according to the 2011 Census, per Middle Super Output Area (MSOA). These were then both normalised as per the previous inputs.
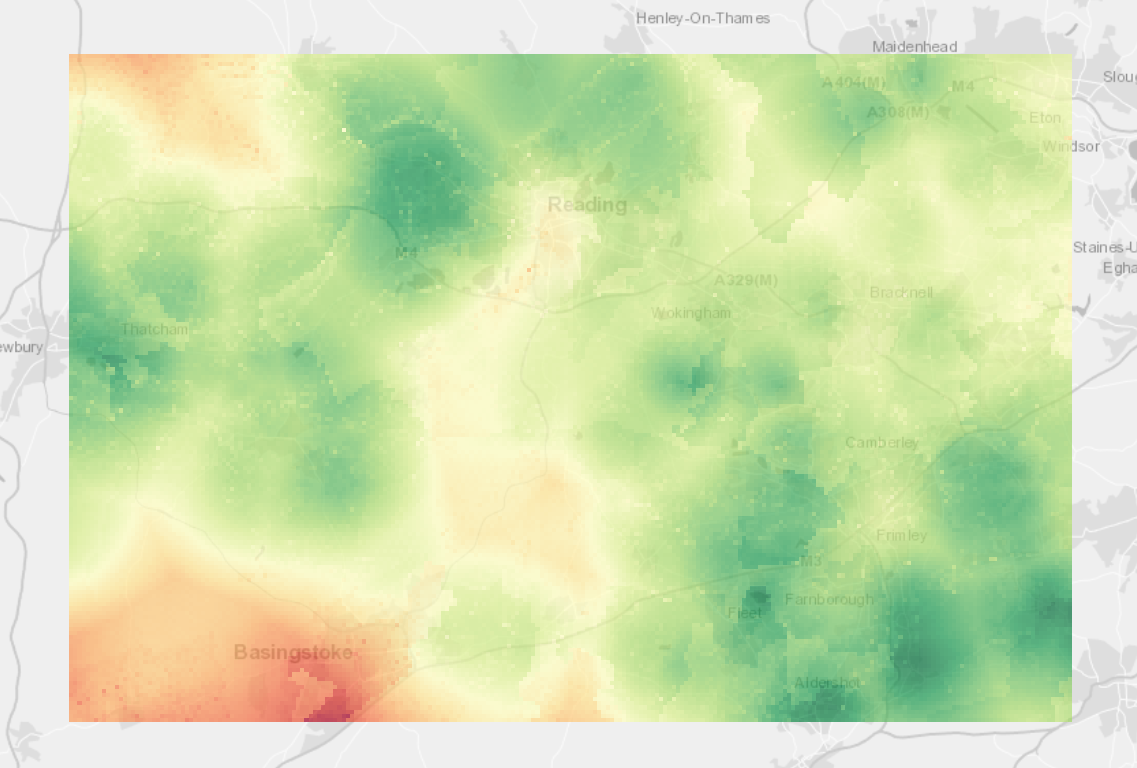
With all possible factors scored, they needed to be combined before the constraints were considered and a suitable site is found. I used Weighted Sum to combine the layers; applying a weight to each one according to its perceived importance in the decision making process (see table and image output below).
The resulting raster shows the highest to lowest (from green to red) scored areas for building retirement homes, based on the various input factors.
The constraints then need to be applied to exclude the areas in which the development cannot be built. To recap, the development cannot be built:
- in the local authority districts of Reading, Rushmoor or Bracknell Forest
- within an Environment Agency Flood Alert Area
- more than 2.5km from an a-road or motorway
- within 5km of Crossrail development
The first step was to generate rasters to map the constraints (with buffers for the distance constraints). The constraints were then subtracted from the previous raster through use of the Raster Calculator. This gave me the final land suitability assessment:
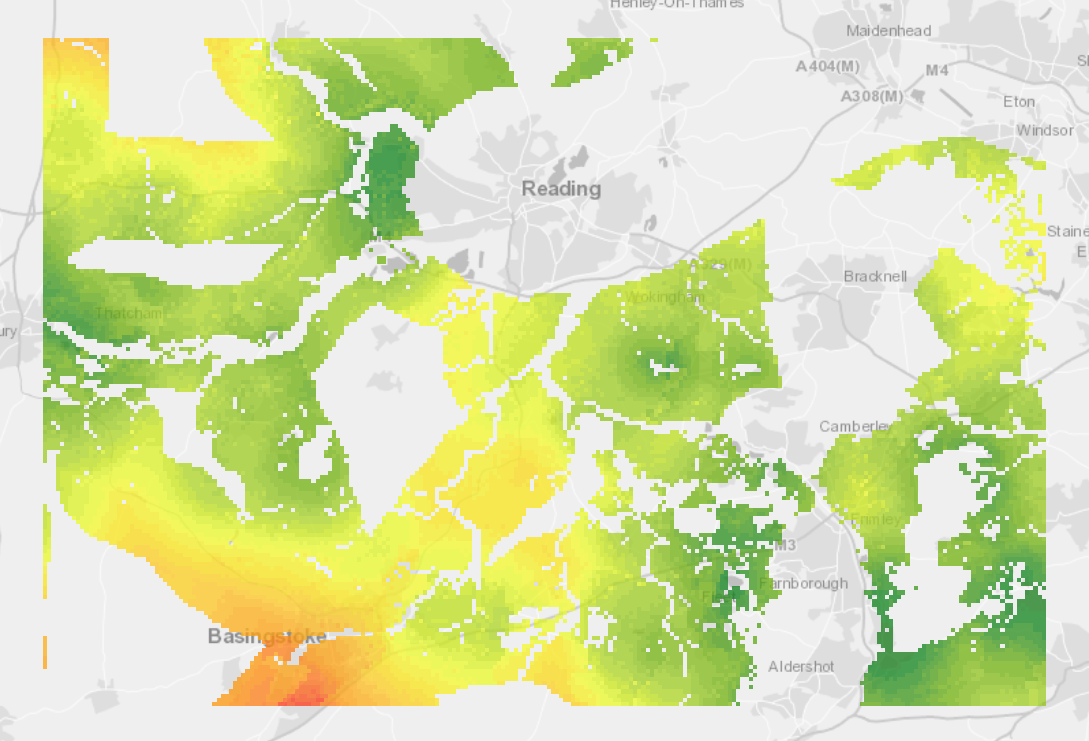
Finally, I asked ArcGIS Pro to locate the region for me. The map (above) let me get a general feel for the best places to build my housing development, but I used the software to objectively find the best site based on my criteria. Using the Locate Regions tool, with my region set to 2km square, I obtained the best site (below).
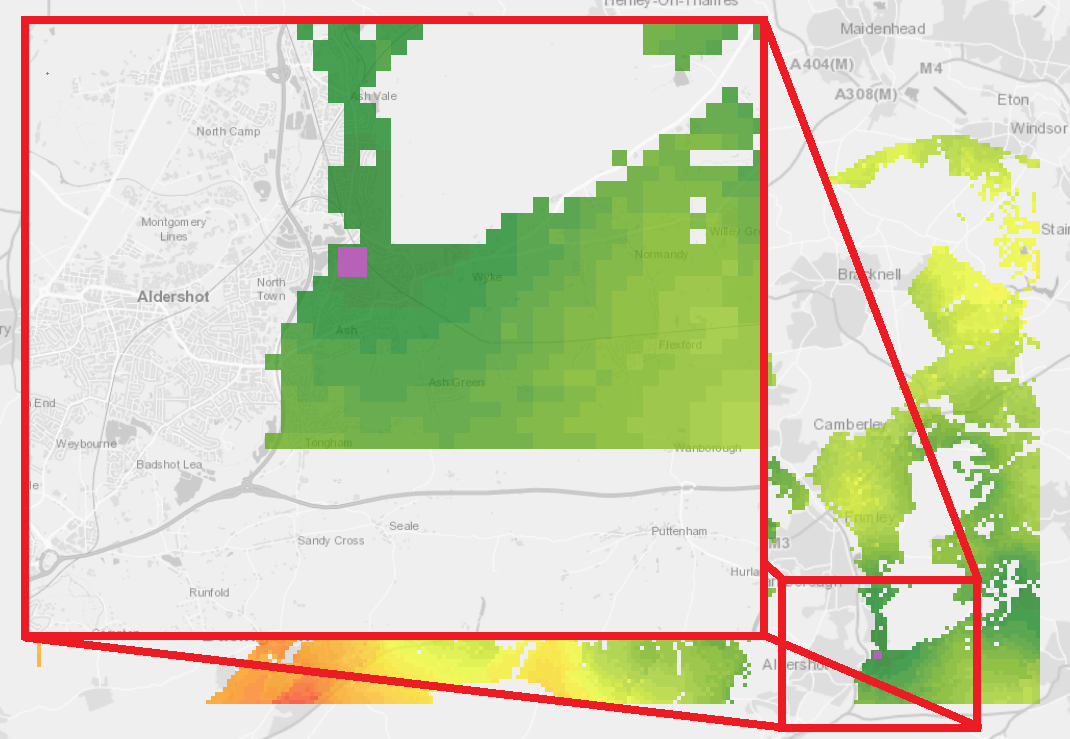
So there we have it, if you’re looking to build a plot of retirement homes to the west of London any time soon, look no further than the outskirts of Aldershot. In all seriousness, the blog was designed to showcase some of the great new datasets for the UK in the Living Atlas, and explore how they could help answer a real-world question. Next time you’re working in ArcGIS, it may be worth considering if any of the Living Atlas datasets could enhance your analysis and provide further context to your project.
If you have any queries with the datasets or workflow followed here, or have a dataset you’d like to submit to the Living Atlas, you can contact us at datacurator@esriuk.com.
Useful Links:
![]()