ArcGIS Web AppBuilder has had another busy year with plenty of new and updated widgets and themes. I thought this would, therefore, be a great opportunity to give a run-down on some of the key changes in the world of Web AppBuilder.
New Widgets
The Data Aggregation (Beta) widget lets you load a CSV file, either by address or coordinate information, and aggregate information onto a target layer. You can also choose which fields should be uploaded to the existing layer.
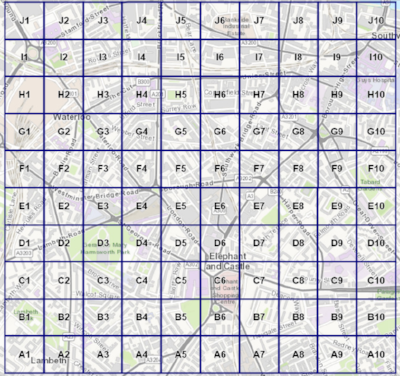
The Gridded Reference Graphics widget allows you to create grids based on an area you are interested in. You can define a grid from an area or a point. It can be extremely useful in surveying a specific area or in a search and rescue operation.
If you are interested in determining potential hazards in the event of a hazardous spill, then you’ll appreciate the Emergency Response Guide widget. It references the 2016 Emergency Response Guidebook and includes options for spill size, time of spill and wind direction.
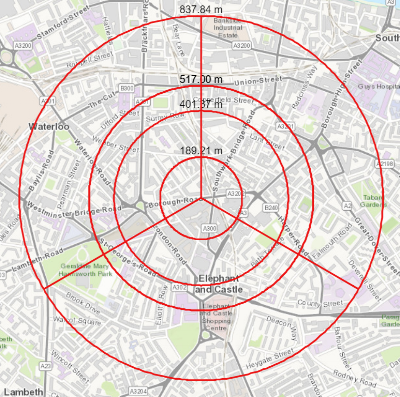
The Distance and Direction widget lets you draw lines, circles, ellipses and rings. Here I’ve drawn some rings, with radials, around a location of interest.
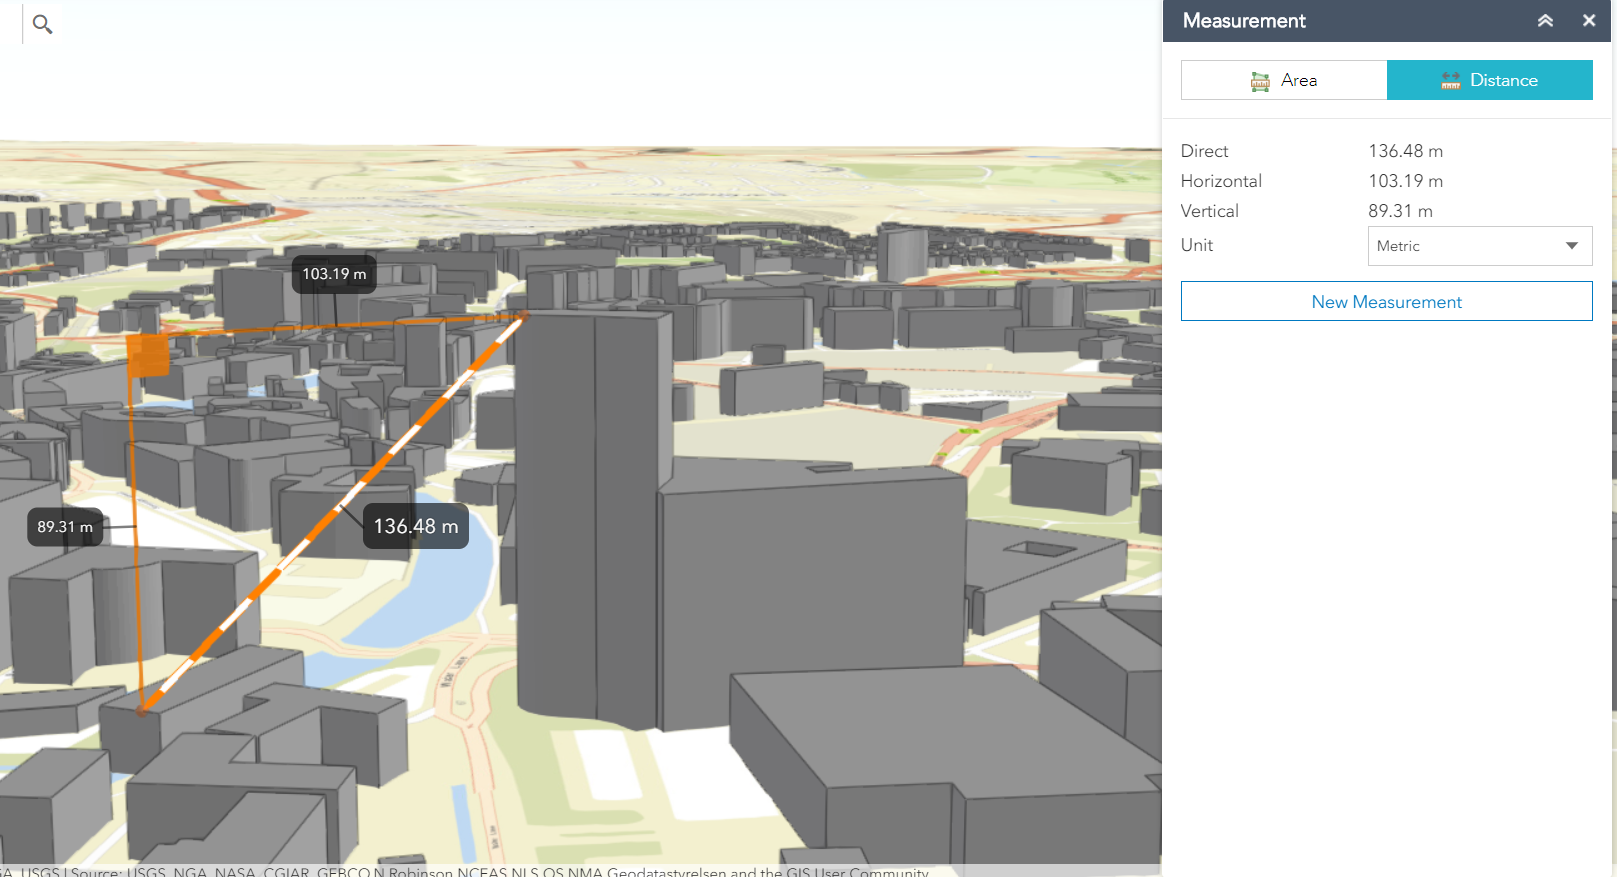
Moving on to 3D widgets, there have been two new ones in Web AppBuilder – Share and Measurement. The Share widget means you can now share your app on social media, link to it in an email or embed it on your website. The Measurement widget allows you to get the direct, horizontal and vertical distance between two points in your scene. It can also measure the area and perimeter of a polygon.
Widget Updates
The Smart Editor widget is a great tool for editing and creating features and their related records. Recent updates now mean you can move a point either to coordinates you’ve entered or a GPS location. You can also edit related records when the parent record is not editable. This is great when, let’s say, you want a maintenance team to inspect park benches but you don’t want them to alter the park benches themselves.
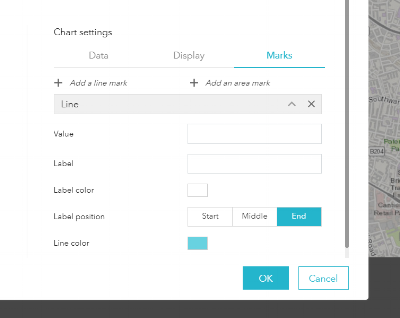
A few changes have also been made to the Infographic widget. You can now select the colours used in a pie chart and add line or area markers to your charts. By including the capability to add titles to the x and y axis you can give more detail on what information you are displaying.
The Filter widget lets you set the visibility of features in a layer. There is now the option to select multiple values for a field in one expression and you can also uncheck all your selections in one go if you’re using a multiple value list.
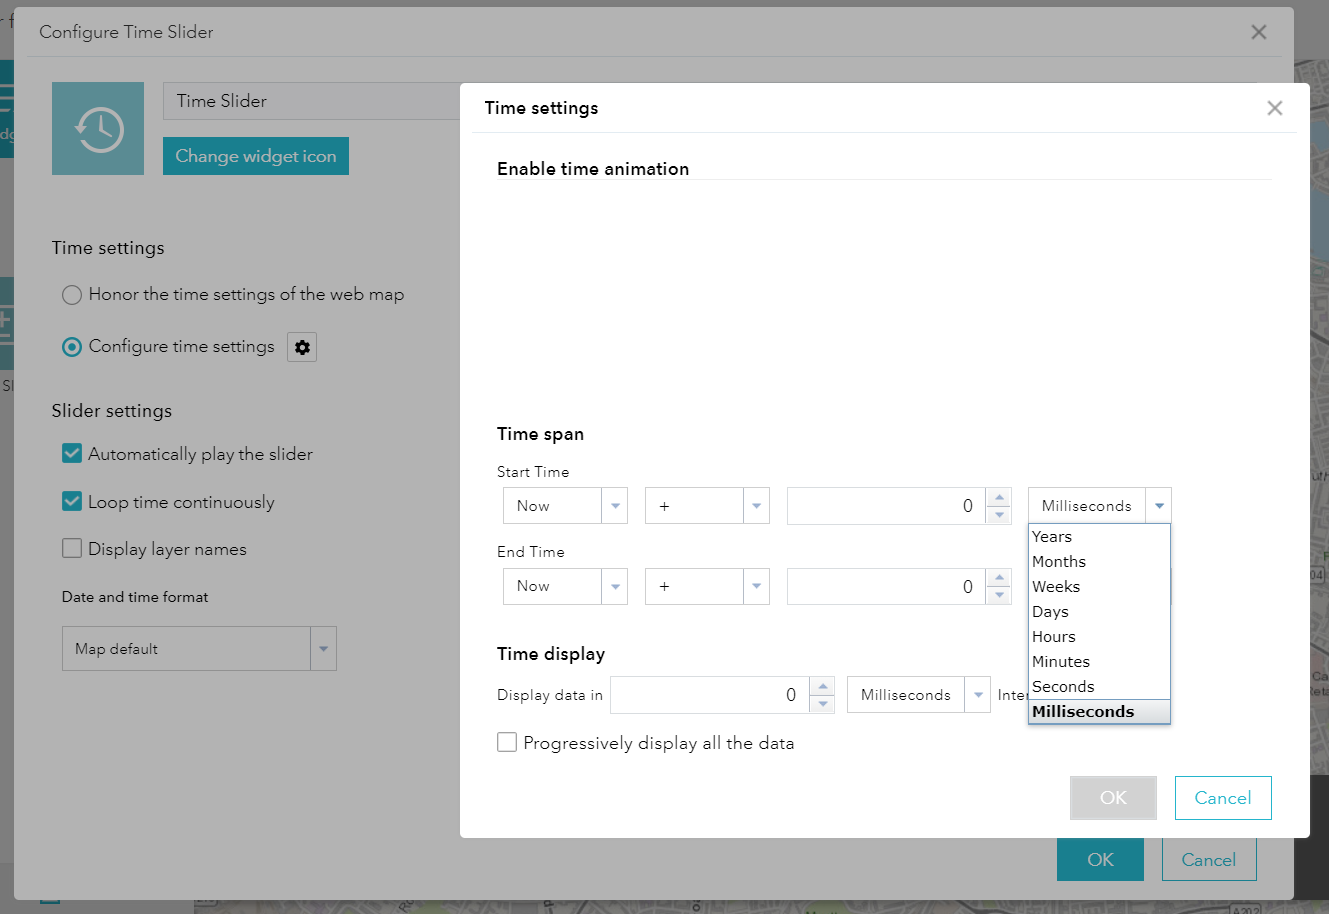
One widget with lots of enhancements is the Time Slider widget. You can configure the time span and intervals (minutes, hours, days etc.). The slider can be automatically played when the widget gets opened, you can configure the time span and intervals (minutes, hours, days etc.) and set the slider to continuously loop time or stop after one play.
New and Updated Themes
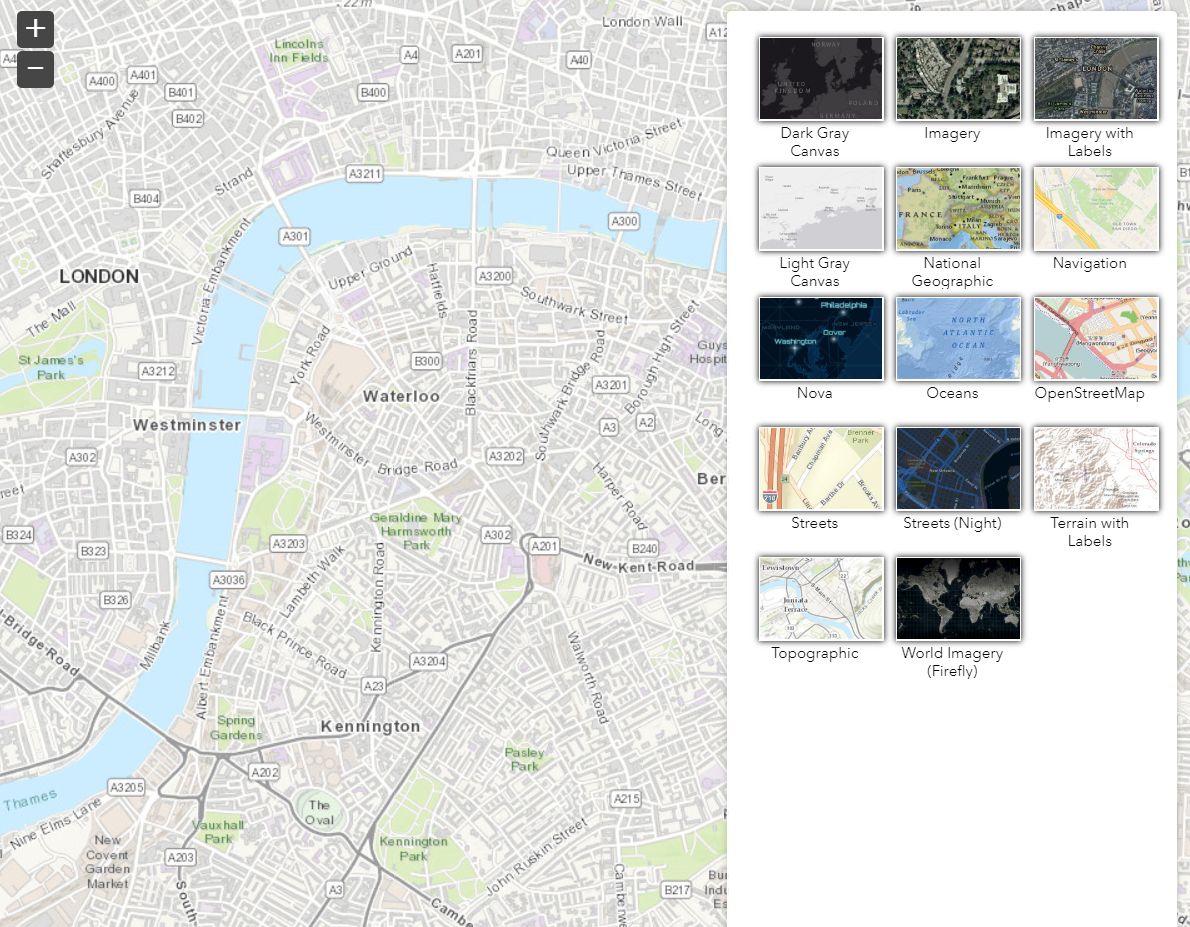
In September, the new Pocket theme was introduced. This new theme allows you to create apps that are very focussed on a specific workflow and only supports one widget in a side panel. It’s also great if you’re designing an app to embed in a website or story map. Here all I’ve chosen is the basemap widget.
In other news, the Dashboard theme is now available to use in your 3D web apps.
UI Improvements
Whilst new functionality is always exciting, it’s also important to focus on the user interface and experience. You may have noticed the New App button in the top right corner of Web AppBuilder to allow you to quickly and easily create new 2D or 3D apps. Widgets can also be reordered now, and you can change the group icon when widgets are grouped together.
As you can see, there’s lots going on with Web AppBuilder and you can see the full list of widgets here. I hope this has given you all enough to play with until the next update in December.
![]()