AI, machine learning, and deep learning are becoming more common within geospatial analysis, but they are often misunderstood by non-developers. So what do they mean and how can you take advantage of them in the ArcGIS platform?
AI (artificial intelligence) is the science of developing computers and programmes to respond to problems with increased complexity like a human. Machine learning is a specific method of AI which requires training data to allow the algorithm to find rules and patterns. There is also deep learning, which is a method of machine learning that uses the approach of deep neural networks (the black box approach) to infer results.
Machine learning algorithms are really useful when performing multivariate analyses, or where the data sets involved are classed as “Big Data”. This is because these processes are based upon complex statistical techniques which can weight multiple data inputs, as well as efficiently organise large data sizes. Both ArcGIS Online and Pro have many tools that take advantage of machine learning technology which can be broken into three categories: classification, clustering, and prediction.
Classification
The classification tools in the ArcGIS Pro Spatial Analysis Toolbox are typically used in identifying land cover/use from satellite imagery. The image right shows a Support Vector Machine land cover classification for the area around Northampton. This example classification focuses on the fields surrounding the town and identifying which fields have been harvested. This can help produce estimates of economic value and volume of produce in this area.
Clustering
Clustering tools (available through the Spatial Statistics Toolbox in Pro and Analyze Patterns in Online) analyse the distribution of your data and whether there are statistically significant clusters. Hot Spot Analysis specifically calculates high and low value clusters across your map. Visualising the high’s and low’s is useful if you want to see which areas are performing above and below the average of your data. This example looks at traffic incidents around Luton, and shows the northwest has a cluster of more severe incidents, while the southeast is showing areas of less severe incidents. By knowing where the hot spots of incidents are, road planners know where to target hazard reduction schemes.
Prediction
Finally, the prediction tools determine new data values based upon other data from different geographies or time periods. They can be found in both Pro (search in the Spatial Statistics Toolbox) and Online (Analyze Patterns). These tools are useful if you have point data but need records covering the entire extent of your map. The example uses point data of violent and sexual crimes across London as reference points. The EBK Regression Prediction tool was used to map the risk of this crime across the entirety of the city. This tool also allows other raster’s to be used which affect the distribution of violent crime across London.
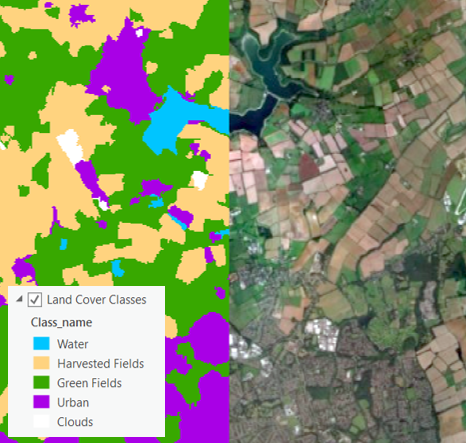
Support vector machine classification of fields around Northampton.
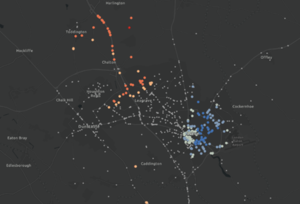
Hot Spot Analysis of road traffic accidents in and around Luton.
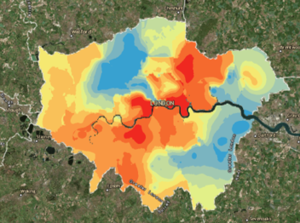
EBK Regression Prediction result with Violent crime data.
Custom algorithms
If those tools aren’t enough, you can use the Python API, Arcpy, and R-Bridge to integrate custom algorithms from Scikit-learn, Tensor Flow, and CNTK with the rest of our platform. This is really useful if you want to take advantage of the capabilities of deep learning algorithms.
Rubbish data, rubbish results
Remember, machine learning is not magic and any results produced are only as accurate as the training data used. So, before you use any tools, make sure your training data sets are as complete, equally spread, and representative as possible. This will ensure the tool being used will produce solutions most accurate to your question.
Hopefully this post has filled in some knowledge gaps and given you the confidence to test these tools for yourself, but if you want to know more, have a read of the story map here.
Happy mapping!