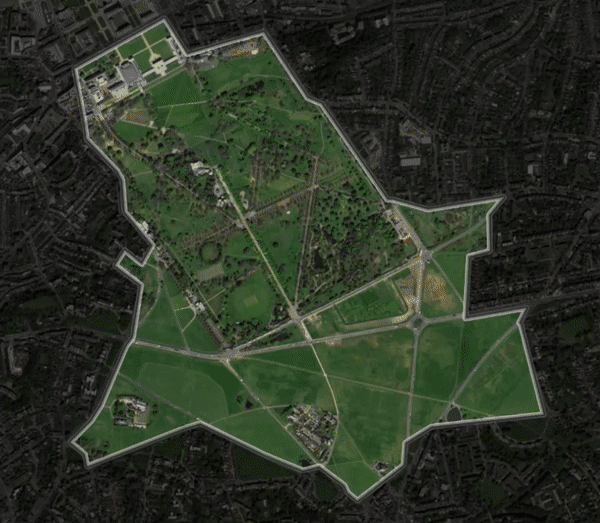
Imagery is powerful. It can help us turn data into information, information into decisions and decisions into action. It allows us to detect change, unmask the invisible and to forecast the future. It also provides us with beautiful and recognisable basemaps, onto which we can display or digitise our data and understand our world.
With the above in mind we decided to produce an Esri UK story map to help anybody learn all about imagery - click the link to check it out…
If you’re new to imagery, or indeed ArcGIS, then this story map is a great place to learn about the foundation blocks of the subject. It aims to build up knowledge slowly, starting by exploring the most fundamental of questions – what is an image in a GIS? From these foundations new topics are gradually introduced, including multispectral imagery and rendering.
Using multi-spectral remotely sensed imagery in the red and near-infrared (NIR) wavebands it is possible to effectively visualise and measure the health of vegetation under high-stress conditions. Find out more in the story map.
The Story Map also explores the various imagery services available across the ArcGIS product range. Each service is explained using a series of use cases, right through from World Imagery to Sentinel-2. It’s the perfect place to start understanding how your projects or organisation could benefit from using imagery.
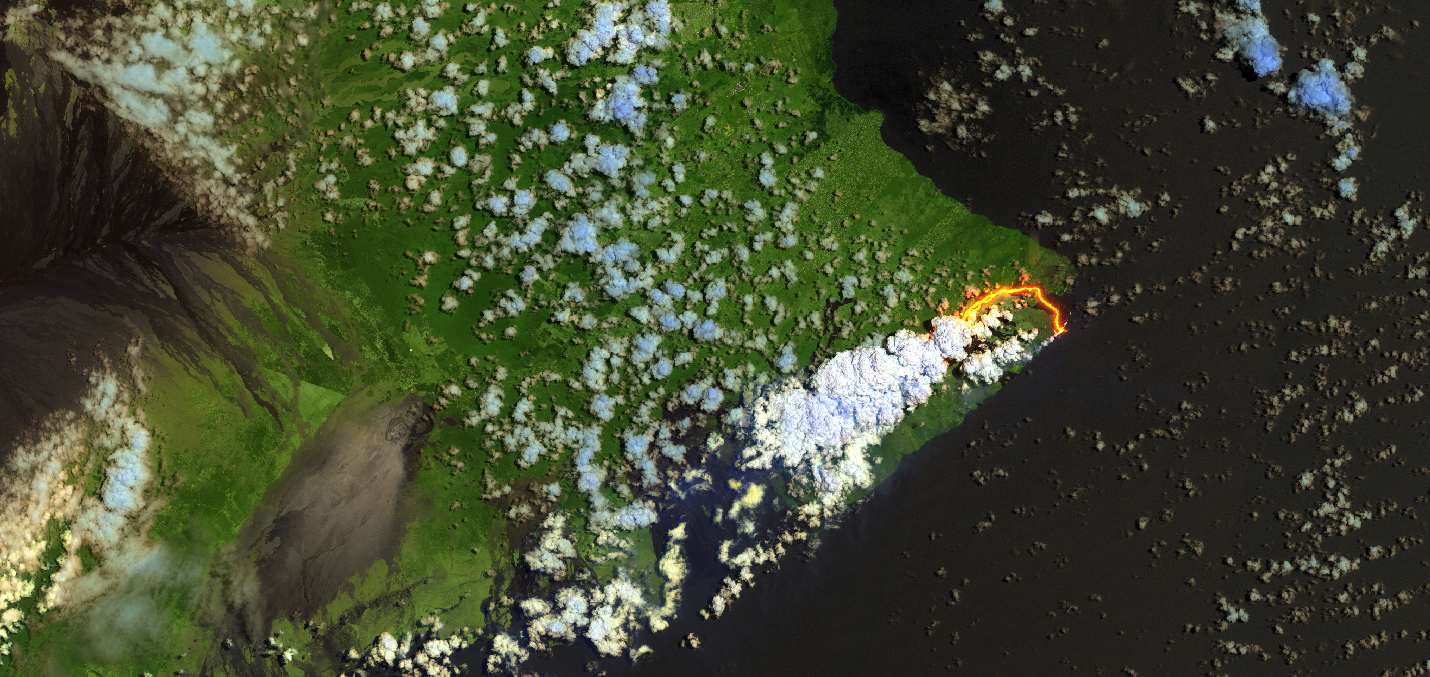
Shortwave infrared rendering can provide a much clearer visualisation and understanding of catastrophic events. Lava hotter than 900 Celsius glows red in visible wavebands, however at cooler temperatures can become indistinguishable from rock. This shortwave infrared wavebands captures by sentinel-2 can distinguish lava from rock at cooler temperatures.
Finally, for any imagery experts out there, there’s an exploration of how imagery can be extended into desktop and enterprise configurations to make the most out of emerging technologies such as deep learning.
Enjoy!