After delivering a popular presentation at the Esri UK Annual Conference this week, I thought I’d share my workflow. The presentation focused on Business Analyst Online; using Open Data and Living Atlas data for suitability analysis. My scenario was based on finding the best office location for a new Tech Start-up company.
Step 1: Adding in your own data
I started off with some potential office locations in a .csv file. It contained attribute information of longitudes and latitudes, size (in sq. ft.), and cost of lease – for each office location.
In Business Analyst Online, I imported these potential office locations by navigating to Add Data > Import File.
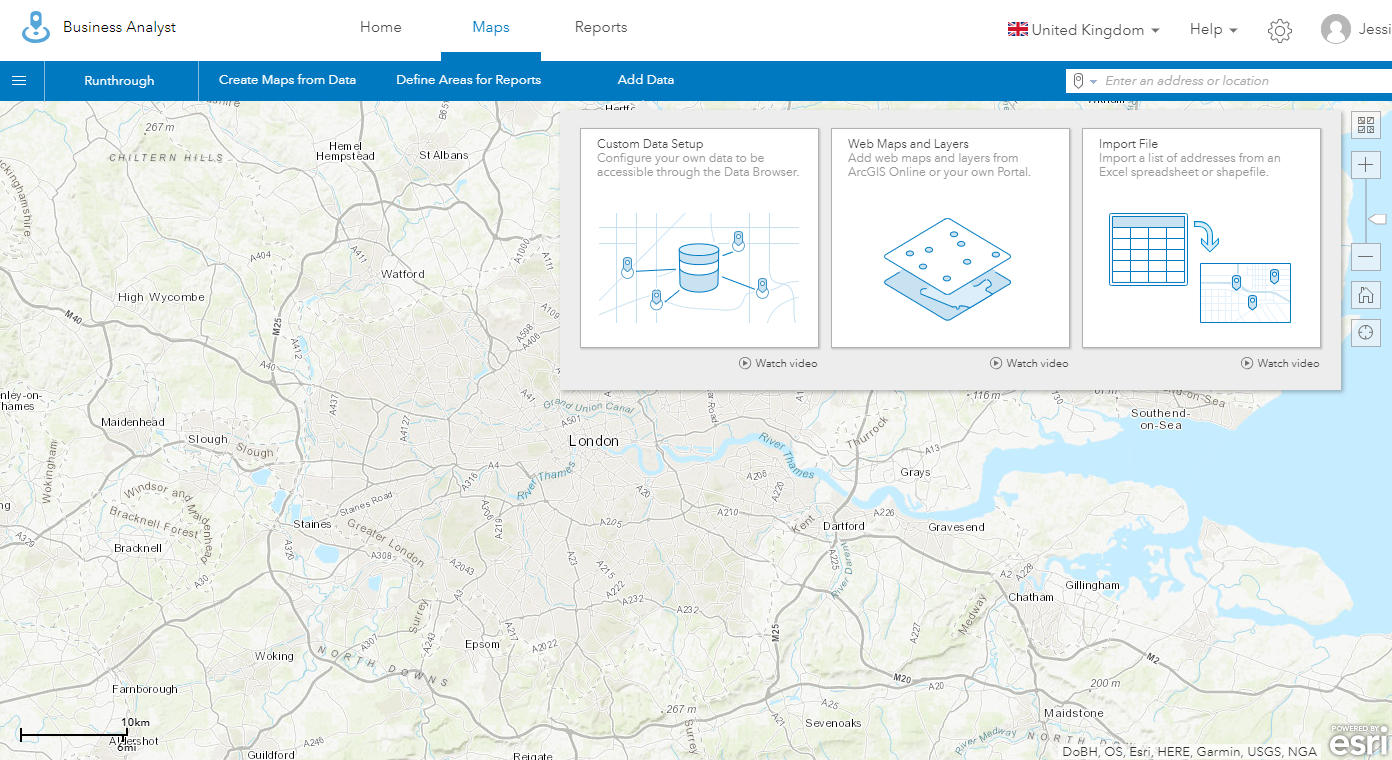
Once you have imported your own data, you can start the suitability analysis by navigating to Create Maps from Data > Suitability Analysis and choosing your own data as the Sites.
Step 2: Adding in Open Data
There are so many interesting Open Data sets out there and our ArcGIS Platform helps you make use of them. To include distance to transport access in my site suitability analysis, I accessed an Open Data set from Transport for London (TfL) for all of the London Underground tube station locations.
To include distance to greenspaces, for the well-being of my employees, I accessed OS Open Greenspace from Ordnance Survey. This has all the greenspace across London – from public parks, to allotments, to sport facilities.
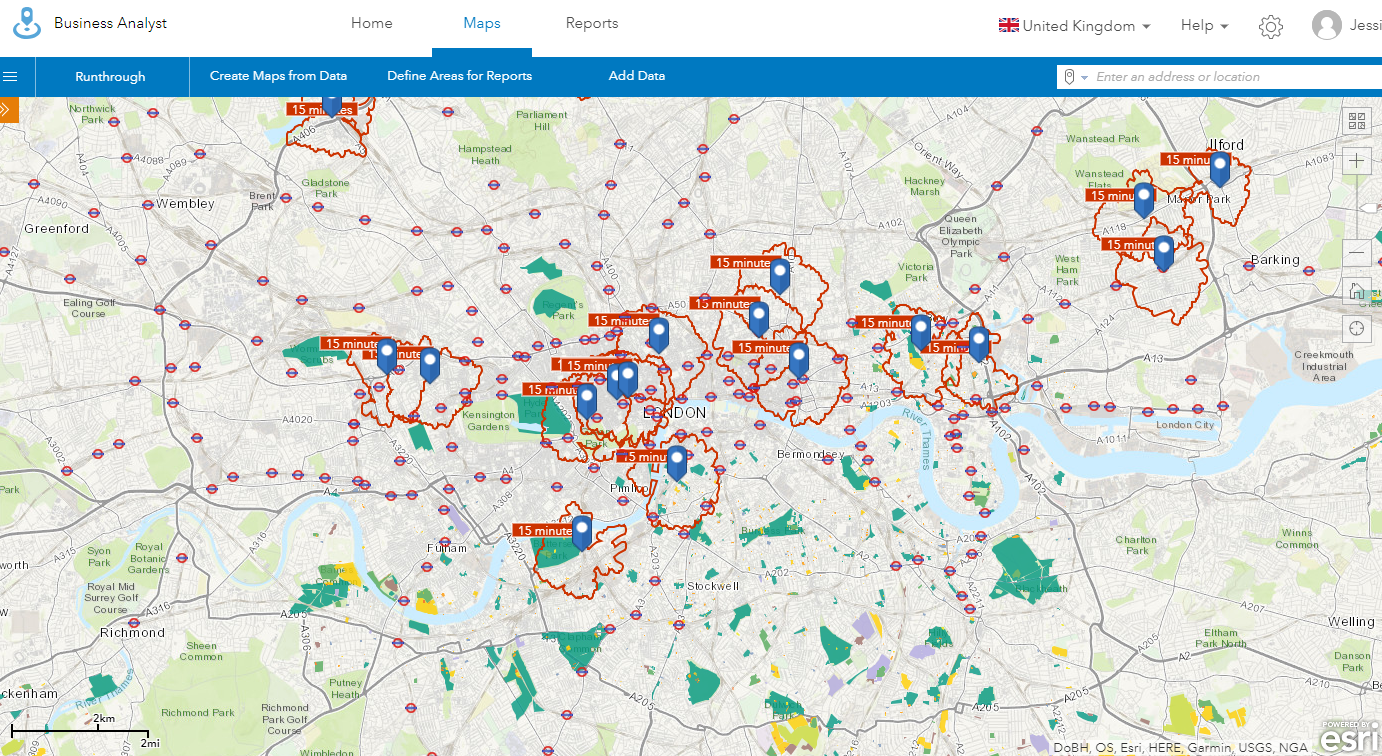 office locations (blue pins) with tube stations from TfL and OS greenspace data
Step 3: Adding in Living Atlas data
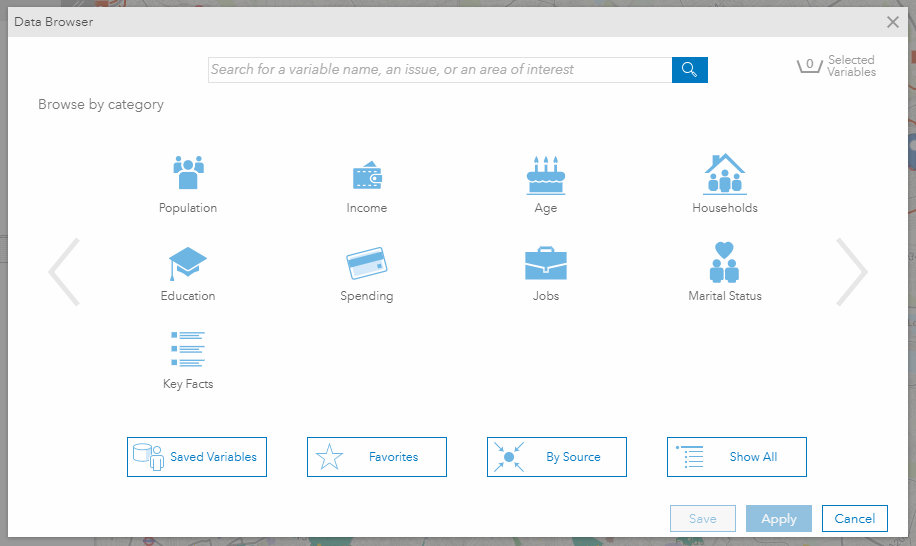
I want to target young people and those who have achieved an educational qualification level 4 and above. To pinpoint my target demographic, I used Living Atlas data within Business Analyst Online. The data viewer makes this easy, as you select the category you want data for.
The data sat behind the data viewer is sourced from Michael Bauer Research, a global demographics provider. This data was updated to 2017 last month.
Step 4: Suitability Analysis for the office location
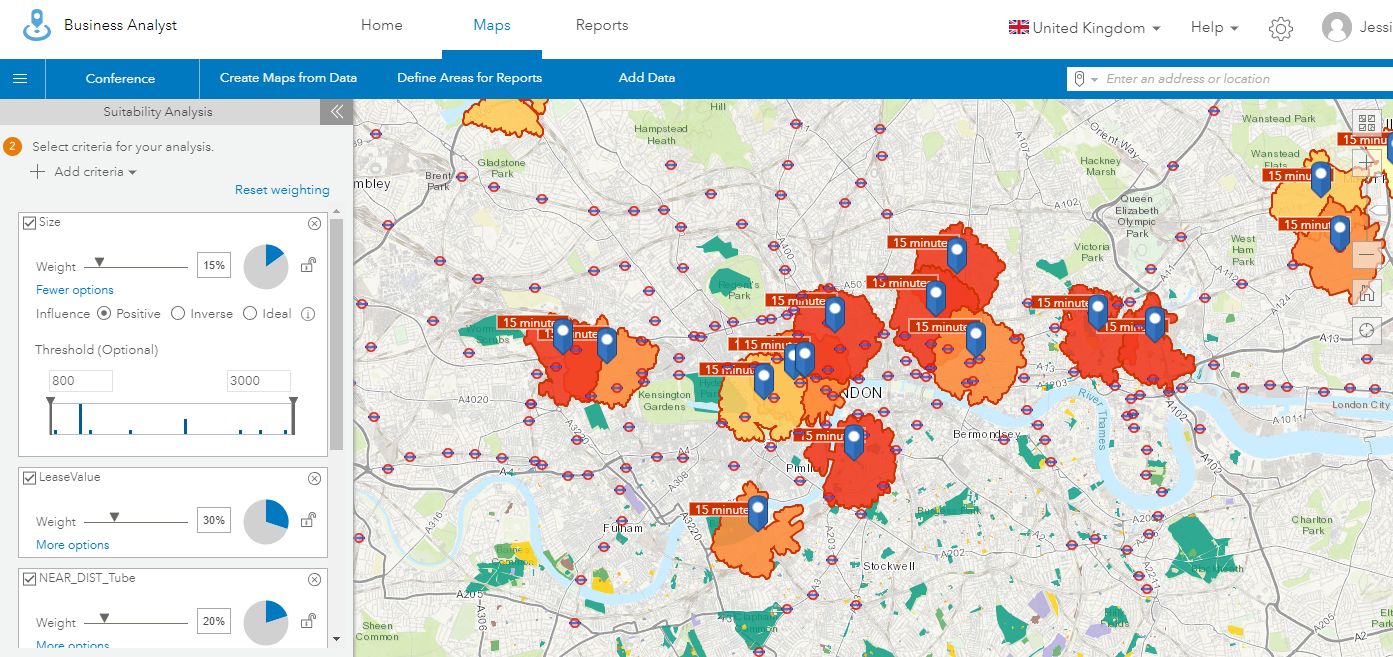
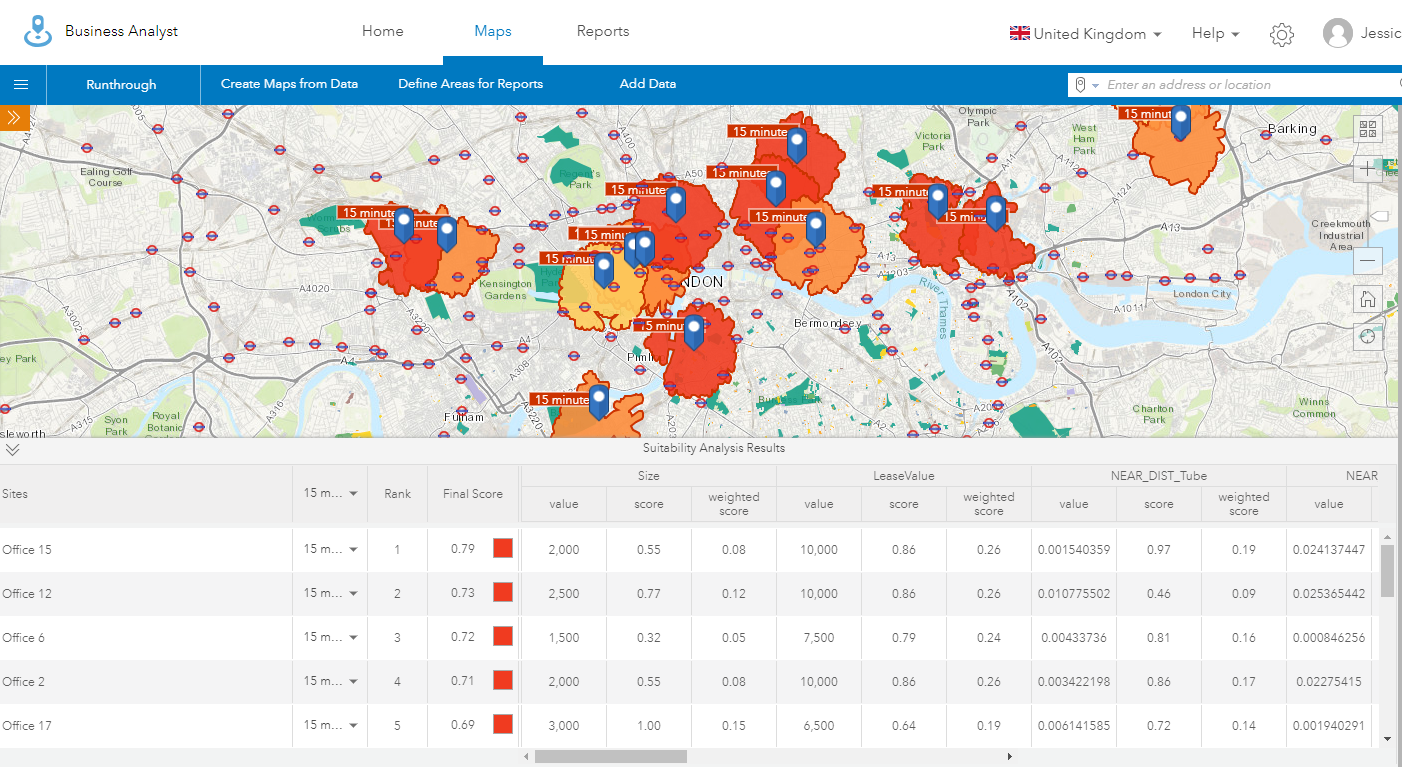
Once you have chosen what criteria is important to you, Business Analyst Online gives you the option to rank importance. To do so, you simply move the weight slider to either increase or decrease importance.
For me, being close to tube stations and greenspace was the most important – so I inversed the values. Inversing means that a smaller number in my distance calculation will score more highly, e.g. the closest tube station will score the highest points.
You also have the option to choose a threshold. This is helpful for my lease cost criteria, as I have a limited budget. I can set the threshold to what I can afford and it will remove any office locations from the suitability analysis that falls outside my threshold.
Additionally, Business Analyst Online generates a Suitability Analysis Results table so you can have a more in-depth understanding of how your office locations are being calculated and ranked.
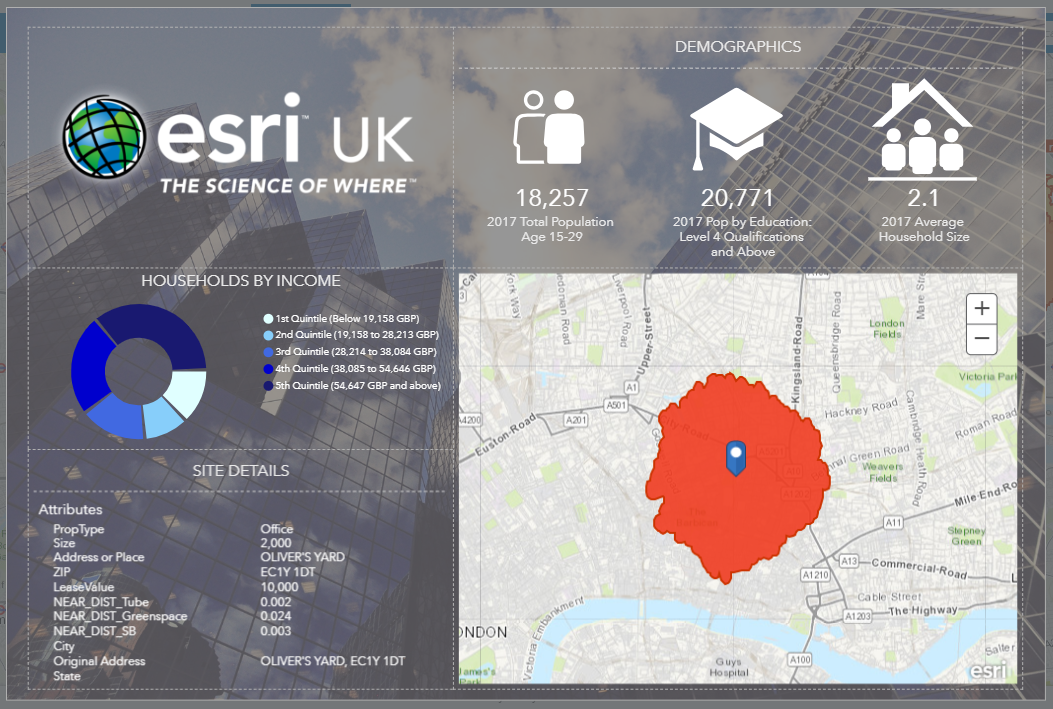
Step 5: Creating an infographic
Infographics are a great way to visualise key indicators and information of a chosen site. You can create an infographic using the ready-to-use templates in Business Analyst Online, or create a custom infographic like I have. I incorporated many elements, such as a company logo, key demographic icons, detailed table, and an interactive chart and map.
Learn how to build your own infographics here.
You have many options to share infographics. You can share within ArcGIS Online through a group, or share outside of ArcGIS Online by generating an image, a PDF or dynamic HTML.
If you want to learn more about how to use Business Analyst Online, check out this blog. Or, if you are interested in a more in-depth step-by-step explanation of how the suitability analysis works in Business Analyst Online, check out this guide.
![]()