We all love how easy it is to create a story map. The eight ready built templates keep the process simple and clean, and hundreds of beautiful stories are being told every day using them. But how do you get the most out of these templates and make your story map stand out from the crowd? I’ve put together some top tricks for story map configuration and customisation. Hopefully even experienced story map creators will discover something new and exciting.
1. Add Your Organisation Logo and Links
Difficulty rating: 1 (out of 5)
By default, all story maps include an Esri logo which links out to the Esri homepage. A text tagline “A Story Map” is also included – itself containing a link to the Story Maps website. Replacing the logo, tagline and links is a great way to start making your story map stand out. Each template has a slightly different interface, but the general process is similar. Here’s how to do it in the Map Series template…
Navigate to settings at the top of the page, bringing up the settings panel. Here you’ll find the options for changing the logo, adding a link when the logo is clicked, adding text with a link, and more.

Pro tip: Using a transparent background blends your logo into your chosen story map colour scheme, avoiding harsh edges and helping to create a professional look. Also, remember to keep things relevant when using links and taglines.
2. Make Use of Unsplash Images
Difficulty rating: 1
If you haven’t got your own personal library of super high-resolution snaps to hand, then this next tip is going to excite you.
Nearly half a million free high-quality photographs are just one click away from your Cascade story map, courtesy of Unsplash – a curated repository of copyright-free photos. To add these images to your Cascade story click the add media button as normal, navigate to the Unsplash tab and search for the perfect photo:
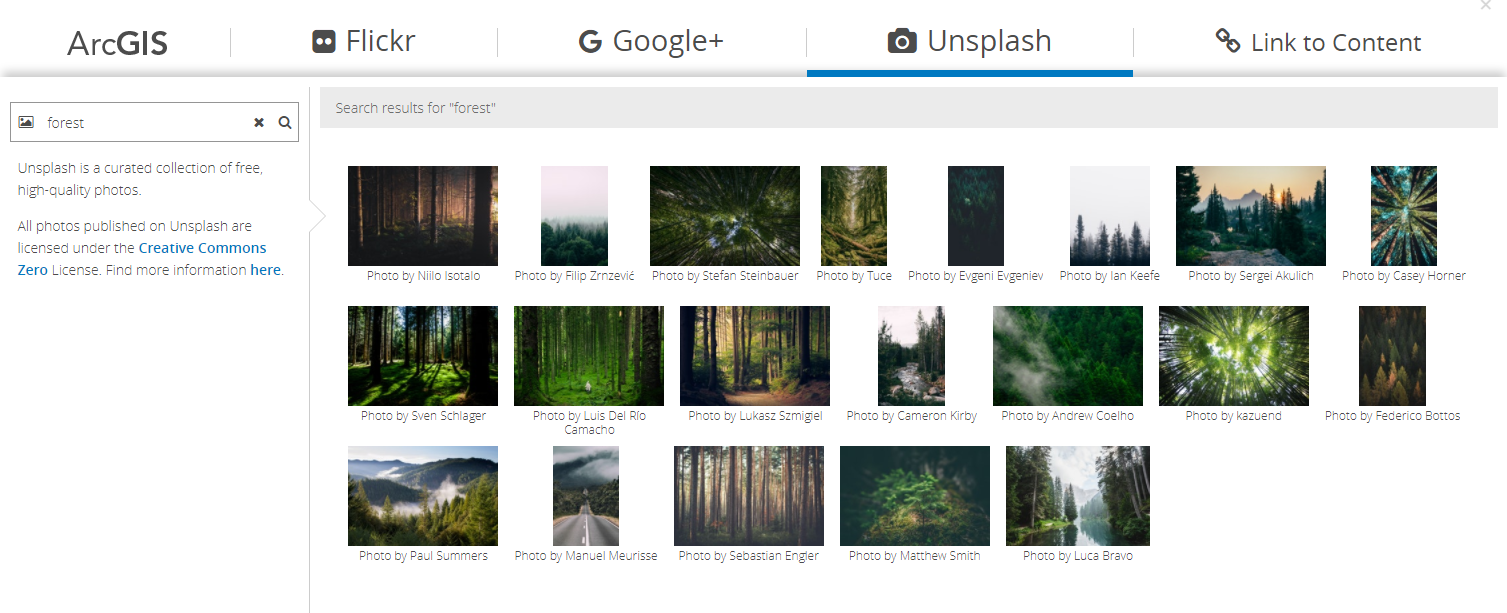
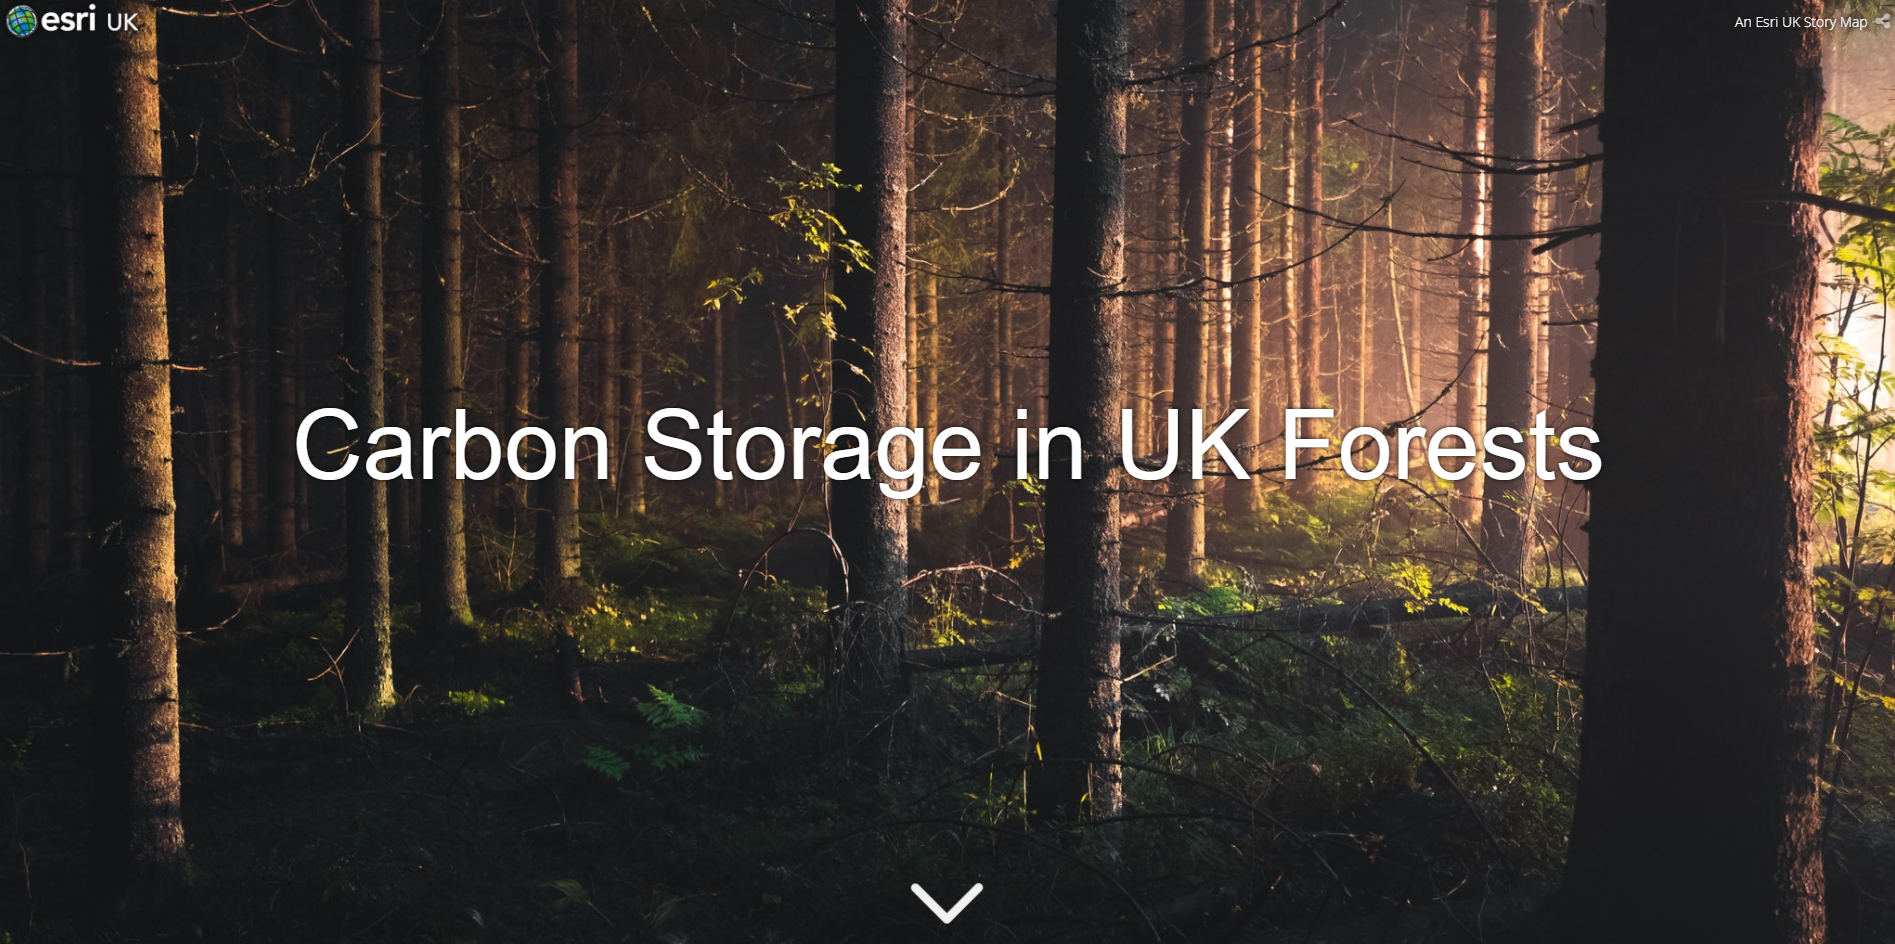
Pro tip: White text can look particularly striking when presented against darker images.
3. Embed YouTube Videos and Enable Player Parameters
Difficulty rating: 2
YouTube videos are easy and straightforward to add to your Story Maps. But if you want more control over the various YouTube player options – such as autoplay, looping, starting at a specific time – you can use player parameters. There are two main ways to get them working in your story map:
i) Use the in-built YouTube player embed options
Head to YouTube and find your video. Underneath the video navigate to the Share button and select the Embed option.
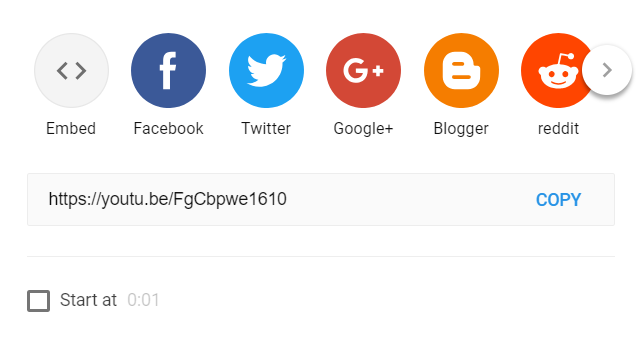
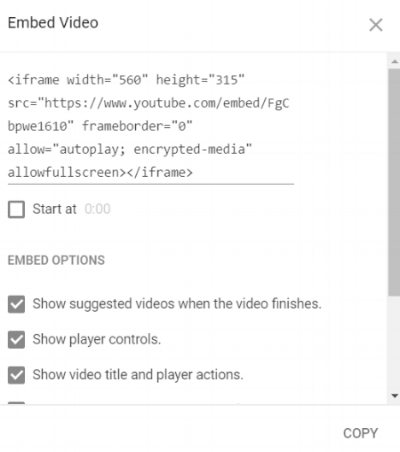
Tick the embed options that suit your needs and copy the iframe into the chosen location within your story map.
ii) Build up custom parameters in your own embed code
There are many more parameters available than those displayed within the YouTube player, a full list of which can be found here. You can use these parameters in your story maps by modifying the code template below:
<iframe src=”https://www.youtube.com/embed/video_ID_here?parameter_1_here¶meter_2_here”></iframe>
The parameters I’ve found to be most useful are explained in this Story Map, along with code examples:
Pro tip: YouTube videos autoplay by default when used as media behind a title in Cascade. This can add some instant wow to your Story Map.
4. Set a Shared Theme for Consistent Branding
Difficulty rating: 2
Story Maps, Web App Builder, Operations Dashboard, Survey123 – the list goes on. At Esri, we provide many out-of-the-box applications, making it easier for you to understand your world.
One of the challenges organisations face is the ability to easily apply a consistent thematic flavour to these application, and we often hear from users who want to re-style their apps to align with their organisations brand. Shared themes address that challenge and make it easy for you to keep your Story Maps consistent.
The shared theme allows an organisation’s administrator to define the colour for different elements of an application (including Story Maps) once and then these settings will become the default options for newly created application items. The shared theme includes more properties than some of the apps support, but each one will apply the relevant properties to give a consistent look and feel for apps created in the organisation. Here’s how to do it…
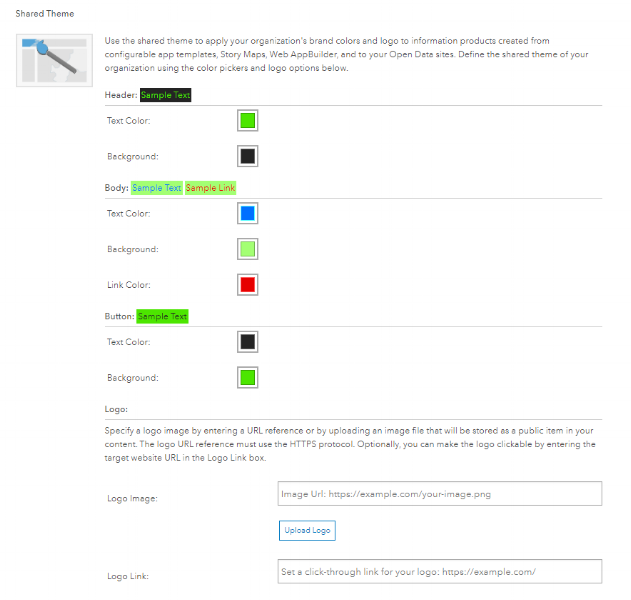
As an administrator within ArcGIS Online head to the Organization tab and click Edit Settings. On the General tab scroll down until you see the Shared Theme section. Here you can edit the following:
- Header background colour
- Header text colour
- Body background colour
- Body text colour
- Body link colour
- Button background colour
- Button text colour
- Logo image
- Logo URL
Once this has been saved the theme will be the default for all supported Story Map templates. You can of course choose another theme within individual applications.
Pro tip: Use hex colour codes to perfectly match your shared themes to your organisations brand image.
5. Embed Tweets
Difficult rating: 2
I’m sure a lot of you have either a personal or company twitter account with a few choice tweets that would fit perfectly in your latest Story Map Journal. So let’s take a look at how to embed tweets, the process is pretty simple…
- Copy an iframe code snippet courtesy of Twitframe
- Paste the Twitframe snippet into your Map Journal’s HTML via the source view
- Replace the tweet URL with the link for your desired tweet
- Adjust the height parameters
- Hit save
Twitter’s standard embed links include script tags, but the Map Journal automatically removes these tags for security reasons. Twitframe overcomes this issue by wrapping each tweet in an iframe – a common, Javascript-free format for embedded content. But you don’t really need to worry about this. Just copy the below code, navigate to the section of your Journal in which you want to embed the tweet, click Edit Section and hit the Source button < > in the top right corner.
<iframe border=0 frameborder=0 height=250 width=100%
 src="https://twitframe.com/show?url=tweet_url_here"></iframe>
The source button allows your to write you own HTML and we will explore this more during the next tip. For now, all you need to do is replace the tweet_url_here with the url of your chosen tweet. The code below shows this in action for a recent tweet from the Esri UK twitter account:
<iframe border=0 frameborder=0 height=520 width=100%
 src="https://twitframe.com/show?url=https://twitter.com/esriuk/status/1009858510786400258"></iframe>
Pro tip: You may have noticed that for the tweet above I’ve changed the iframe height attribute to accommodate for the image within the tweet. For your chosen tweet you can also change the height accordingly.
6. Custom HTML and CSS
Difficulty rating: 3
The Story Map Journal template allows you to view and edit the HTML source for the narrative side panel, as well as adding custom CSS between style tags. This gives you the ability to change how content in the side panel looks and feels. This flexibility is really awesome. In fact, I liked this so much it got a blog post AND Story Map of its own. If you’re a HTML and CSS expert, check out the blog. If you’re new to the world of HTML and CSS, but would like to learn more about it, then the Story Map is a must read:
Pro tip: CSS rules created with the <style> tag are global, so it’s not necessary to duplicate them in every section. However, you can limit styles to specific sections, for example .section:nth-child(2) .p1 { } targets only the second section of the story.
7. Make Sure Your Maps Look Good
Difficulty rating: 3
The most common media you’ll be showing off in your Story Maps, unsurprisingly, are maps. While the narrative is an essential aspect of a Story Map, the map itself should always be easy to understand and explore without the narrative context. Following some basic cartographic principles can go a long way towards achieving this.
Esri, again perhaps unsurprisingly, have a few expert cartographers knocking about, and their musings are an excellent place to start learning about the art of making a good map. Check them out below:
- Ben Flanagan’s exercise in aggregating data and his look at multivariate dot density mapping
- John Nelson’s Adventures in Mapping
- Ken Field’s Cartography book
Pro tip: Follow the Ordnance Survey’s 8 key cartographic design principles and you can’t go wrong…
8. Download the Application Code and Host it on Your Own Server
Difficulty rating: 4
if you are looking to gain the maximum level of control over how your Story Map looks and behave you might want to host your own custom Story Map. This blog is well worth a read but if you don’t have time now, here’s a summary…
Esri Story Maps are open source so you can download the code for any Story Map app from GitHub, host it on your own server and customise it. While the needs of most Story Map authors will be served by the versions hosted on ArcGIS Online (or an ArcGIS Enterprise portal), there are a few reasons to consider hosting your own:
- Give your story a custom URL on your organization’s domain
- Set up web analytics to capture statistics about who’s reading your story
- Enhance how your story looks when it’s shared on social media
- Style a Story Map app to change its appearance beyond what is possible in the builder or in the Journal source view
- Customize an app to add new features
Pro tip: To make style changes that alter the colours, layout, or appearance of the app you’ll only need to modify the app’s CSS. You can do this by using <style> tags in index.html of the compiled code download. See Scenario 2 in the blog.
So there you have it, 8 tips for a glorious looking Story Map! If you’re Story Map is public facing remember to share it on social media, and who knows – maybe your story could be featured as the Esri Story Map of the Month…
![]()