The ArcGIS Maps for Adobe Creative Cloud is an app that allows people to easily bring thousands of data-driven maps into Adobe Illustrator and Photoshop. From these you can create beautiful, data-driven maps in hours, not days. This app has been available for a while, but I think it is time to highlight some amazing things you can do!
What can you do?
Creating beautiful maps with the range of tools available in Adobe Illustrator or Photoshop easier with direct access to GIS data. You can bring in content from ArcGIS Online or use data you have stored locally.
This blog is going to highlight how you can bring your data into the Adobe Illustrator environment along with a few different capabilities of the app including changing the symbology and applying branding techniques.
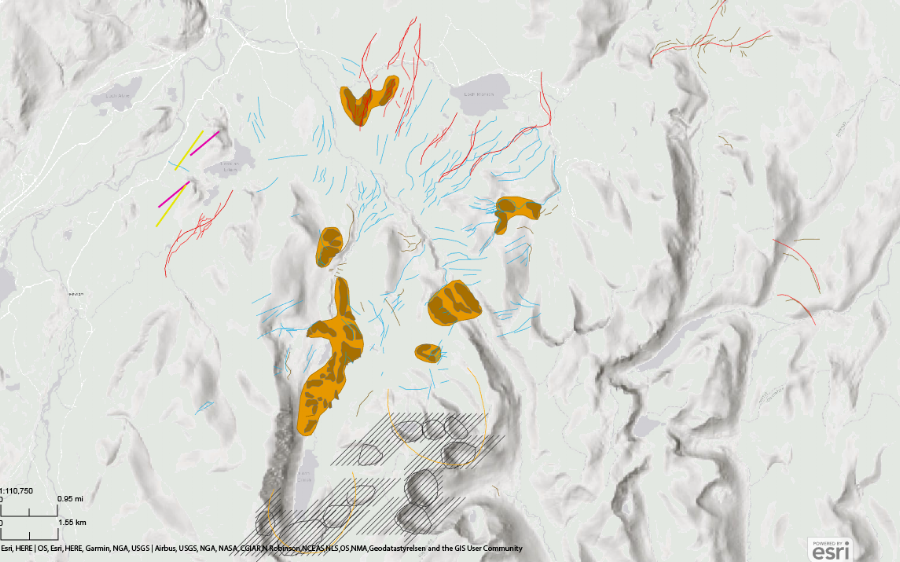
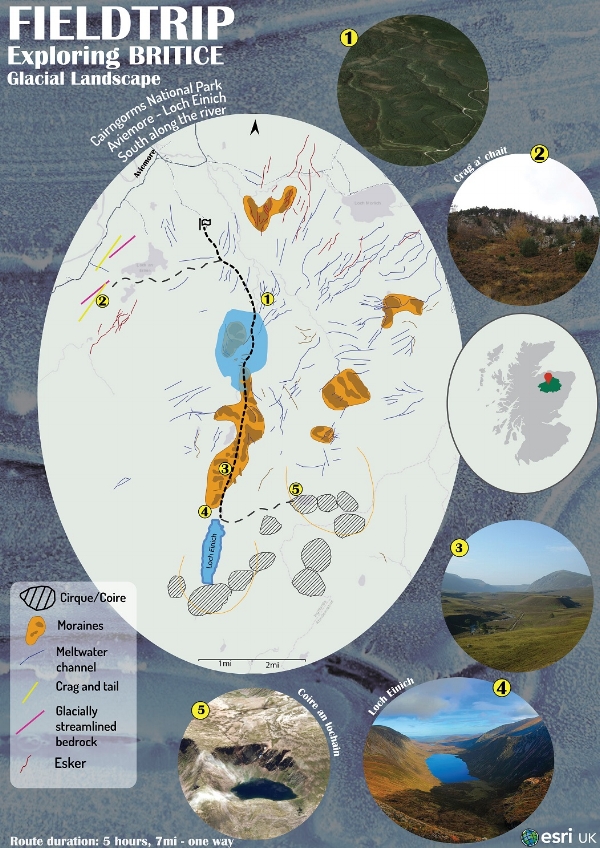
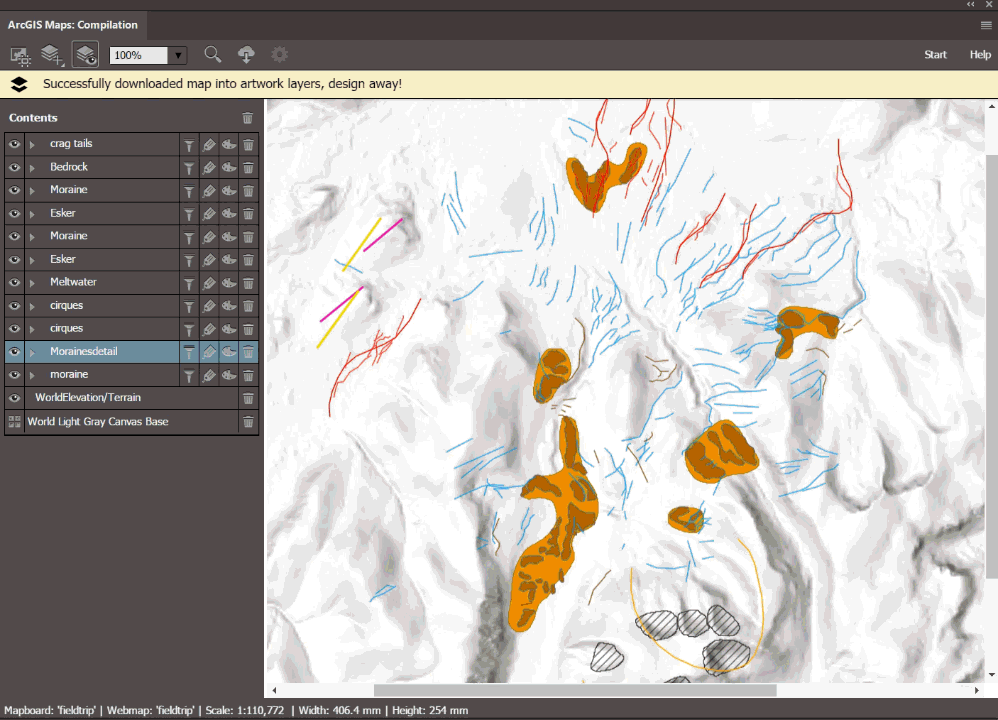
The map for this blog is powered by glacial data from the BRITICE project, run by the University of Sheffield. BRITICE is a rich dataset that shows all the glacial landforms in the UK left behind by the British-Irish ice sheet in the last ice age and was compiled from a review of over 1800 publications. Great news, it was added to the Living Atlas this month, so you can begin to use this rich dataset now. The figure below shows the data around Loch Einich, Scotland.
I wanted to make a presentation map out of this data for a fieldtrip, highlighting some glacial features that can be spotted along the way. I used the ArcGIS Maps for Creative Cloud and the Adobe Illustrator tools to create this eye catching map.
How do you start?
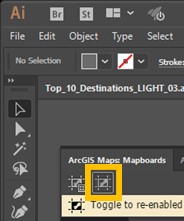
The first thing to do is download the extension via Adobe Exchange. Once downloaded you need to log in with your ArcGIS Online account.
Maps for Creative Cloud has a range of options for map design, I will walk through a couple of capabilities that I used to make this map.
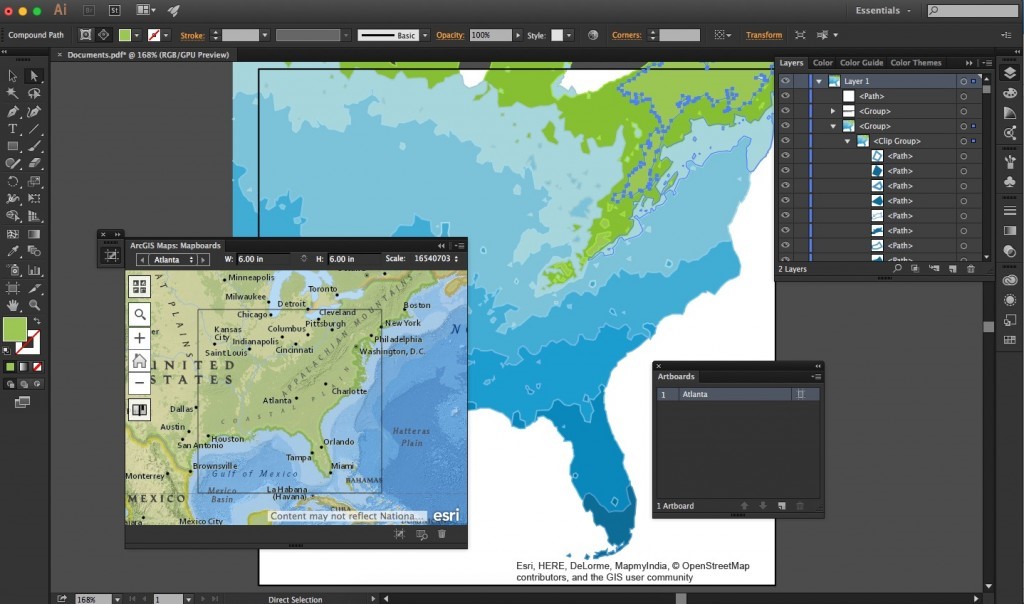
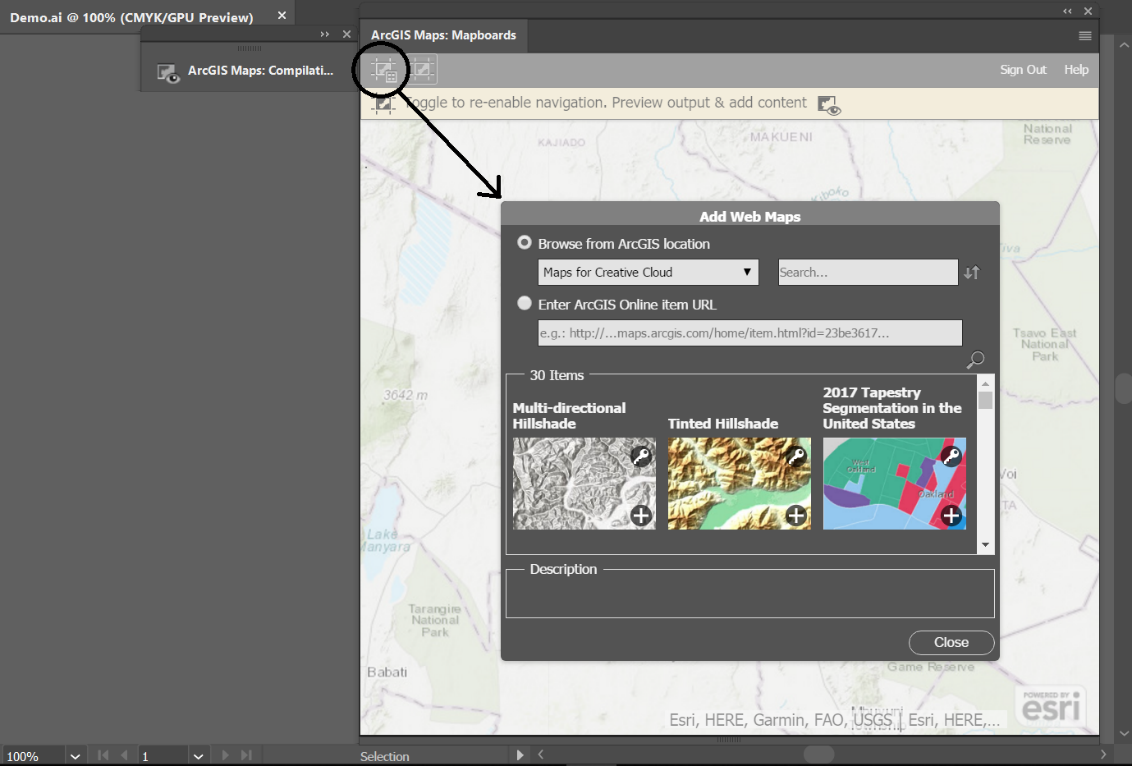
1) Define map area – you can draw a mapboard in the mapboards window, which allows you to focus on the area where you want to create your map.
2) Add your own web maps or layers.
Once your area of interest is defined you can use the compilation window to add data from the Living Atlas or discover maps specifically made for Creative Cloud. To access your own web map, it will need to be added to a group with the tag: M4CC, which stands for Maps for Creative Cloud.
A nice little feature is that you can add Point Layers directly from file. These can be from a csv, excel sheets or manually added through the place finder.
3) Changing symbology in the compilation window.
One amazing thing you can do is change the symbology in Illustrator the same way as you would do in ArcGIS Online.
4) Replacing markers or symbols
You can replace the symbology of point features all at once with Illustrator symbols. You can do this by giving the layer the same name as the symbol. Symbols are made specifically for ArcGIS maps Creative Cloud and these can be found in the symbol library.
5) Projection
For the fieldtrip map I have chosen to keep the data in Web Mercator projection but there is an option to change it.
6) Download and apply your design skills!
The final thing to do is to download the map and M4CC will convert all the layers to vectors. When downloaded you can start using your Illustrator or Photoshop skills to create your own design and brand the map.
I used Creative Cloud with Adobe Illustrator, but the app is also available for Adobe photoshop. With photoshop you can easily bring in cool raster maps and style these.
I hope this has given you a little food for thought on how you can make the most of your data using the ArcGIS Maps for Creative Cloud. Or perhaps there is someone in your organisation that could use GIS data directly in their Creative Cloud projects? If you do not have access to ArcGIS Online yet why not try a free trail here.
You can learn more about ArcGIS maps for Creative cloud here and then try the lessons on our Learn ArcGIS site.
![]()