Sentinel-2 imagery is now available directly in ArcGIS. To see what Sentinel-2 offers try the new Sentinel Explorer App. The data is also available in the ArcGIS Living Atlas of the World, where the Sentinel-2 Views give you access to the full visualisation and analysis services. Also, you can access additional ready-to-use layers in the ArcGIS Sentinel Imagery Group.
What is Sentinel-2?
Sentinel-2 is part of Copernicus, the world’s largest single Earth observation program, directed by the European Commission (EC) in partnership with the European Space Agency (ESA). It provides multi-spectral data spanning 13 bands in the visible, near infrared, and short-wave infrared, at a spatial resolution ranging from 10 to 60 meters. Sentinel-2 is continually collecting imagery from two satellites that provide imagery for any land-based location in the world every 5-7 days.
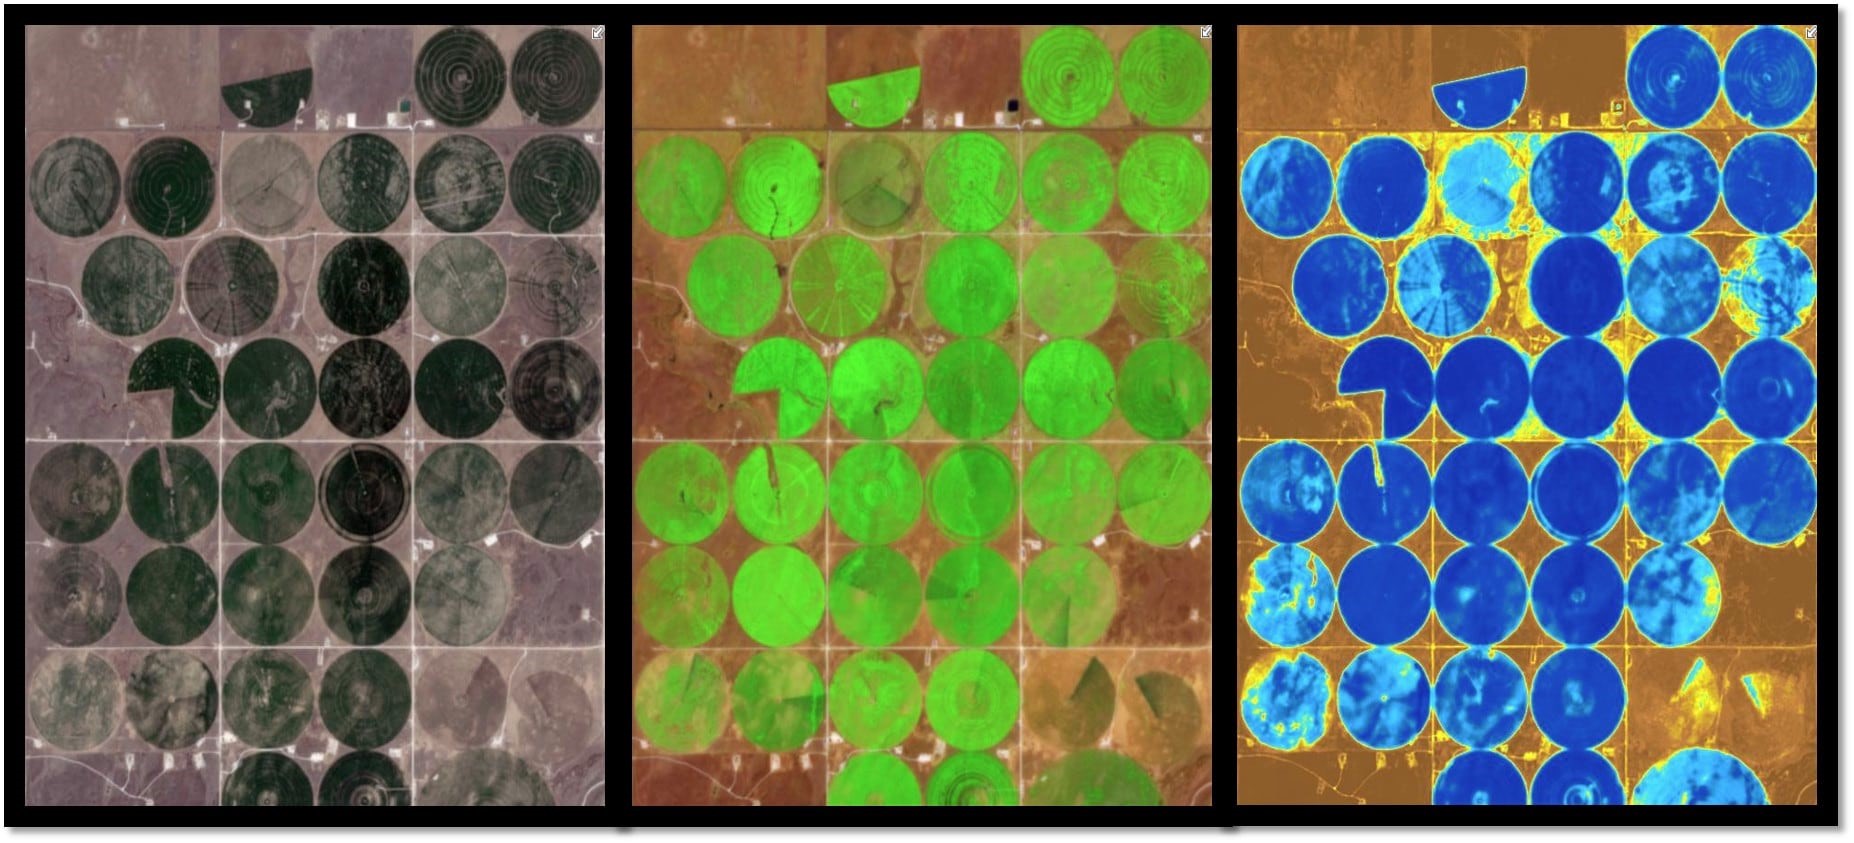 agricultural fields in various sentinel-2 band combinations. Left: Natural colour (displays the optical wavelengths our eyes naturally detect). middle: short wave infrared vegetation (showing the most vigorous vegetation in bright green). right: Water Moisture index (showing the highest moisture levels in blue).
What can Sentinel-2 Imagery be used for?
A range of image analysis can be applied to show different land characteristics over time. The example above focuses on vegetation health and soil moisture. Being able to monitor these remotely gives those responsible for land management and understanding land cover change a powerful new ally in the ArcGIS Platform. Let’s explore some other ways that Sentinel-2 imagery can be used.
Current global events
Imagery is a useful tool to call upon when natural disasters occur. Hawaii is currently in a state of emergency following a volcanic eruption. Using the Sentinel-2 Explorer App, the volcano can be picked out with the Natural Colour (bands 4, 3, 2) rendering in the image below.
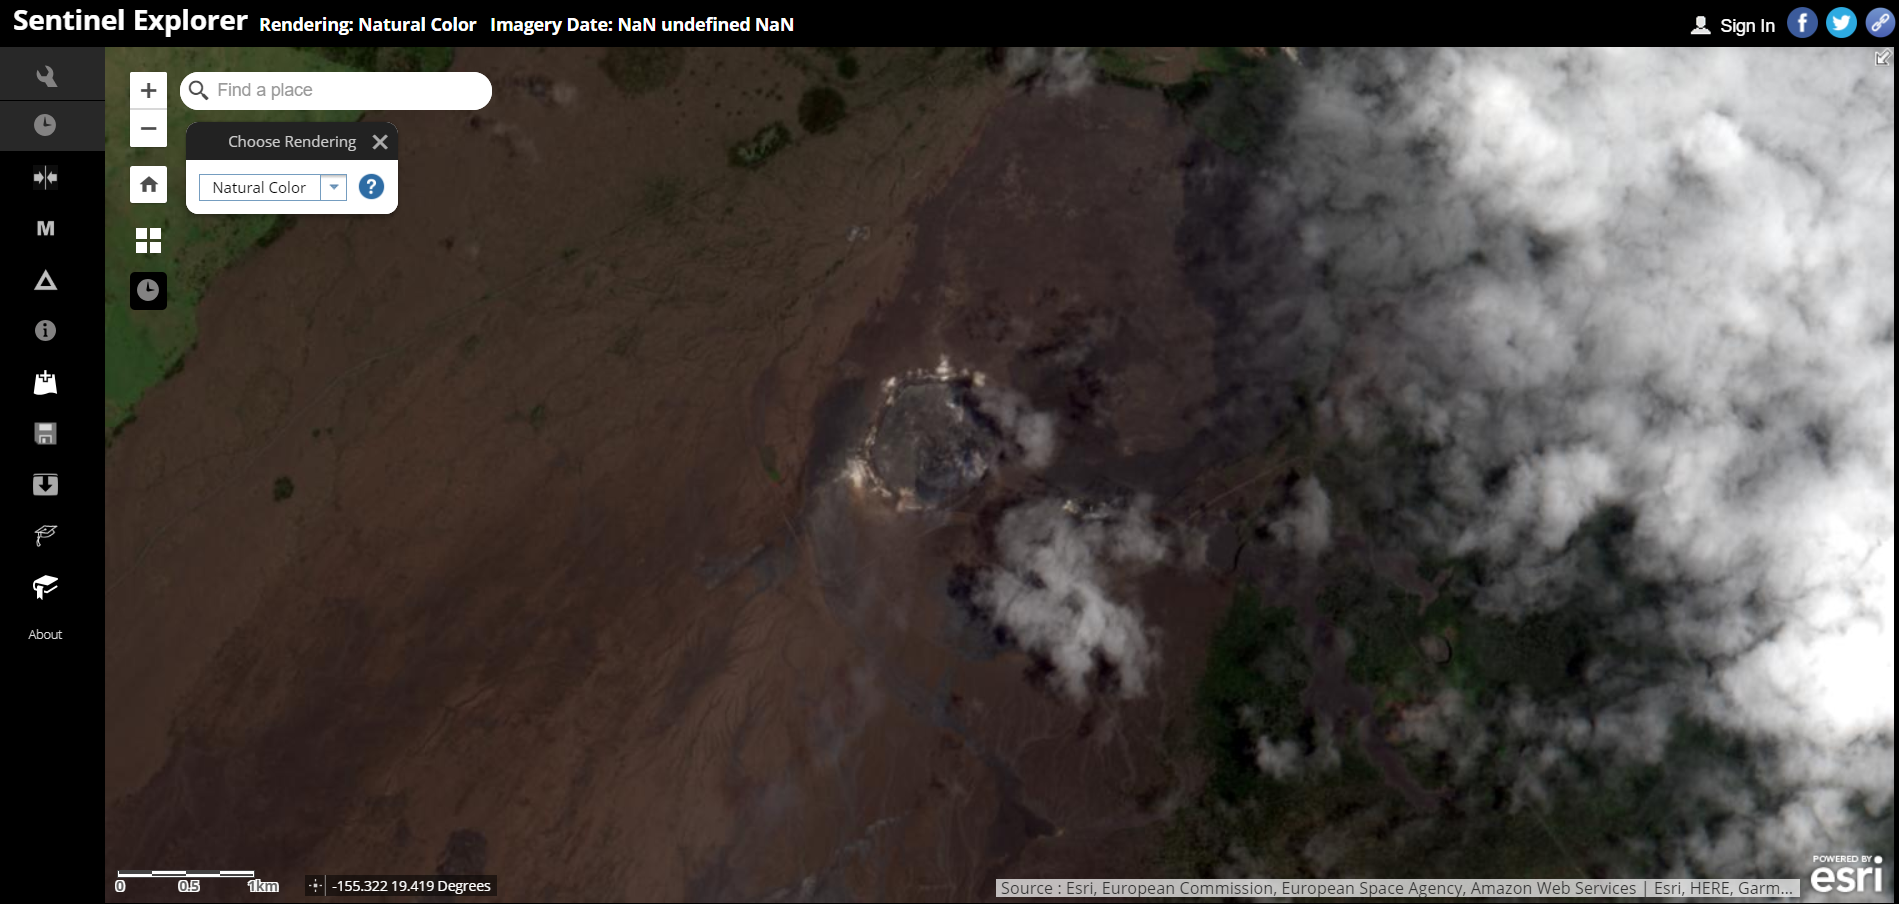 sentinel-2 explorer app. rendering natural colour imagery.
Utilising Short-Wave Infrared (bands 12, 11, 4) in Sentinel-2 provides a much clearer visualisation and understanding of the current catastrophic event. Accessing the imagery in the Sentinel Explorer App or ArcGIS Online enables you to use other spatial data, such a digital elevation models (DEM), to help predict lava flow direction and provide emergency information to those in danger.
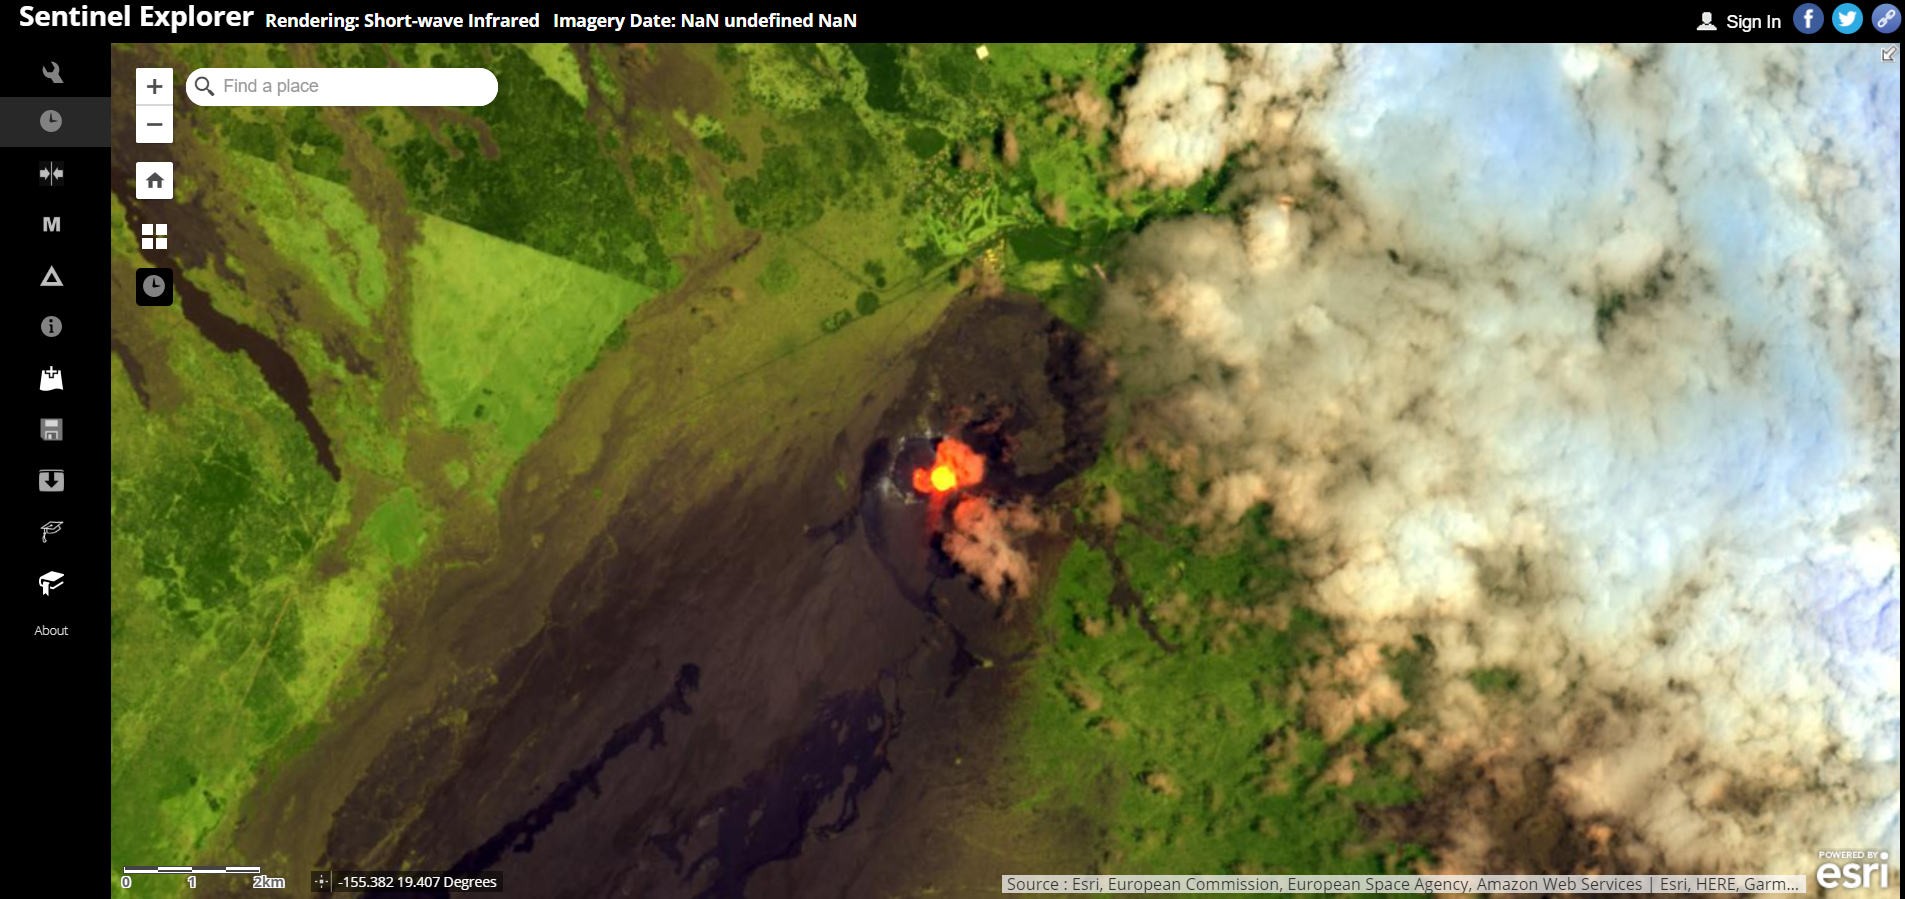 sentinel-2 explorer app. rendering short-wave infrared imagery.
Development growth over time
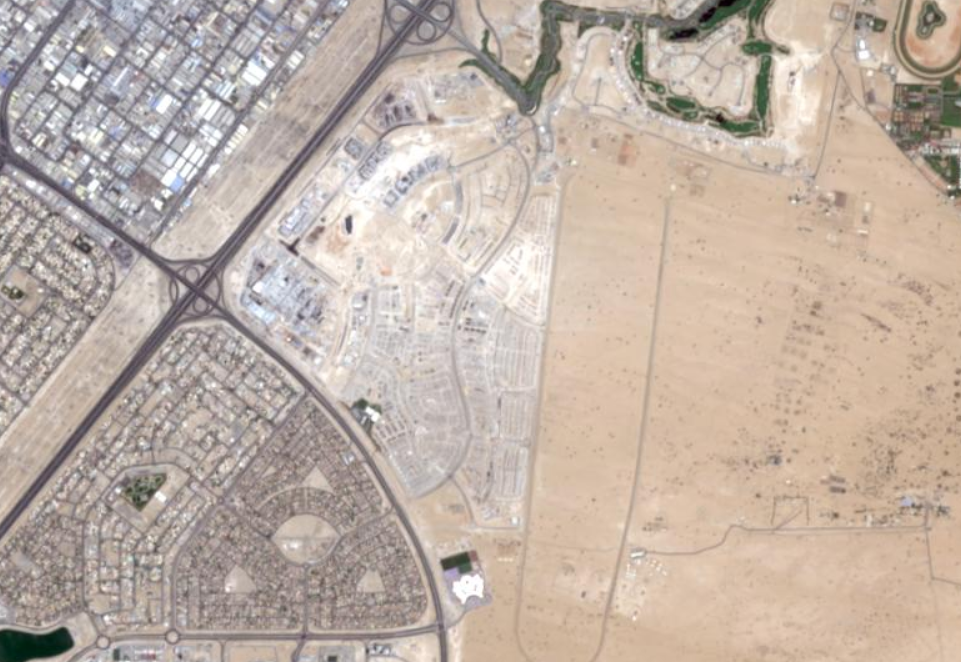
Sentinel-2 imagery can also be used to view development change over time. Over the past year, a 186,000 sq m project, Dubai Hills Mall, has been under construction. With Sentinel-2, you can explore past imagery (up to 14 months) to see the project’s progression. Development was starting in April 2017:
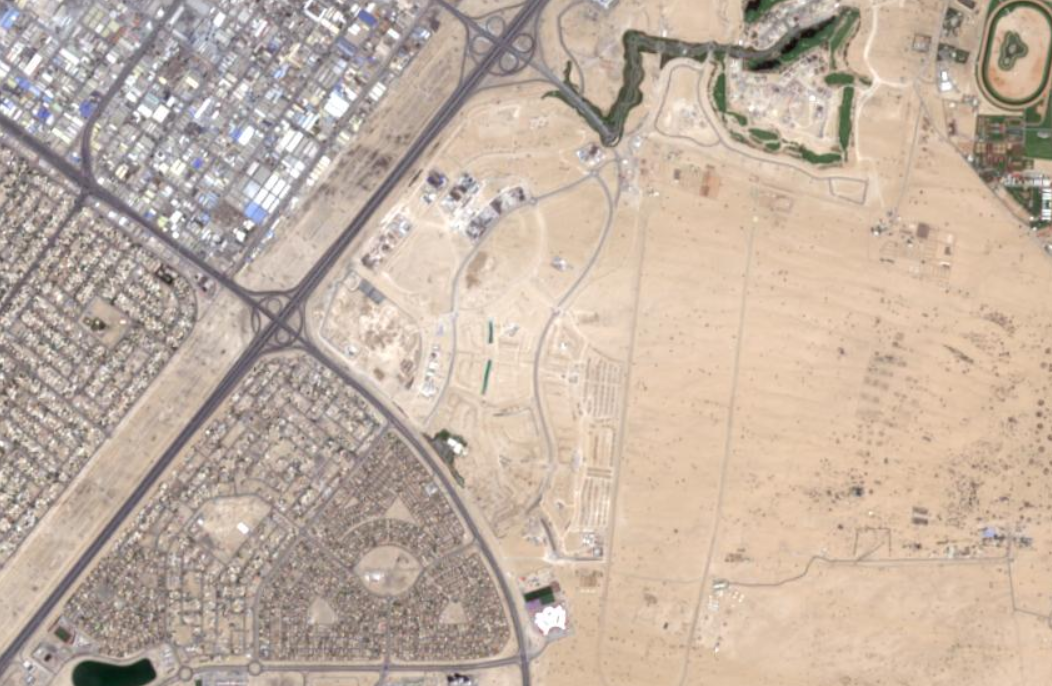 sentinel-2 explorer app. rendering natural colour imagery,
By the end of May 2018, groundwork for the whole site were well underway:
 sentinel-2 explorer app. rendering natural colour imagery,
Vegetation analysis over time
Using the Agriculture renderer (bands 11, 8, 2) in the Sentinel Explorer App, allows you to explore changes in vegetation over time. This highlights vigorous vegetation in bright green, with stressed vegetation in dull green and bare areas in brown. The two images of Aylesbury below display the changing patterns of vegetation from healthy to distressed or bare over a period of a year.
Fields of healthy vegetation, 22 May 2017.
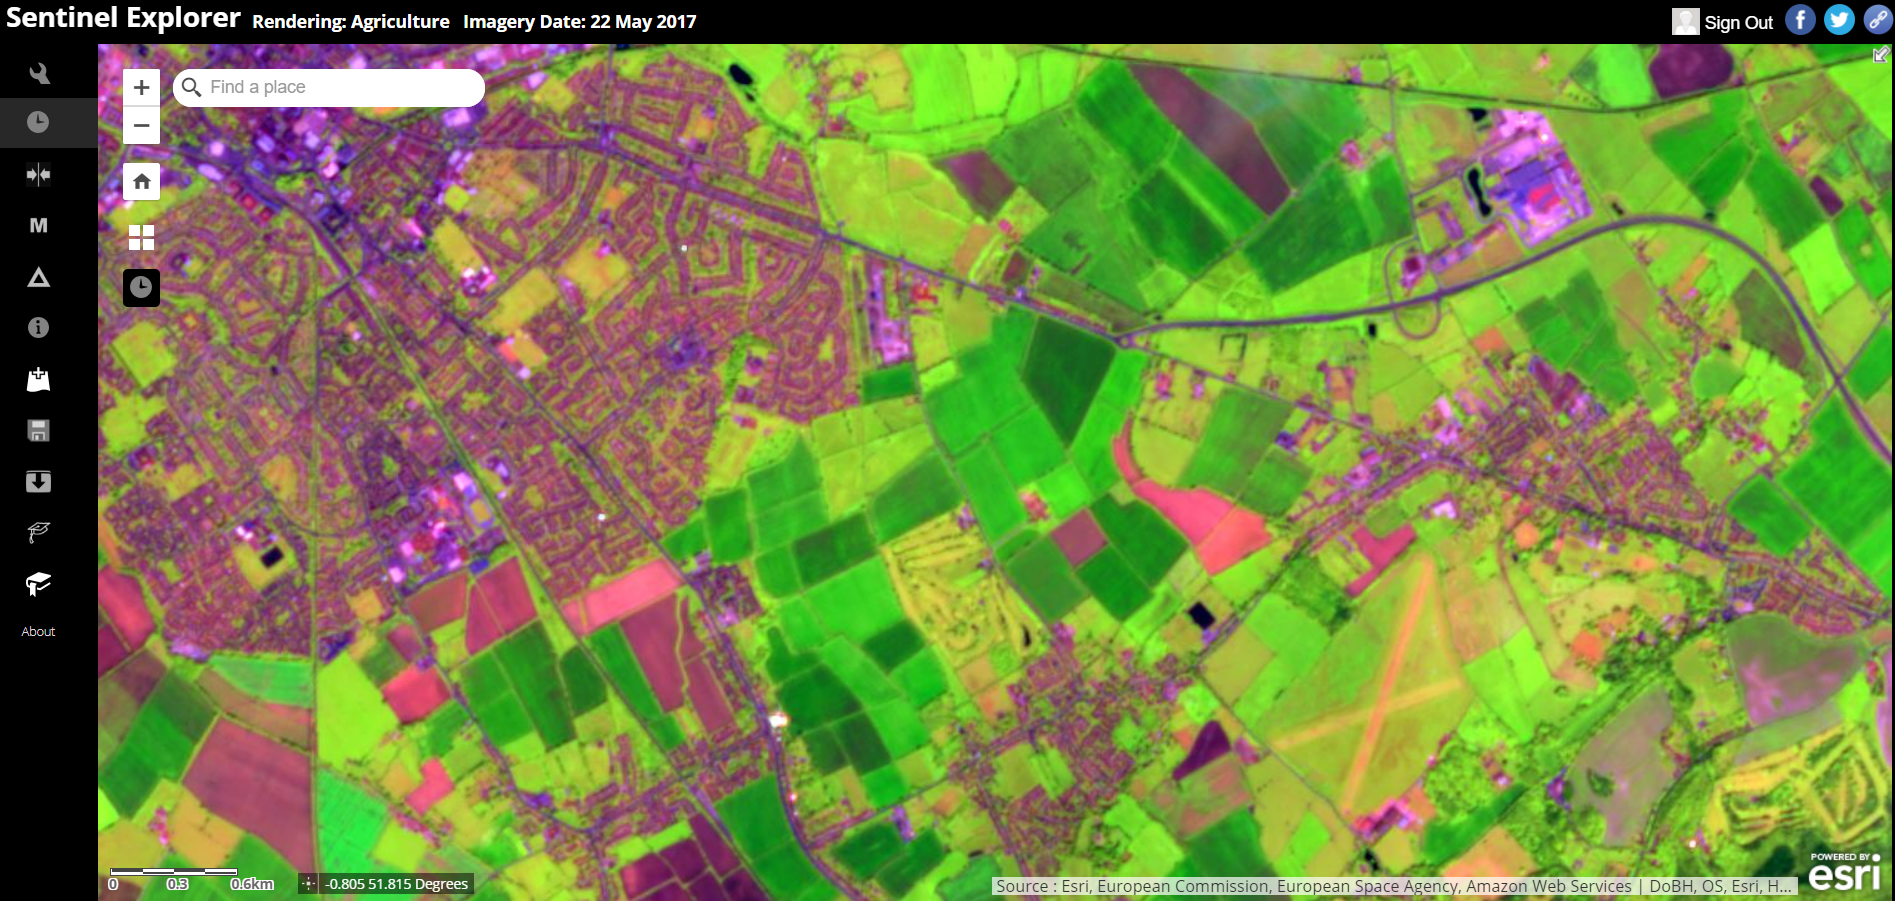 sentinel-2 explorer app. rendering agricultural imagery,
Changing planting schemes (different bare earth areas) can be seen in the fields. The grass at the airfield, in the southeast corner, is showing signs of distress after this year’s dry spring:
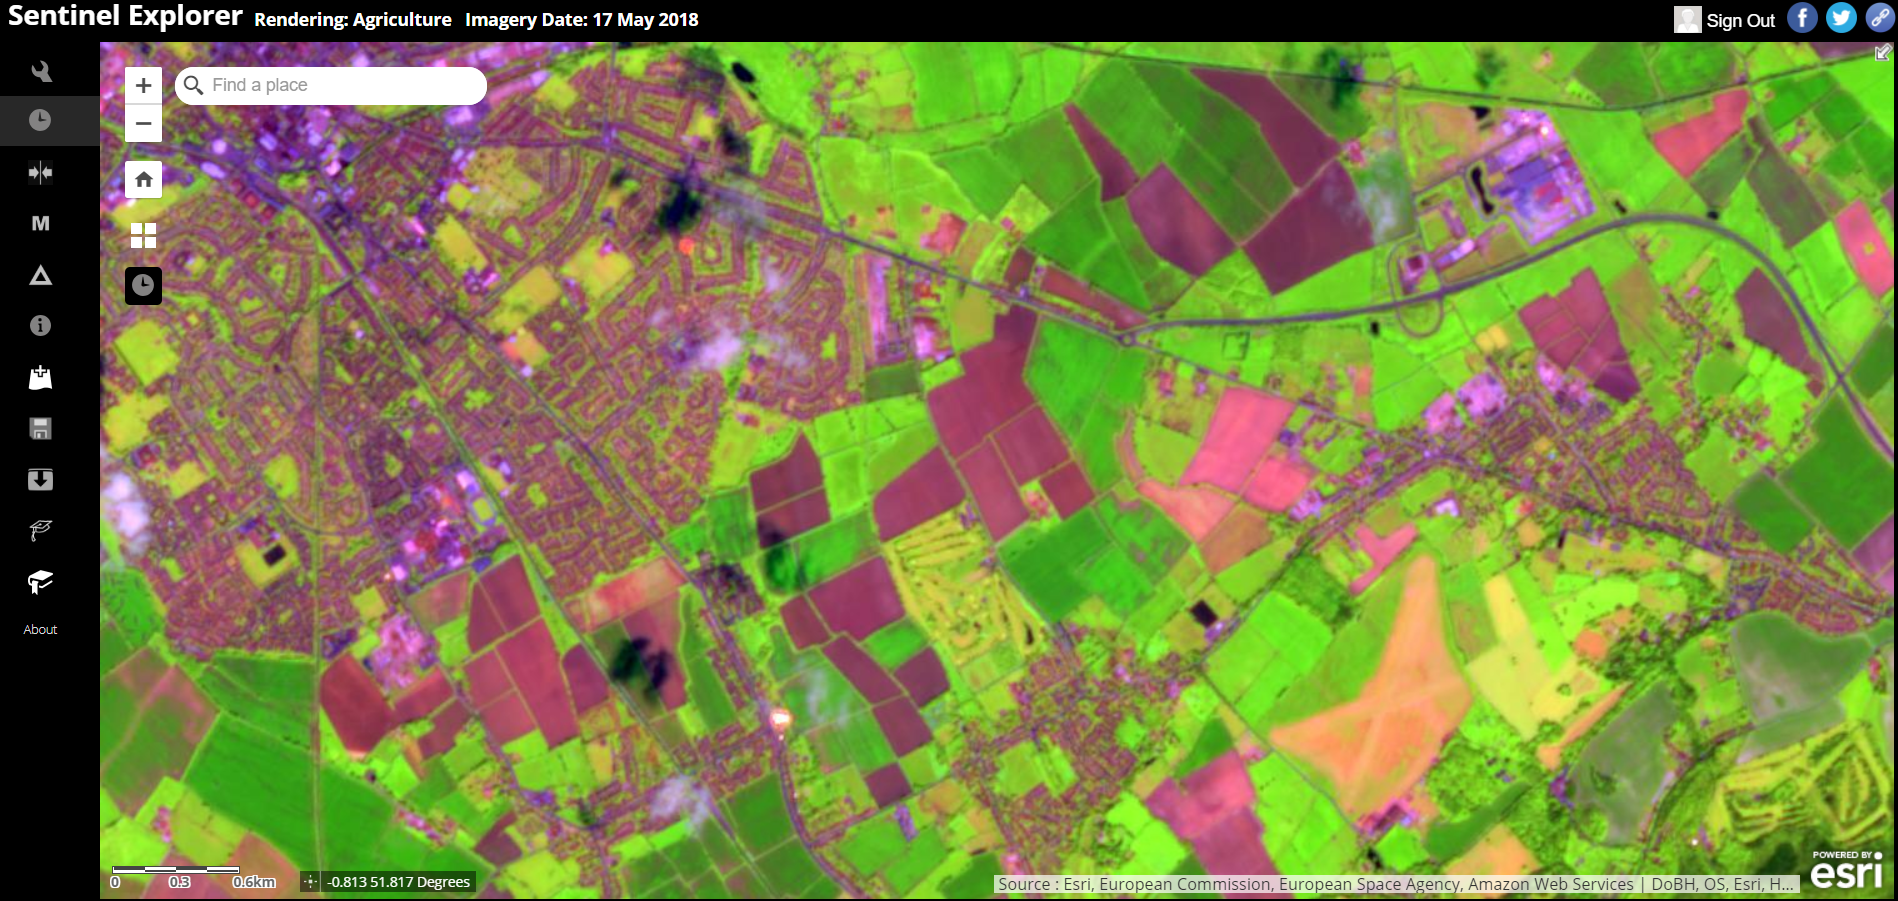 sentinel-2 explorer app. rendering agricultural imagery,
Interested in extending the Sentinel-2 Image Service?
Esri’s Sentinel-2 image service is powered by ArcGIS Image Server. If you are wishing to do more extensive predictive analysis, generate persisted products or access the entire archive, then ArcGIS Image Server with its raster analysis capabilities can be set up on scalable Amazon Web Service (AWS) cloud infrastructure. A wide range of predefined or custom analysis can then be run against Sentinel-2 and a wide range of other sources. The Esri beta Sentinel-2 image service sources imagery from the Registry of Open Data on AWS and uses AWS server infrastructure in the Frankfurt region.
![]()