The autumn update to ArcGIS Online brings a bounty of interesting new features for analysing and viewing your content. There are also updates to make managing data and administration easier. We’re just going to dig into a few.
Updating field values with Arcade
Often our GIS data includes fields that hold values which are derived from other fields - maybe it’s a normalised measure that is the observed value divided by the area of the feature. Keeping such a field up to date just got easier for hosted feature layers. For the layers you own (or if you are an admin), you can now update field values using Arcade expressions. More details and suggested good practice for bulk updates are here.
No more getting lost in a 3D scene
If you're exploring a scene for an unfamiliar area it can be hard to keep your bearings. One of the new template apps, Scene with Inset Map, lets you include an inset map that shows where in the scene your viewpoint is and what direction you are facing:
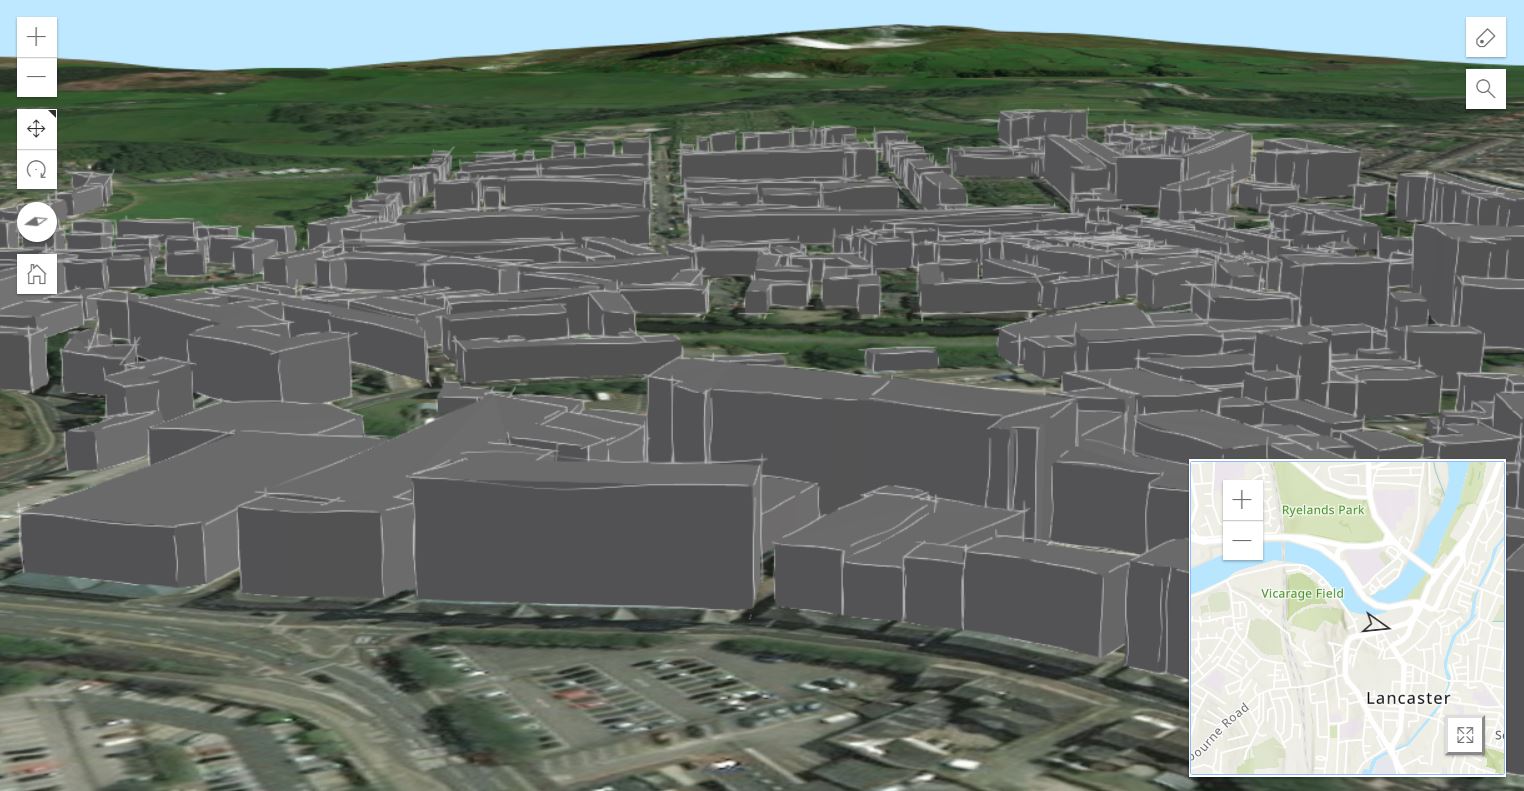
You can even have a different basemap, or choose a web map to show context information. The inset can be expanded by the user or in the configuration options you can set the app up as a side-by-side view.
There’s also a new setting in web scenes for making features in a layer searchable by a field, such as a building name or a room number.
Point clusters
Nope, not a new GIS inspired snack… but it is a great way to highlight groups of points that form distinct clusters. the new Find Point Clusters tool lets you choose the minimum number of points that constitutes a cluster and an optional distance for limiting the search. The clusters are colour coded by default:
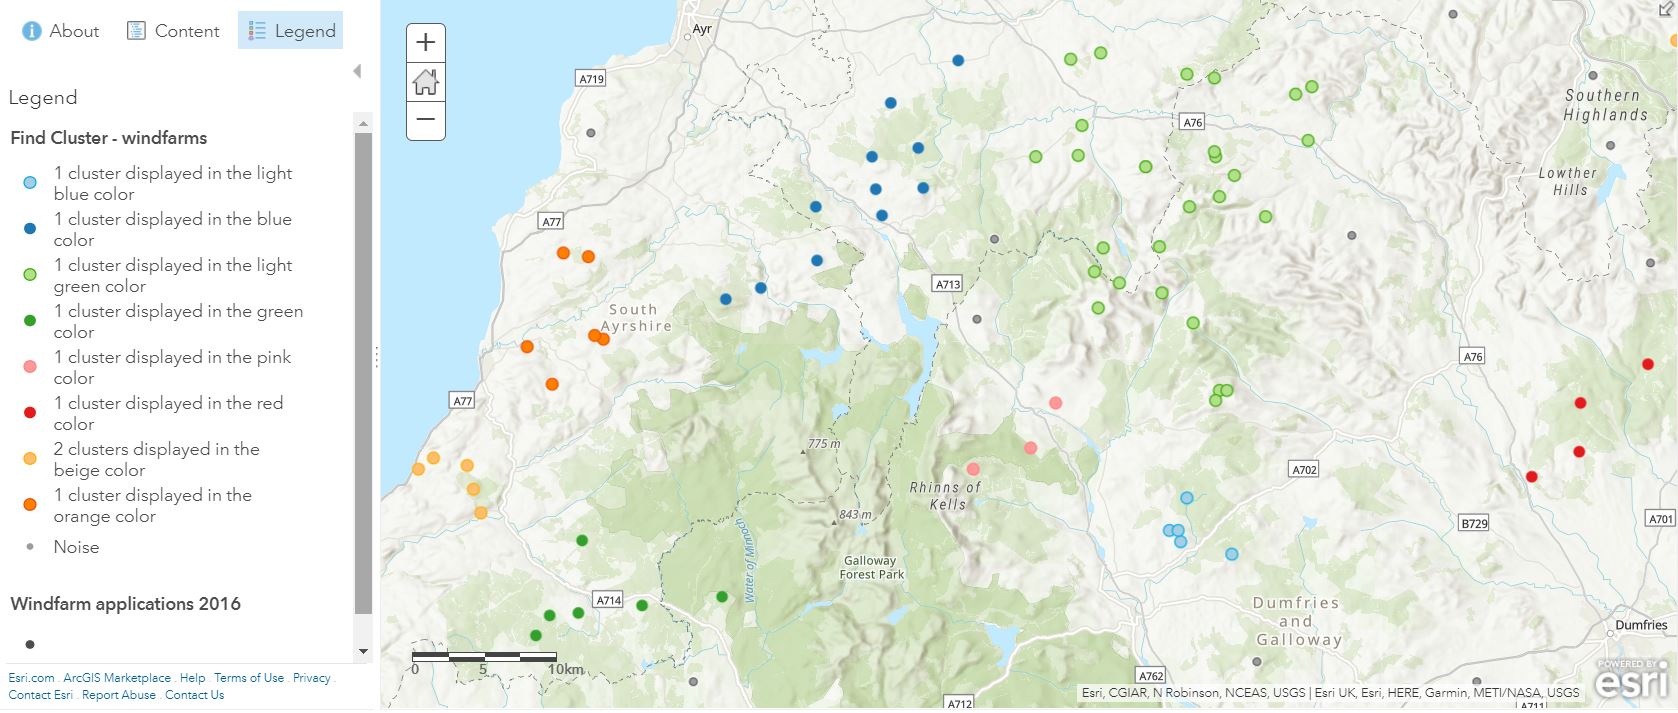
The results layer includes the cluster ID information so it’s easy to change the way your results are mapped or filtered.
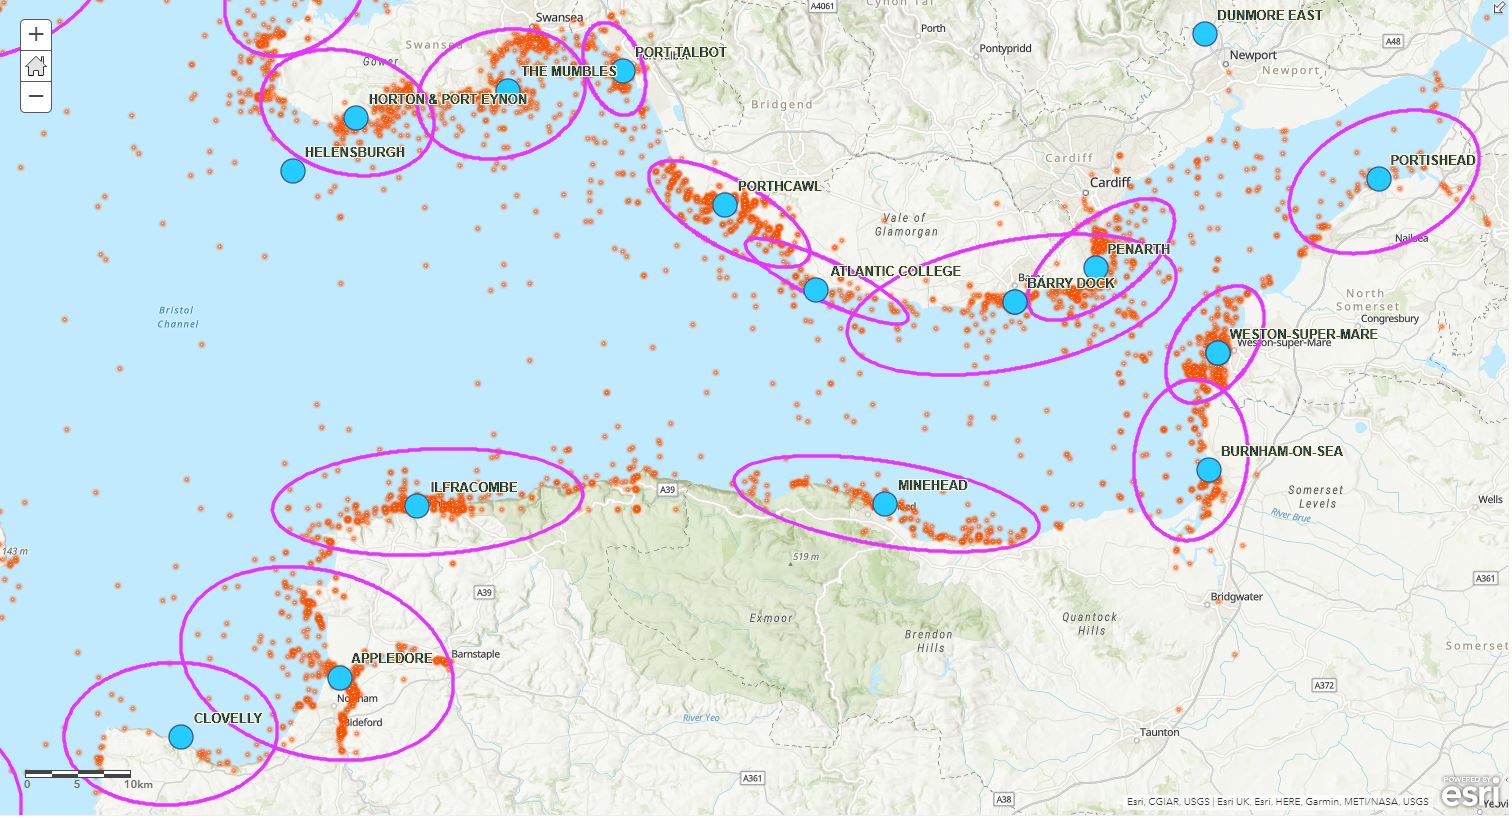
Summarize Center and Dispersion tool
I’ve used the equivalent tool in ArcGIS Pro and it’s a great way to get a sense of how point data is distributed. Bringing this into Online makes it a 5 minute job to add a shapefile or csv and analyse the distribution of the points using a statistical approach. The new tool allows sub-groups to be analysed separately, which made it a quick task to map the distribution of call-outs (using data from the RNLI Open Data site) for the lifeboat stations around the Bristol Channel:
A new harvesting tool for admins
If the dashboards within ArcGIS Online don’t quite meet your needs for reporting, there is now the option to export an audit log of activity with information about changes to the organisation and its members, groups, and content.
And the rest
No, of course that’ not all the new features and enhancements. For a complete list check the What’s New page. One of the things I haven’t had chance to look into is the ability to use a game controller for a more intuitive way to explore 3D scenes, so I’m off to see if I can nick one from my kids…
![]()