Back in 2021, many of us in England and Wales may remember filling in the many pages of the census. Since then, much of the data has been processed by the Office for National Statistics and is starting to become available to the public. As you might expect, this data has a spatial element and we’ve been working hard to make as much of the data as possible available in Living Atlas and National Data Service. Read on for more information about this exciting data:
So what’s in this release?
In this article we’ll be looking at the first results from phase 1 of the census data, which includes a huge number of statistics about different parts of the UK; this was released to the public in June. The data is also broken down into 5-year age bands (0 to 90+), 3 broader age bands (under 15, 15-64, over 64) and sex. In this attribute table, you’ll also find the census results from 2011, 2001 and 1991, allowing you to investigate population change over time.
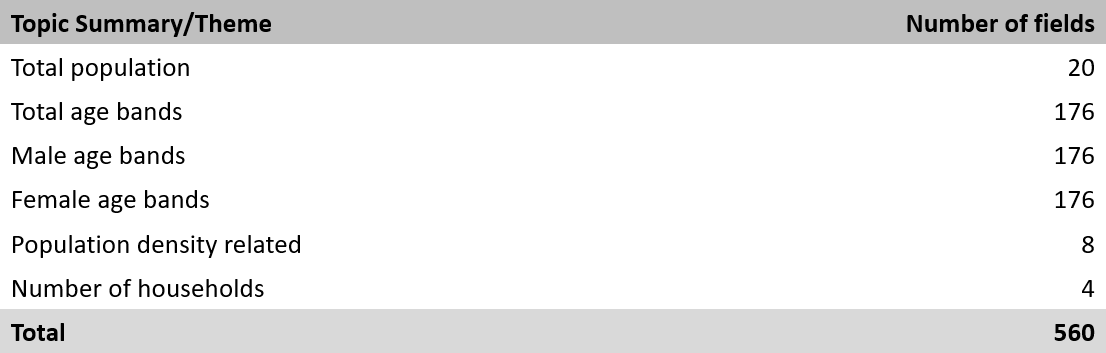
There are four different polygon layers, showing different spatial geographies, the largest of which is country, including England and Wales. The other groupings get progressively smaller: Regions (England only), Upper Tier Local Authorities, and then finally Lower Tier Local Authorities. View extents have also been included so that as you zoom in, more detail becomes visible.
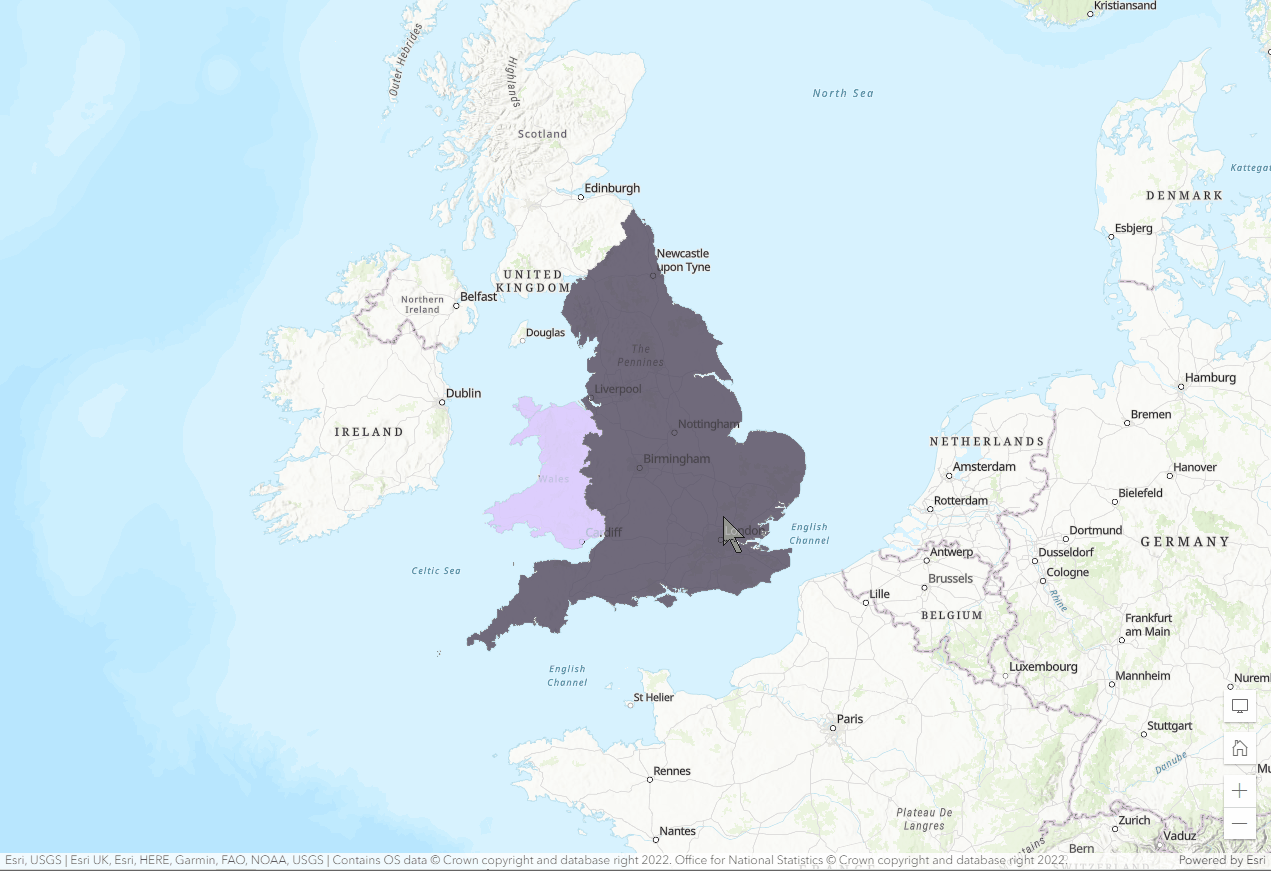
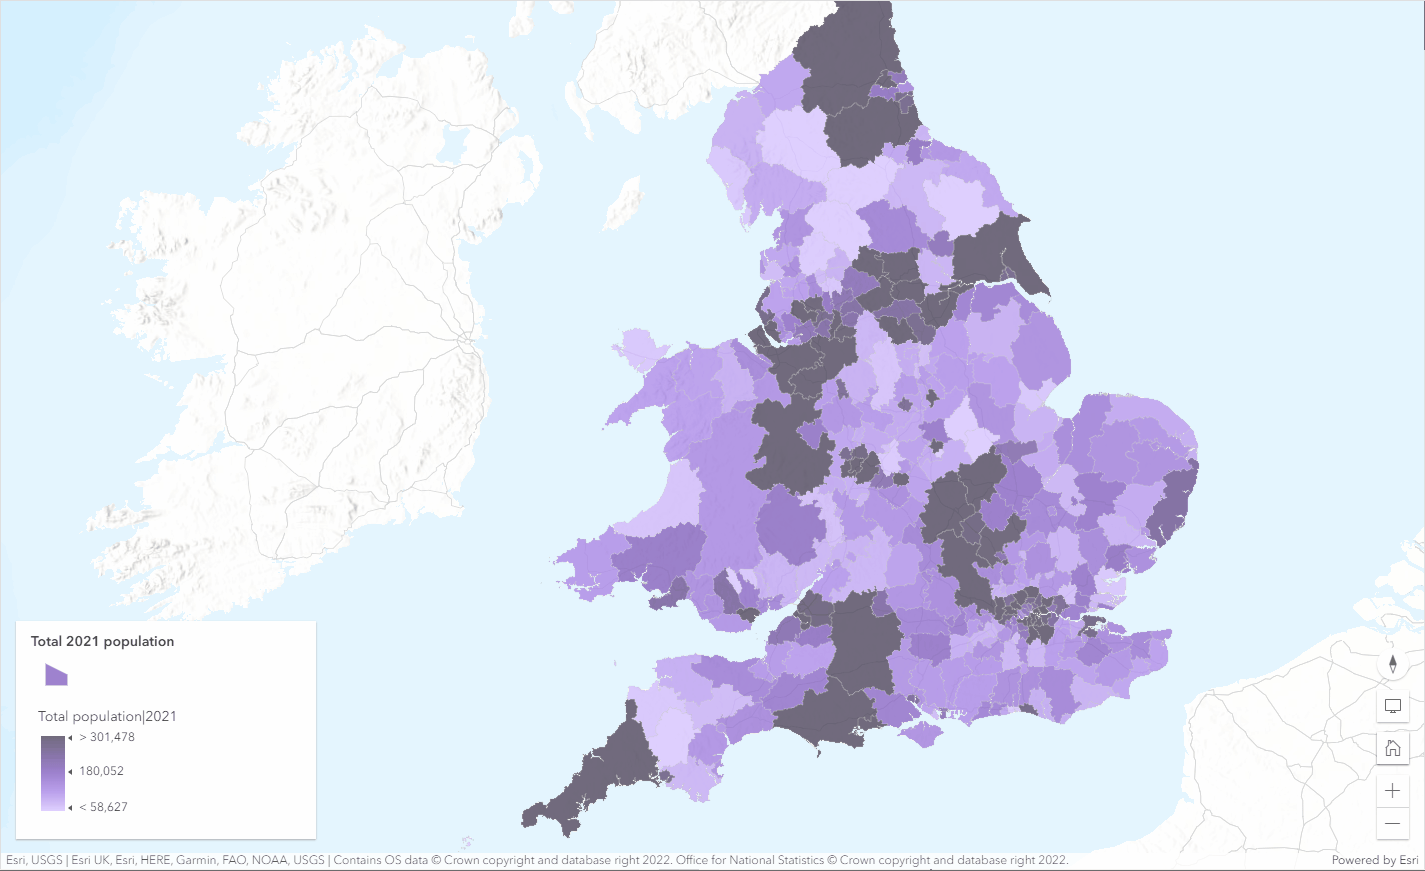
By default, the symbology of the data represents the total population of each of the areas; places with a darker fill have a greater population than those with a lighter shade. Pop-ups have also been created using Arcade expressions to provide more information about population change since the 2011 census. But if you want to dig into it, the data is all present in the attribute table for you to explore. If you’re interested in any of the maps shown below, you can explore them in an app by clicking here.
What could this data be used for?
There’s a lot of data available here, and whilst there’s more coming later, there’s a huge amount that can be investigated already. You could generate statistics about population growth over time and space using the past census information, or even generate a graph showing this to include in pop-ups.
Why not combine this feature layer with other data that’s available in Living Atlas? Answer questions such as:
- Do the most densely populated areas have enough access to the national cycle network?
- Do areas with higher deprivation have the same population growth rate as others?
- Is the number of supermarkets in an area directly related to the population size?
What’s next for the census data?
As we’ve mentioned before, this is only the start of the census content releases for England and Wales on the Living Atlas. You can read more about the other datasets that are being generated from the census here, including information about housing and migration. Be sure to check out other datasets in Living Atlas, as well as the National Data Service for other statistical data.
If you have any questions on anything in this article, please get in touch with DataCurator@esriuk.com