The latest update to ArcGIS Online blew in overnight with the windy weather and I immediately got hooked by the new Effects you can apply to your layers. The update also includes a new Chart type, new Instant Apps, enhancements to the Scene Viewer and a new option to schedule admin reports. There are also updates to ArcGIS Experience Builder, ArcGIS Dashboards and ArcGIS Web AppBuilder.
Making your maps effective
The New Map Viewer has already opened up a world of improved symbology and better clustering. In this update they’ve given us a whole new set of cartographic toys with the addition of Effects. These allow you to apply graphic style effects to your symbology such as Bloom and Drop shadow. You can control the settings for each effect and the order in which they are applied. Much as I like the Bloom option for making lines stand out, it would have been a bit much with the clustered RNLI returns data I was looking at. Instead, I went for a Drop shadow to pop the clusters off the basemap and then Blur to soften them a little:
Definitely a feature that is worth having a play with to see what it can add.
Line charts
I’ve been really impressed by the chart functions in the New Map Viewer and these are now out of beta. They are a great way to explore data patterns in a different way, alongside the geographic, and they’ve now added Line charts which are ideal for time series data. For large data sets you may need to aggregate the data but this is easy to do by: count, mean or sum. You can add multiple series to a chart or use the quick click Split by function – applied here to the RNLI data:
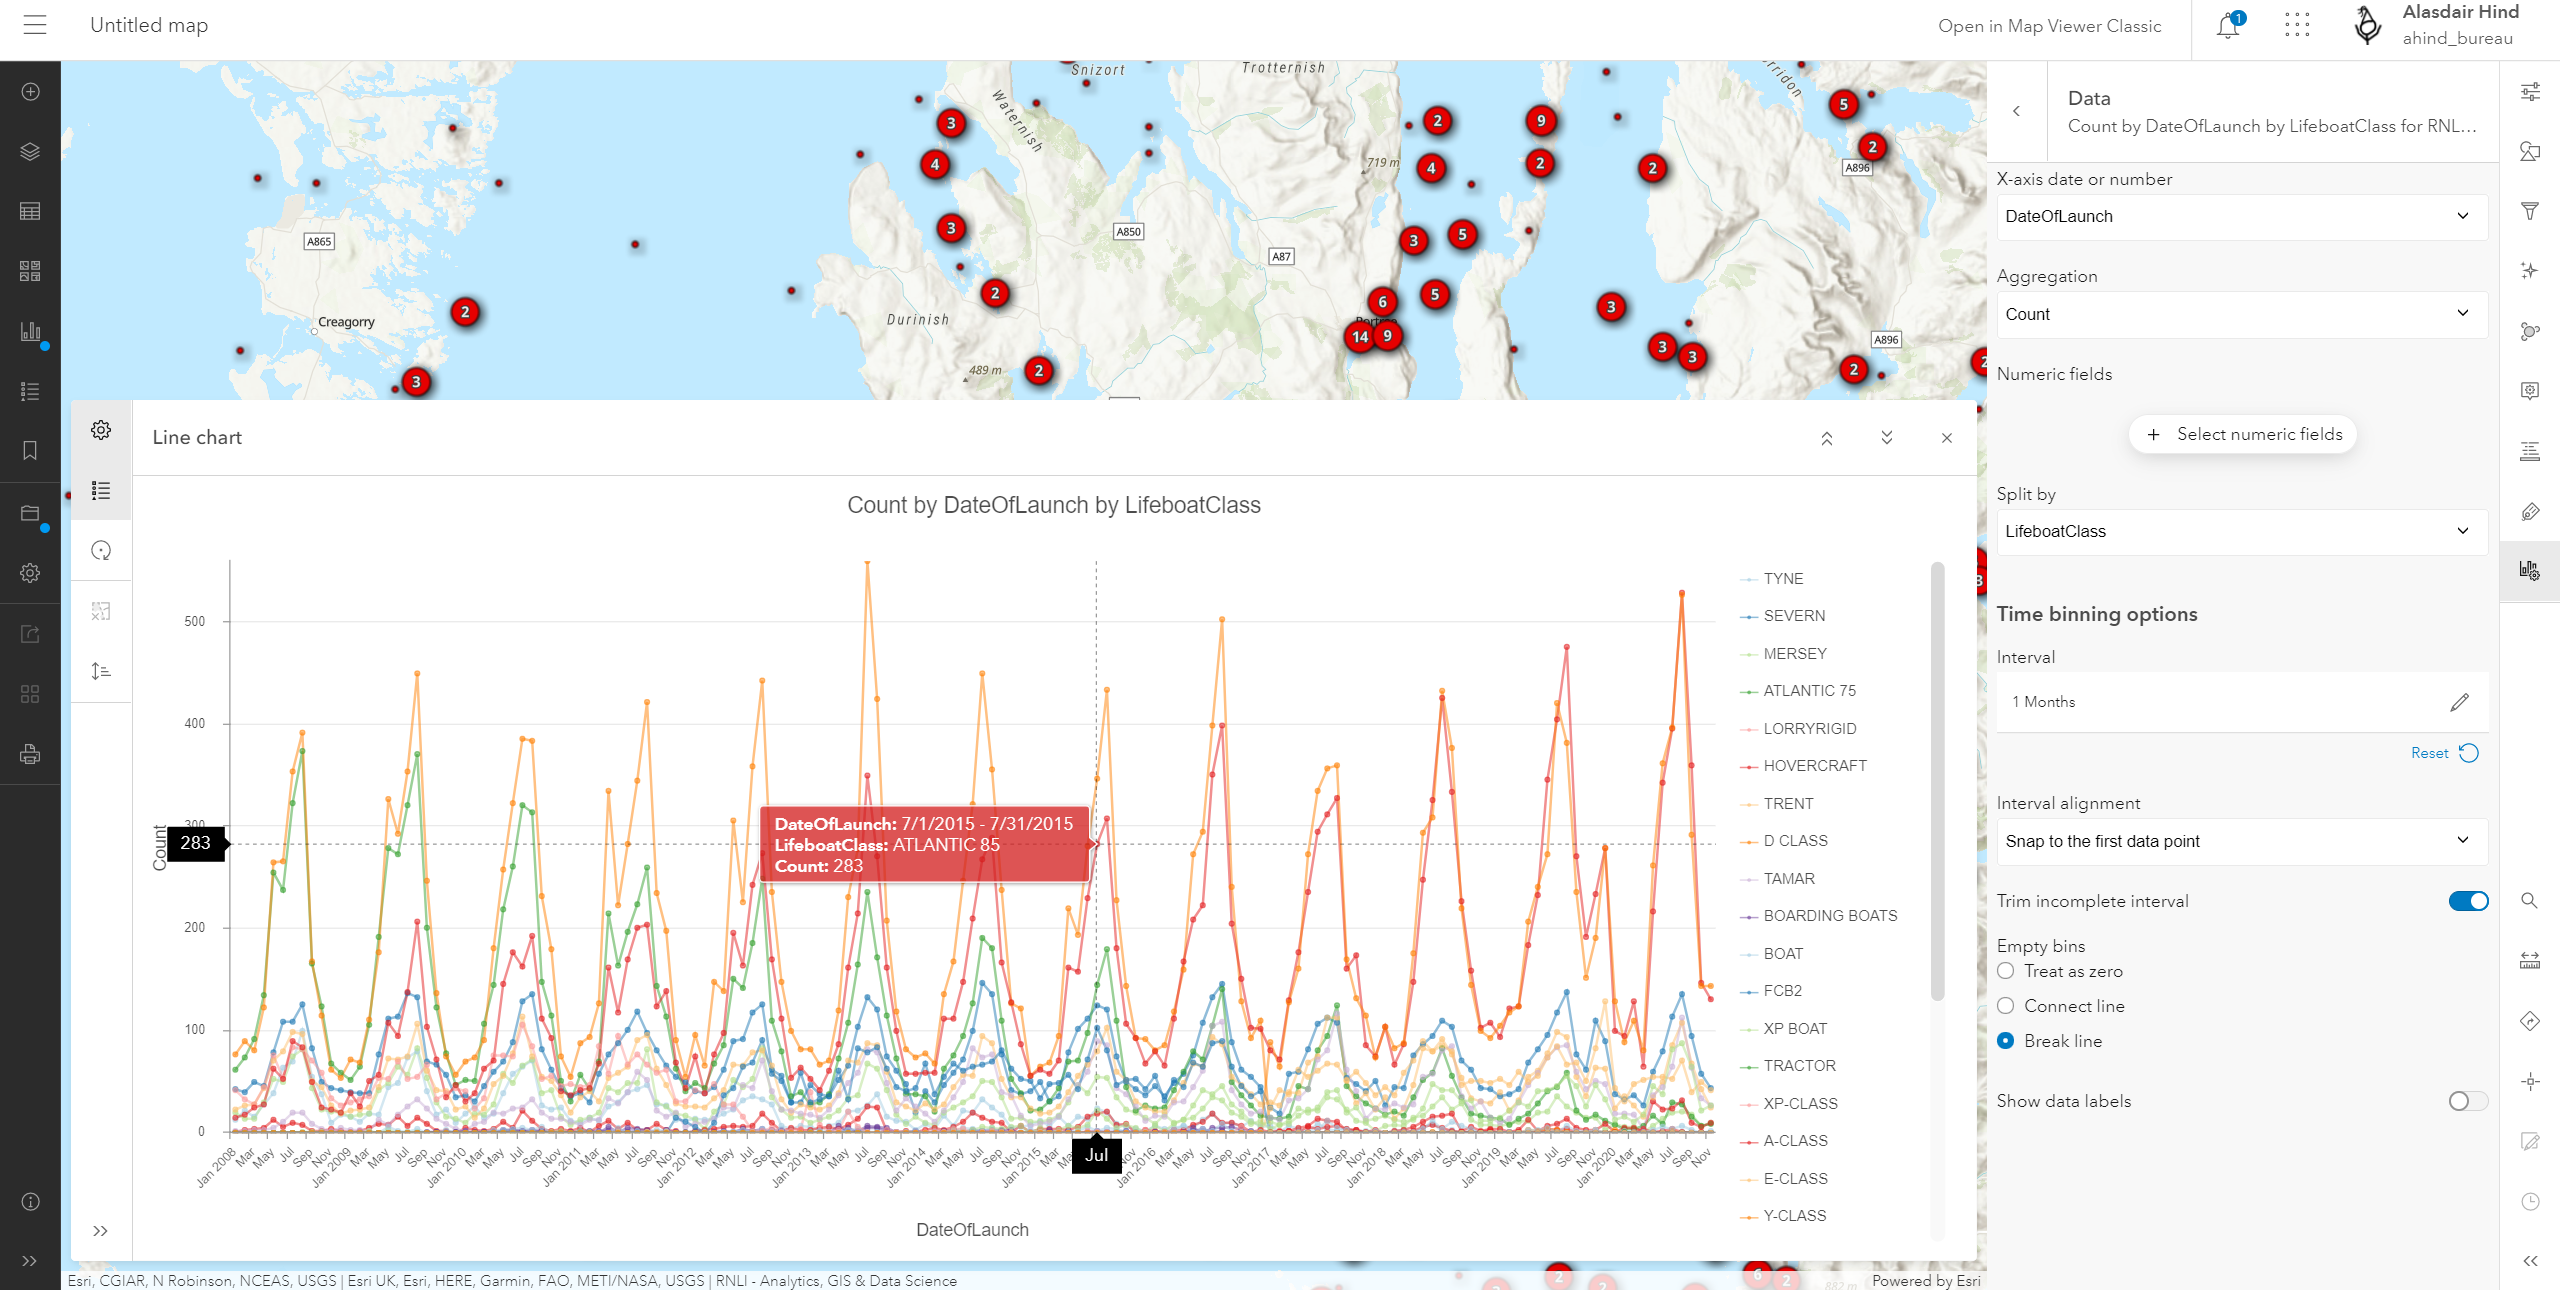
The interactive guides make it easy to check individual points on the chart for more information. For details on visualising change with the Line chart function have a read of this blog post.
Instant Apps
The ArcGIS Instant Apps make it really quick to publish your map and the library of app types is still growing. New in this release are Basic and Sidebar – which uses a fixed side panel to display info to the user. There are also two new beta apps: Chart Viewer and Slider. This blog post takes a detailed look at all of these.
Instant Apps are built on ArcGIS Maps SDK for JavaScript, so you can confidently share maps that use any of the features in the New Map Viewer.
That’s not all folks
For the full list of what’s changed in this update be sure to check the What’s New page. You can get an overview of the update – including the features I’ve covered – here. Or if you are looking for info on ArcGIS Dashboards you can jump straight to this blog post and learn about the new data download option.