You’ve spent the past few hours creating a map in ArcGIS Online. It’s fine. It does the job, but you know that there’s room for improvement. If only your organisation’s branding scheme could be integrated into the map. Or, if you could quickly convey meaningful information to your viewers when they interact with data points. With a bit more customisation flexibility, you know your map’s presentation would be infinitely improved.
Arcade is your answer – a lightweight scripting tool built for the ArcGIS system to elevate your map quickly and effectively. Before writing this blog I’d never heard of Arcade, but keep reading and you’ll hear how an utter novice tackled learning to code and applying it to her maps. And how you can too.
Eve’s Master Plan to drink coffee under the guise of ‘research’
Step 1. Understand Arcade Fundamentals
Step 2. Create coffee shop web map criteria
Step 3. Use Arcade to bring these custom style choices and on the fly calculations into fruition
Step 4. Troubleshoot
Step 5. Debrief
Understand Arcade Fundamentals
Arcade is a scripting language native to the ArcGIS system and is a handy tool for map visualisation (symbology, transparency, pop-ups, labels, etc), calculations, and customisation within apps. Build your understanding with the following starter pack:
Starter Pack
Arcade has terminology which describes how it functions and where things in the Arcade editor are stored. Before I began to code, I needed to know what terms and phrases make up the Arcade toolkit.
Expression
Chunks of code written for a specific purpose, such as finding the average of a data set. Each expression can be titled, saved and stored for integration into your map customisation later. An expression is made up of features, strings or functions. These components store information within square brackets [] or parentheses (). Expressions are built linearly, meaning that the order in which you assemble your code chunks matters to how Arcade reads it.
Feature
A data type containing attribute data and sometimes a geometry. Feature sets contain multiple features.
What about $feature?
Great question. $feature is a profile variable that represents an input feature to an expression. It makes it easy to calculate values from a feature’s attributes. For example, if I want to bring in flat white price data from my coffee shop feature, I’d write $feature.fwcost.
Profile variable
Data values used as an input within an Arcade expression, beginning with a $ character.
Attribute
Characteristic / sub category within a feature, such as the address or flat white price within my coffee shop feature.
Geometry
A spatial property of a feature that cannot be changed. Geometry types listed here.
Strings
Text, or combinations of text and attributes that work to create a meaningful sentence from your data. In order to be text to be read and returned as text, instead of as a variable or function, it must be between a set of quotation marks.
Function
A pre-defined command that signals Arcade to do something specific. For example, Count($feature.name) is a line of code, where Count is the function that tells Arcade “hey, count how many things there are within the Name attribute of this feature.” Full list here.
What does the Arcade Editor look like?
Thanks to recent updates in ArcGIS Online, the Arcade editor layout has been vastly improved, including a more approachable layout and troubleshooting capabilities (more on that later). The Arcade editor has a simple appearance with the following key components:
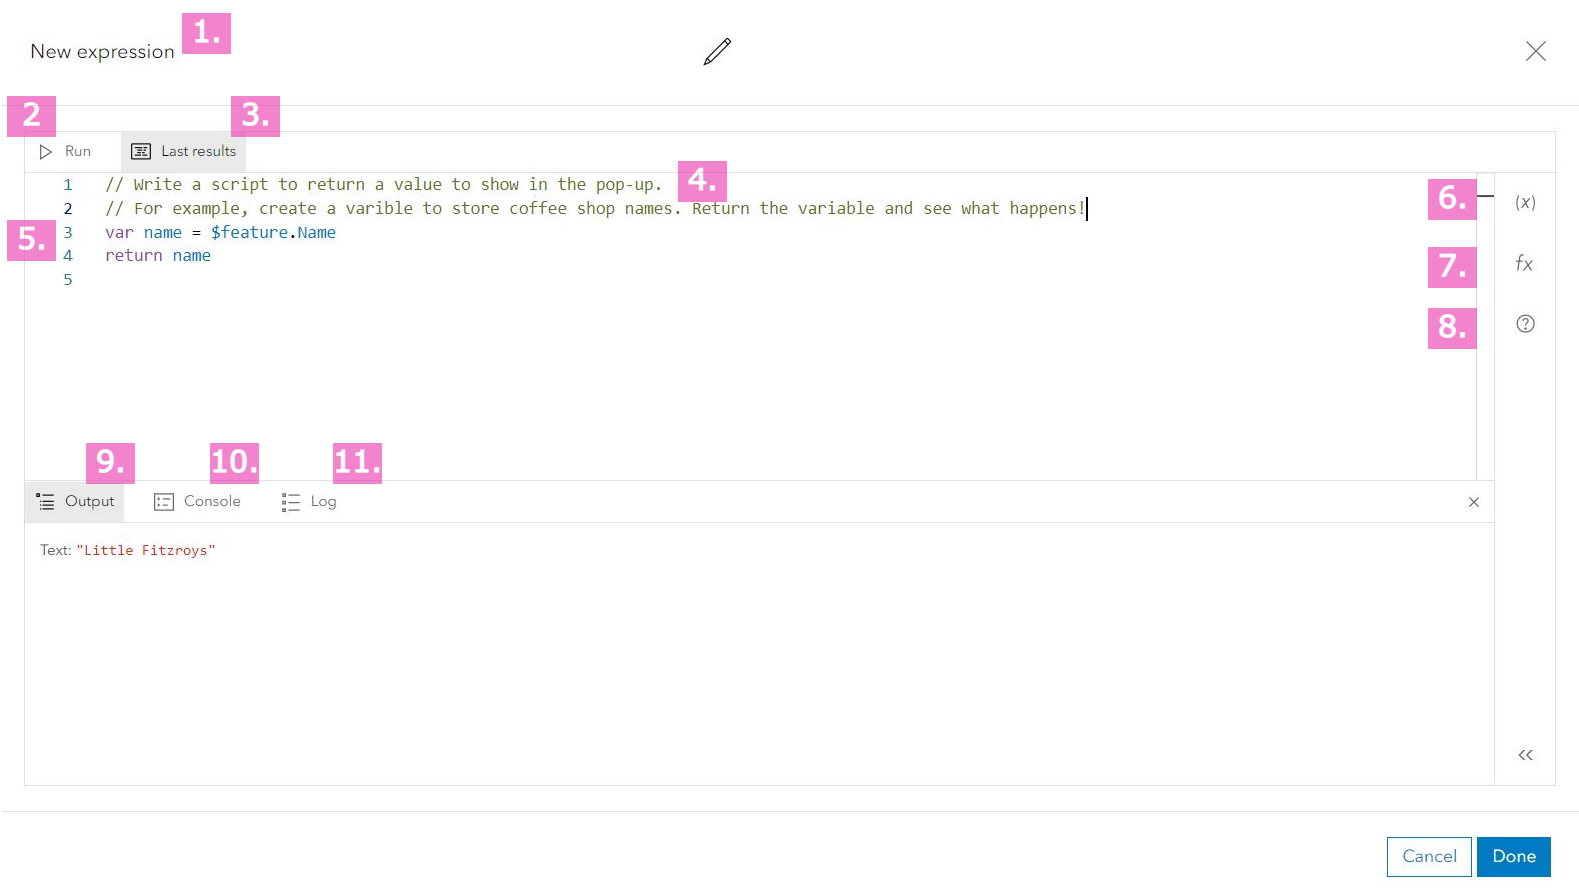
Arcade editor layout
- New expression is where you title your expression. Pick something meaningful that makes it easier to identify when it appears in a list of expressions.
- Run executes your code so you can test if your code is doing what it’s meant to.
- Last results shows the last output from your Run.
- Backslashes mean the following text is a comment and isn’t read by Arcade. It allows you to document what you’re doing so you can look back without too much head scratching later.
- This panel is where you write your expressions
- [x] button is for profile variables, also known as globals. They are the umbrella term for all different data inputs you can use in an expression. For example, $feature. represents a feature within your map. We’ll use these variables later to call upon specific information from within our coffee shop feature.
- fx button holds the functions! From statistical to spatial analysis, this is where the library of functions live, along with information and example code.
- Can you guess where you might go if you’re baffled by what a function means? Yup. Click the ? button.
- Output displays what your code produces. If you are returning a variable, the outcome is sent here. If your code isn’t working, error messages appear here too.
- Console is a saving grace for troubleshooting. If your code isn’t working, type Console(insert variable) and then press Run for more context about the issue. Instead of returning a value, it logs a message in the Console window to help with debugging.
- Log lists your operations by recency.
Create coffee shop web map criteria
I’m one to dive right into a project, but for the sake of my short attention span we’re going to create map criteria to keep us on track. This map should use some of Arcade’s key capabilities to showcase some of my favourite coffee shops across Edinburgh. This map will…
- Have easy to see, clearly labelled data points.
- Display a custom pop-up upon each coffee shop point being clicked.
- Use on-the-fly calculations to determine each coffee shop’s proximity to the office.
Solid list, let’s get started.
Use Arcade to bring these custom style choices and on the fly calculations into fruition
Lovely labels
With my coffee shop data uploaded to Map Viewer, I am ready to add labels. However, I had no plans to struggle through these Arcade tasks without guidance. After googling “Create labels arcade ArcGIS online,” this gem was one of the first results.
To access the Arcade editor I followed the right hand toolbar’s Label button, and then selected the </> icon off to the right of the Label field dropdown. We were in.
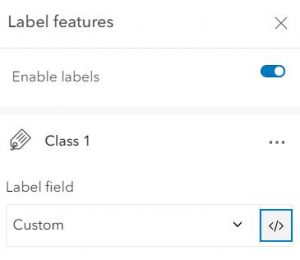
Accessing the Arcade window with a few quick clicks
I want my labels to display the name of the coffee shop and the price of a flat white. To achieve this, I need to write an expression. While functions are pre-defined commands readily understood by Arcade, extra text like my “/5” are Strings and must be sandwiched between a set of quotation marks to be read. To preview what my labels will look like, I Run the code and make any other changes.
Custom labels configured within a single line of code
Pop-up pizzaz
Adding pop-ups to the map is as simple as selecting the Pop-up button on the right side toolbar and toggling on the Enable pop-ups slider. However, the default pop-up creates an attribute table which displayed more information than I need and didn’t match the aesthetic I’m going for. Luckily, Arcade allows me to make custom expressions which pull attribute information together into tidy text outputs. So, if you’re making a pop-up and want to avoid informational clutter, Arcade can help.
Accessing the Arcade window within Pop-ups
Once you understand the mechanics of expression writing, Arcade becomes a playground for creative, useful scripts. I explored how variables create shortcuts for concise coding and wrote some cheeky strings that appear in pop-ups depending upon how expensive a flat white is. Selecting which function to use is easy – each has an attached informational blurb explaining its use cases. The provided sample code allows me to piece together my own expressions without having to dig for examples elsewhere.
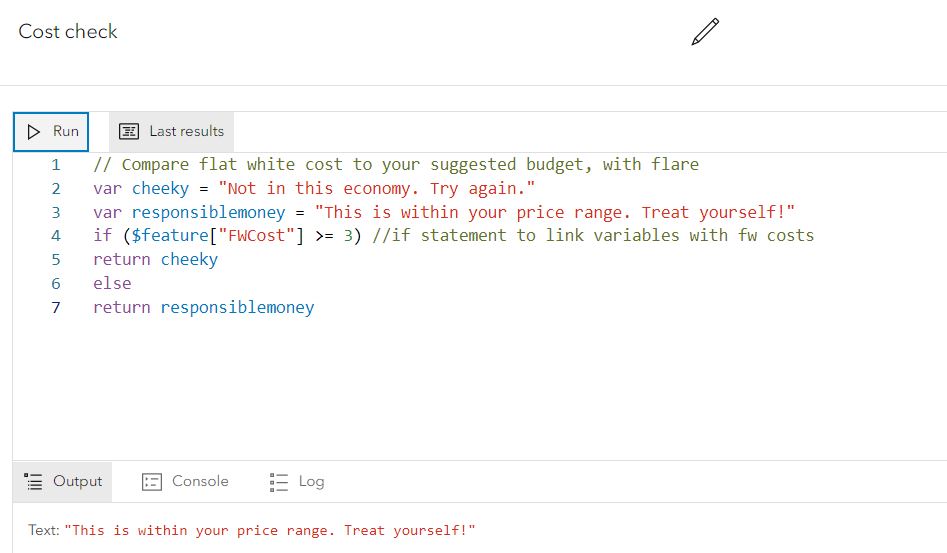
Some zesty example code which assign strings to different Flat White prices
With my expressions ready to go, I easily added content to the pop-up using the aptly named Add Content button.
For users or organisations with branding schemes, Arcade helps you adhere to these down to the hex code. To match my pop-up text with the map’s monochromatic pink theme, I only need a few lines of code containing conditional functions. My final script assigns specific colours to my pop-up text depending upon how expensive a flat white is, all in various shades of pink. How fabulous.
Code which returns various hex codes corresponding to flat white price ranges. Light pink text was for the budget friendly bevy
Clever calculations
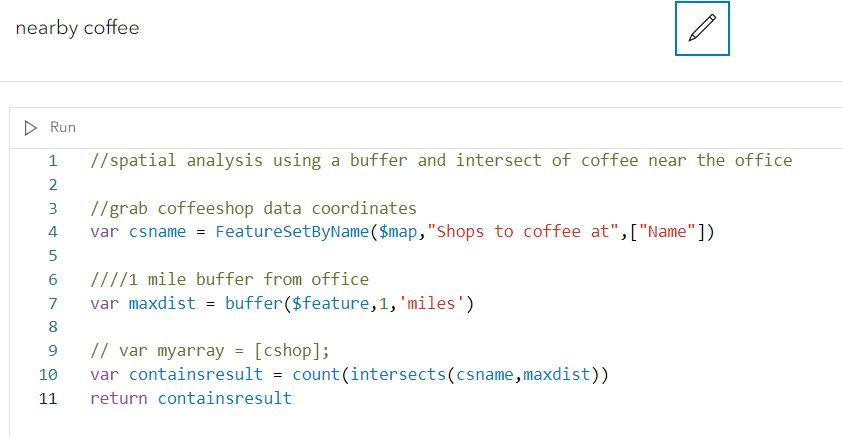
We’re still not done. Arcade goes beyond labels and symbology to do some nifty spatial analysis tasks. It offers quick and simple ways to relate separate data layers. If you don’t have a layer already on your map, you can use Arcade to pull sources from, like the Living Atlas. In my case, I want to calculate how many coffee shops are within a 1 mile walk from the office (that’s a little over 1.5 km for you metric fanatics). For more information about pulling in external data into pop-ups, check out this blog.
Note: While it is simple to include external data sources within ArcGIS Online, integrating data into Enterprise can require more time. More on Arcade within Enterprise here.
This newfound data needs a separate, office-specific pop up to showcase it. However, it looks sparse with only a single number as its output. Let’s use Arcade expressions to provide more details AND statistics to provide quick insights into a data set. Now, my office pop-up provides me with a list of nearby coffee shops, their names and the average cost of a flat white.
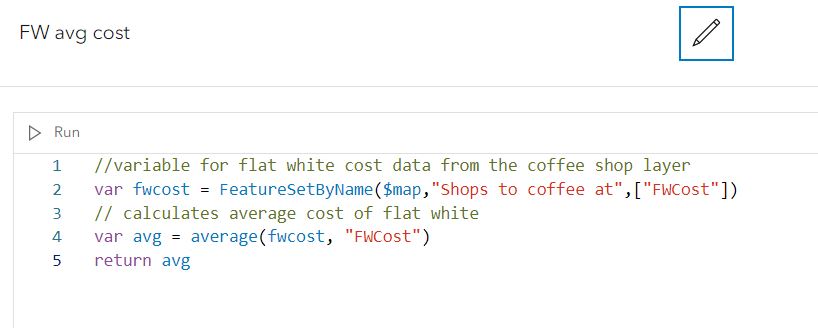
Arcade sample code for computing statistics like averages
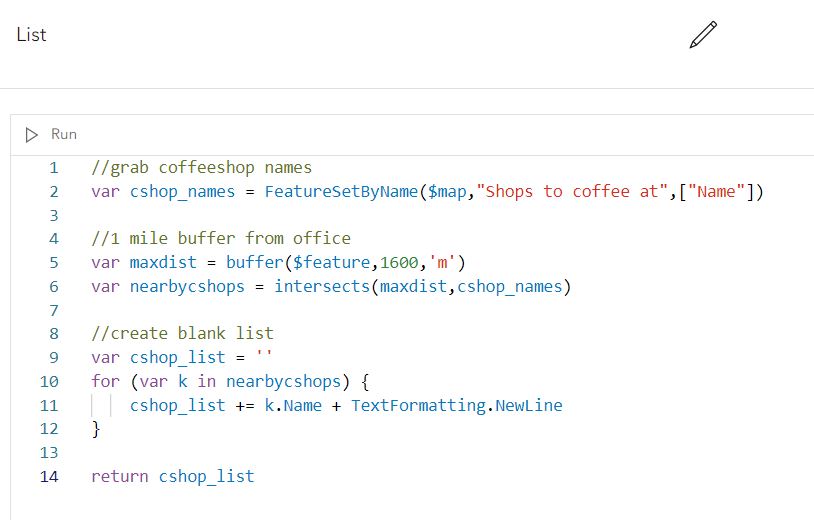
Sample code relating multiple layers to one another
Keep in mind that with on-the-fly calculations, it depends upon network speed and the device you’re using. As datasets increase in size, think 250,000+ points, there may be a negative impact on performance.
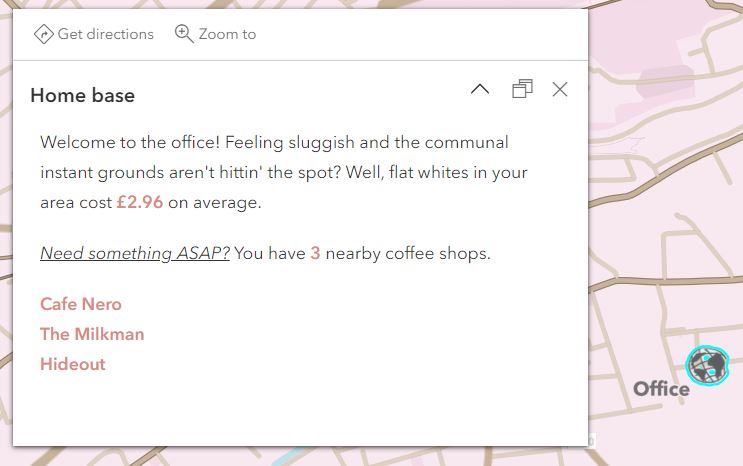
The final Office pop-up in question
Troubleshoot
My Arcade expressions did not always pan out after the first Run. Fortunately, Arcade has built-in troubleshooting tools. Problematic lines will have a red bar on the right side of the editor window, and the code in question will be underlined with red squiggles. Hovering over the squiggles supplies more context about the error.
Arcade’s problem identifying tools in action. Look at it go
The Output tab also specifies where the issue is, saving you from having to comb through your script for misspellings and rogue punctuation. Arcade also has auto-populated code suggestions based on your data and keyboard shortcuts to streamline your scripting.
Debrief
So, what have we done? Besides having a blast, this Arcade journey has highlighted several of its core functionalities:
- customisation, both with label settings, colour choices and pop-up configurations
- spatial analysis that relates different feature layers
- on-the-fly calculations including statistical operations
I won’t lie, I was a bit intimidated by Arcade and did have moments of blindly and haphazardly plonking code into the window. I am still struggling up the learning curve, however, the challenge is well worth the effort – as Arcade unlocks opportunities to enhance your map’s content and style. Besides, knowing I had copious resources to lean on when I got stuck made me feel far more comfortable.
Like with any skill, it takes time to learn and develop. Cut yourself some slack and go have fun with Arcade. Maybe you’ll end up with a cartographic confectionery like this one, or maybe you’ll end up with something equally brilliant. Happy coding 😊
A glimpse into all you can do with Arcade, and a commitment to monochrome…
Bonus Content
If you’ve made it this far and are ready to launch your own Arcade expressions, why not take inspiration from our creative team at Esri UK?
Final note: Thank you to the Arcade queen herself, Carmel. The myth, the legend, the ever-patient colleague who let me ask her countless questions. You rock.