After seeing John Nelson’s Storybook design, I really wanted to give it a try. I thought that this design would be great for educational resources, so I got in contact with our Education Team at Esri UK to see what potential applications it had. We decided to redesign the UK Rivers Atlas with the storybook design to turn it into a resource for primary schools. This is how the story started – of getting inspired by a great cartographer and creating my own project.
ArcGIS Pro
The storybook design was initially created in ArcGIS Pro – it worked well and looked amazing. But here is where I had to start rethinking some of my approach.
At first, I decided to mute the other countries of the world, to put the focus on the UK only. This looked great from a cartographic point of view, however, after discussing this with my colleagues I undid this because the students may ask why the rest of the world looks different compared to the UK. I quickly figured out that cartography aimed at children needs to be handled slightly different compared to maps shown to adults.
Know your audience
When mapping for children, I think it is important to choose your colours such that they match reality (e.g. when mapping rivers, make them blue). Having representative colours means that students can easily understand what the map is showing.
Another point to keep in mind is that children have questioning minds. So, when you create your map try asking yourself questions about everything – why did you choose this colour or symbol, or why is it different to the rest of your map. This will help you address any areas of confusion that students may have before they arise.
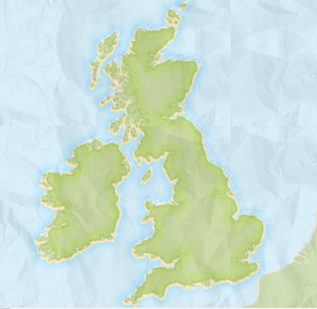
The beginning of our storybook design.
After discussing how we want to bring the resource to the classroom it was decided that an app should be created in ArcGIS Online, which led to the next challenge – pushing the map created in ArcGIS Pro into my ArcGIS Online content.
ArcGIS Online
While you can export the design from ArcGIS Pro directly into ArcGIS Online, some elements from ArcGIS Pro aren’t directly transferable. As you can see below the drawing order of the layers within my symbology got confused. This caused my wave effects around the coastline to appear on top of the land – which is not what I wanted. This is why I decided to remake my map entirely in ArcGIS Map Viewer.
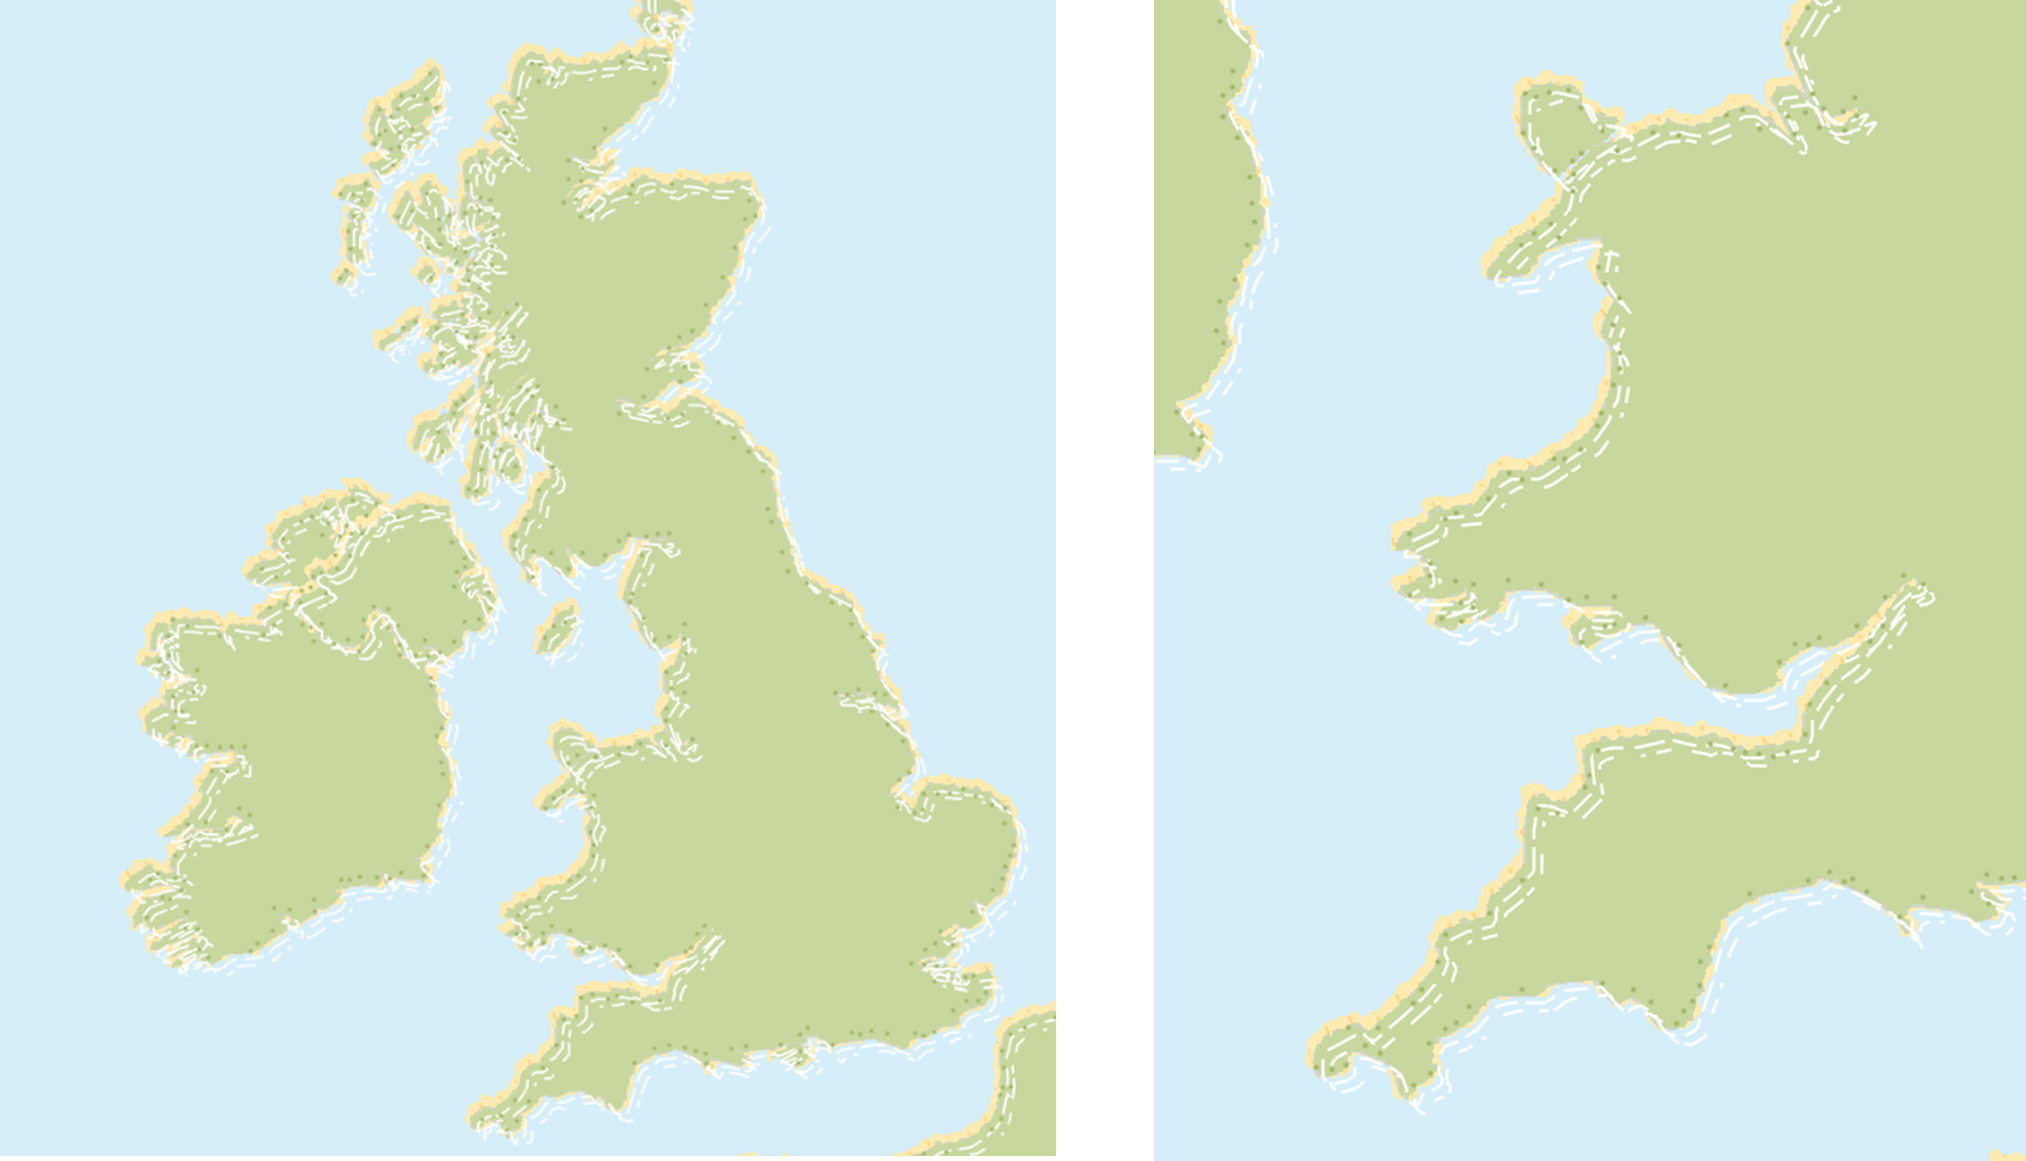
The distorted wave effect.
ArcGIS Map Viewer
Re-creating the storybook design was fairly straightforward. I coloured the country in green, used the Drop shadow effect to get the coastlines, and for the waves in the ocean I added the World Countries (Generalized) layer from the Living Atlas and created a buffer around it. It might not be as detailed as the ArcGIS Pro version was, but overall it still gives you the same feel. This was really great to see from my point of view, because it showed me that it doesn’t matter where a map has been created initially – you can always find a way to recreate a design. Whether you go from ArcGIS Online to ArcGIS Pro or vice versa, there is quite likely a way that you can recreate your design, you might just need to think outside the box.
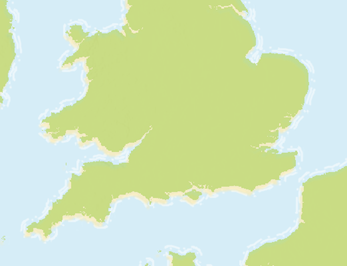
The new storybook design in ArcGIS Online’s Map Viewer
Creating resources for different age groups
Since I wasn’t sure what would be the best way to present the app, I decided to create several and see where it took me. This led to having created three apps, suitable for different age groups.
Instant Apps – Media Map
For our youngest students I created an Instant App using the Media Map template. The students can have fun exploring the map using different widgets like a magnifier as well as a slider. The slider allows them to see and understand where catchments are and that the rivers are within different catchments. This app allows students to get their first contact with GIS and to have fun exploring without getting overwhelmed by a data overload or a lot of labels. You can try out the app here.
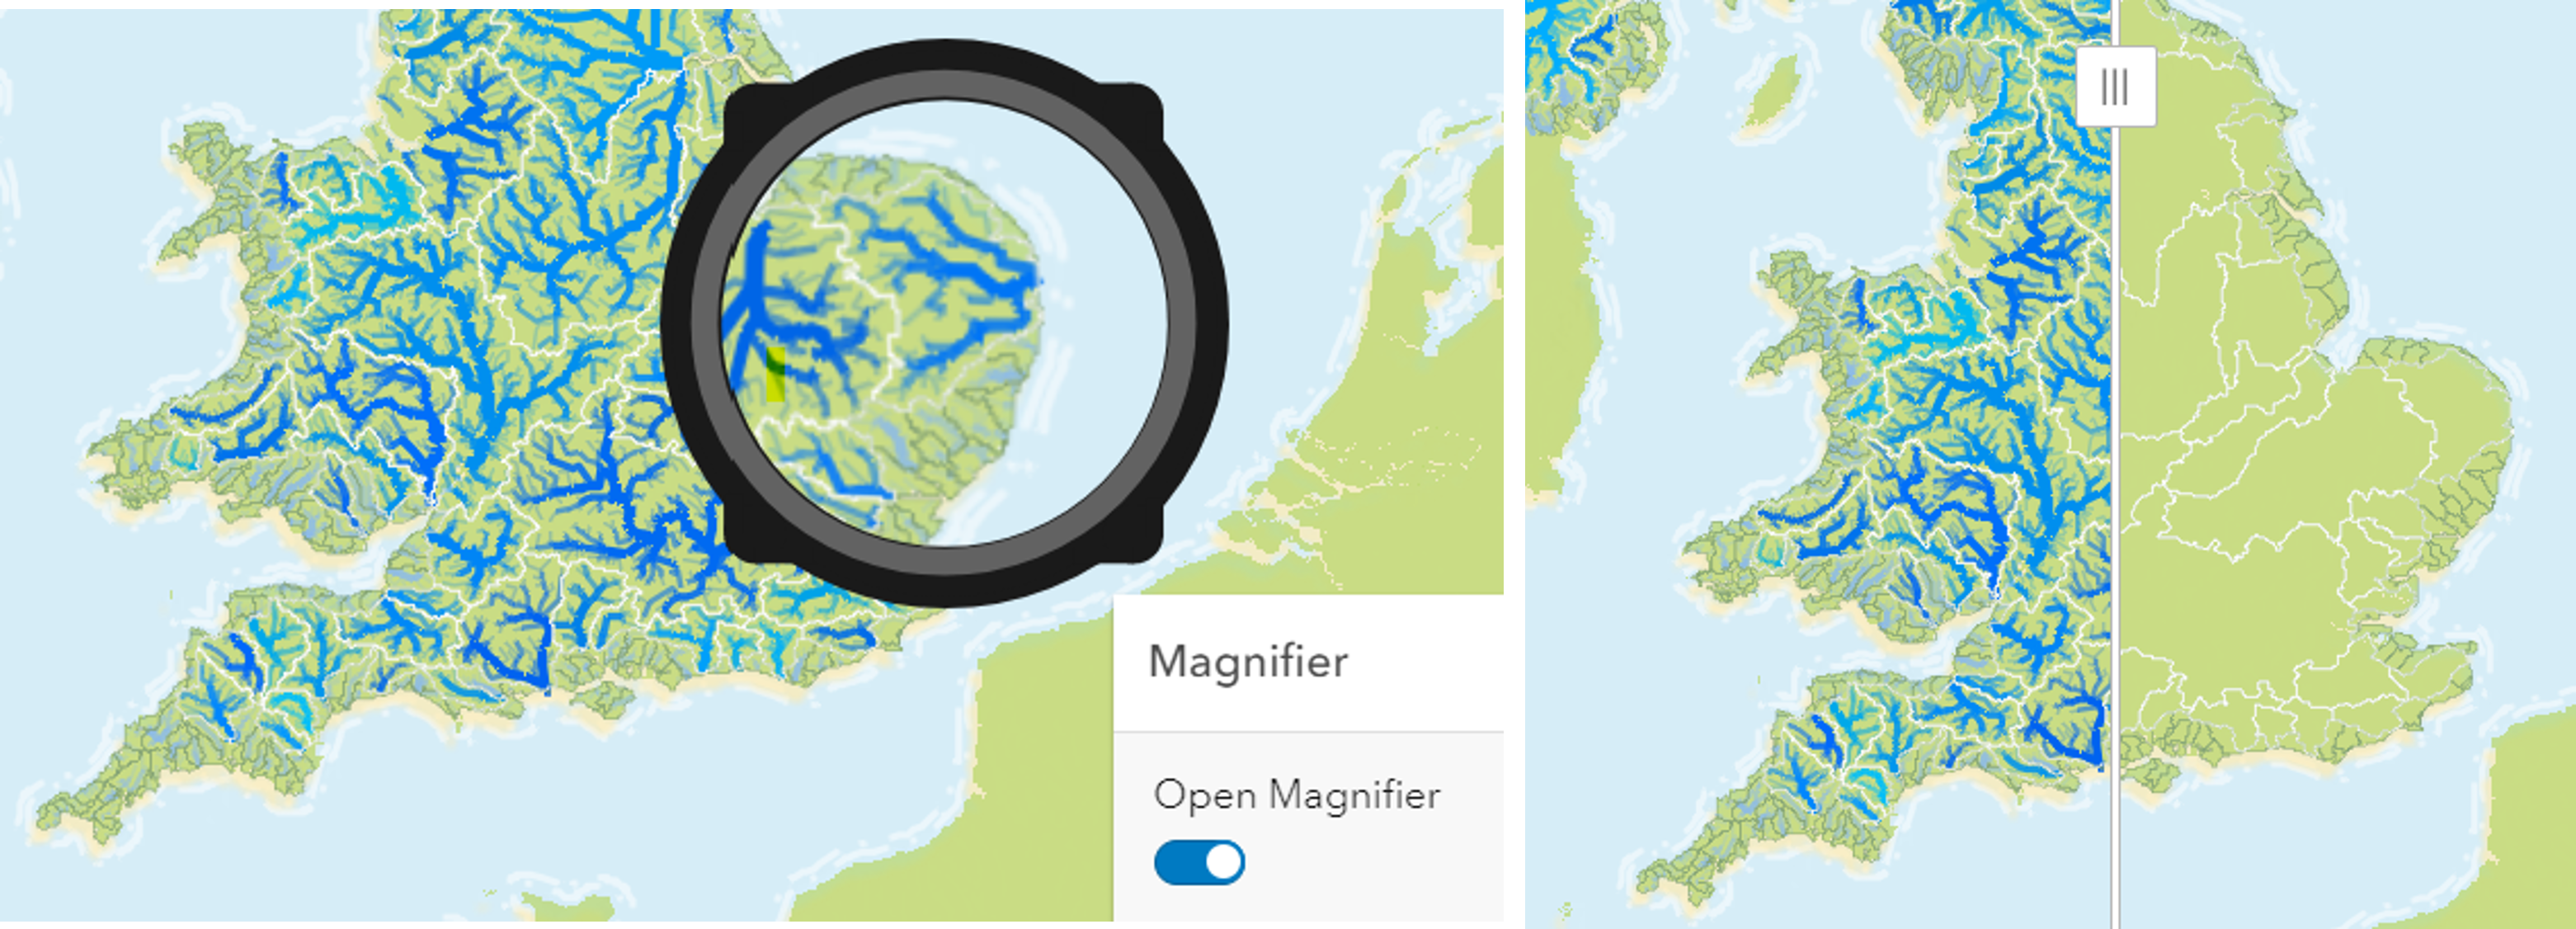
Magnifier widget (left) and Slider (right)
Instant Apps – Nearby
For students that are a bit older, I created an Instant App using the Nearby template. With this the students can search for a location, like the city they live in, or maybe a town they recently visited. By searching the location, a pin will drop on the map, and the catchment will be highlighted slightly. Further, additional information that has been passed into Pop-Ups within ArcGIS Map Viewer are displayed. This allows the students to learn which catchment the rivers are in, while also introducing them to some more capabilities with GIS.
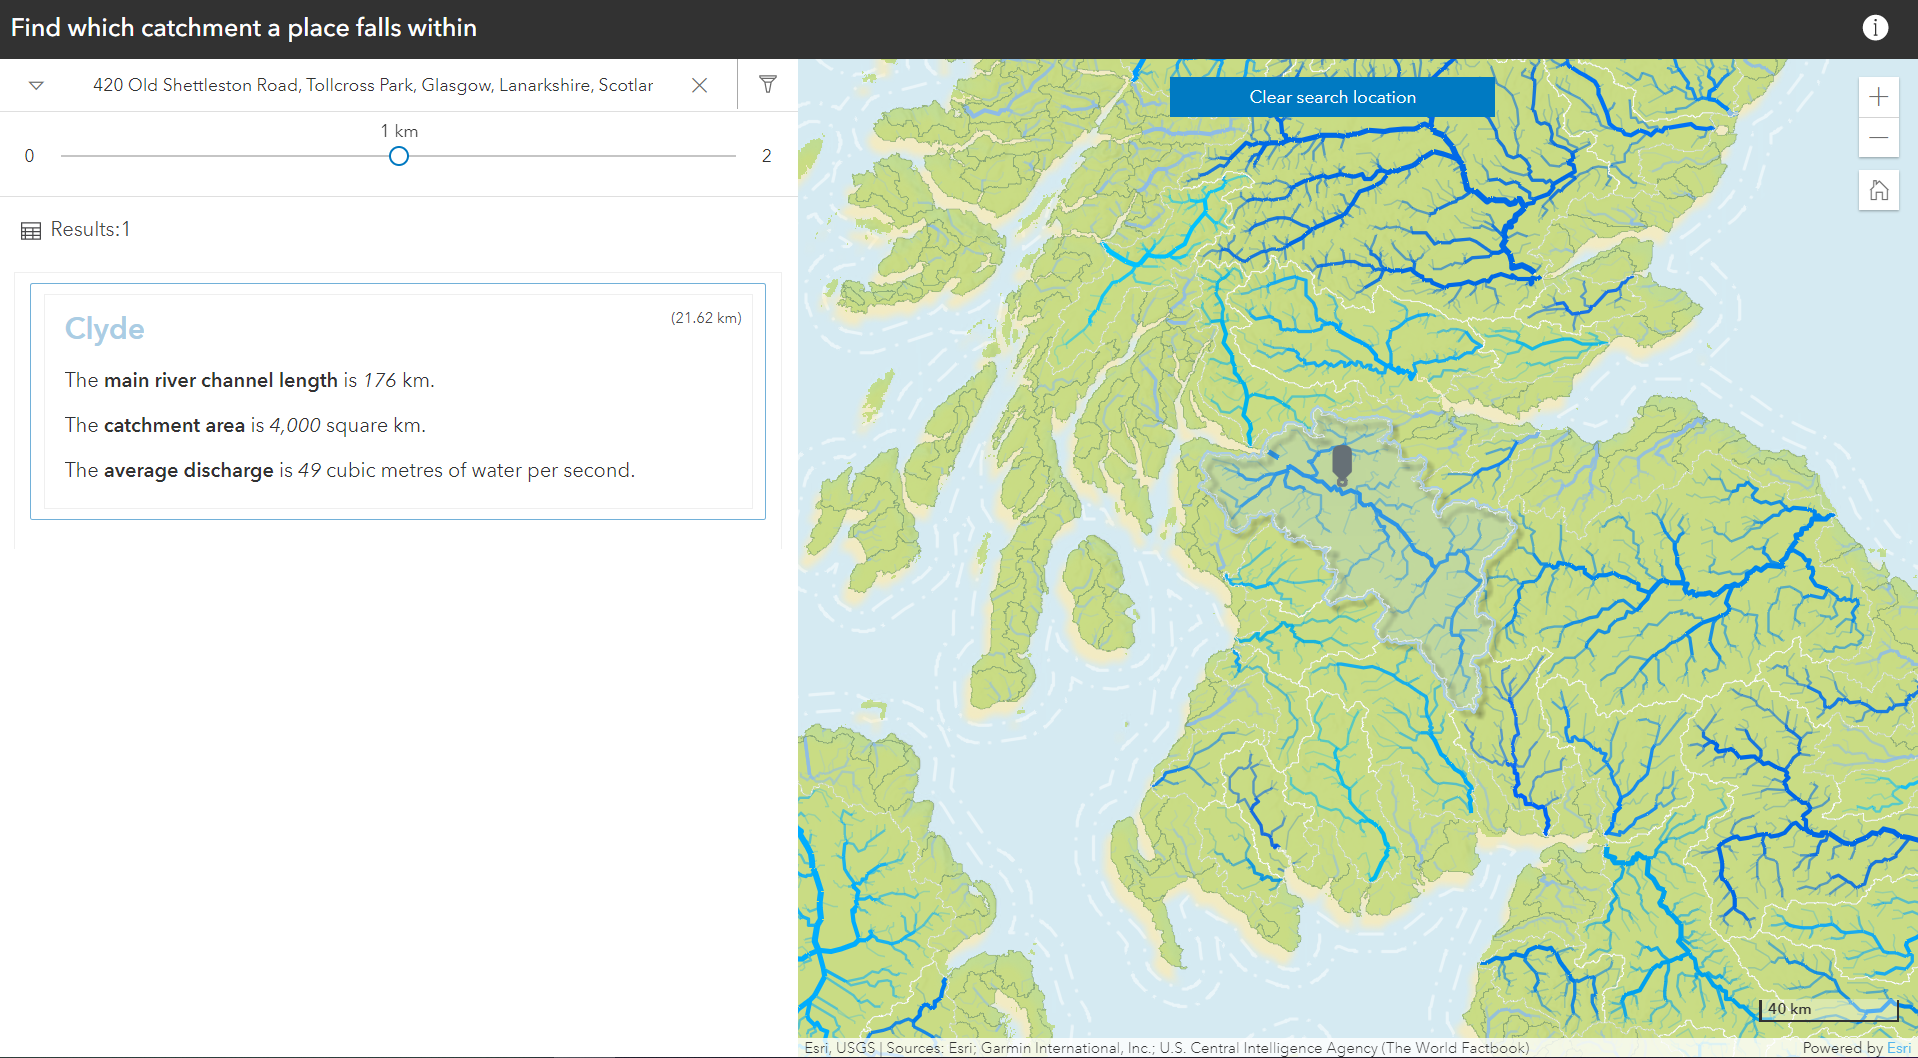
The Nearby Template in Instant Apps, ncluding a panel for the different catchments and information about them.
ArcGIS Dashboard
The third and last version of the map I created is an ArcGIS Dashboard. This map can be used in various ways. Students can use it to explore the catchments and select them on the map directly to get additional information through the pop-up. Teachers could use this resource for an interactive lesson. They could ask students to show a specific catchment on the map (either on the Dashboard or a printed out version). By selecting the specific catchment from the list it is easy to check whether the student’s guess is correct or not. Selecting the catchment from the list highlights the catchment and provides further information in the pop up, so the class can learn more about each catchment of interest.
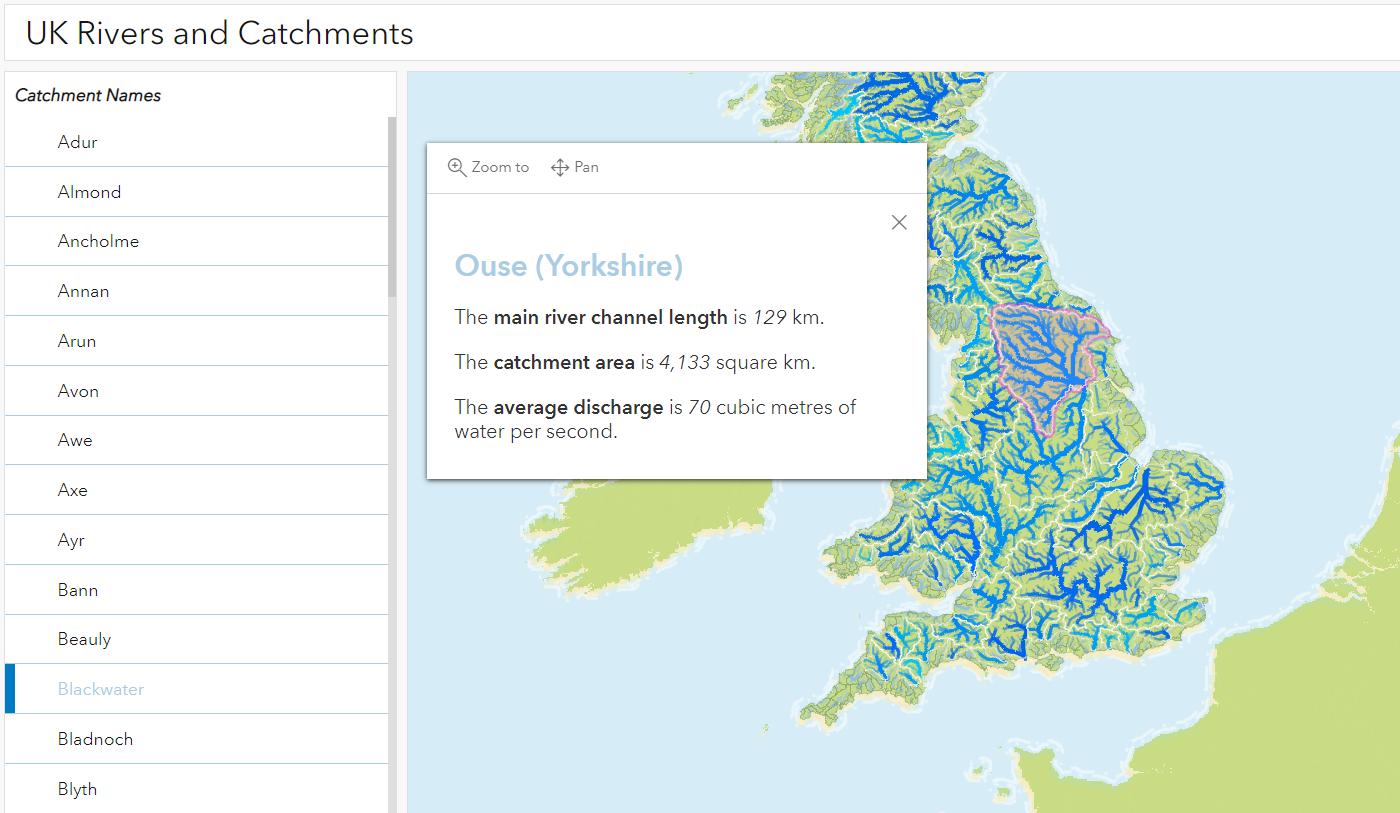
ArcGIS Dashboard of river catchments, complete with automatic pop-ups for added detail.
Final thoughts
I think this project has shown that we can take inspiration from other cartographers and build our own ideas on top of it. Recreating designs in other apps is a great way to learn more about the software as well as improving problem solving skills since things might not always work out right away. Moreover, it shows that once you created a map, you can take it in various directions by bringing it into different apps and changing it for your target audience.