GIS and Data Science haven’t always been well-integrated. But why choose one or the other? With the R-ArcGIS bridge, you don’t have to. The two-way bridge allows you to work easily between the two software packages, harnessing the power of both.
For example, you could view and edit your data in ArcGIS Pro, open that same data in R to perform detailed statistical analysis, then send it back to Pro to produce a finished map. You can then share it with your organisation via ArcGIS Online (or ArcGIS Enterprise) to allow them to explore your results.
Start by installing and setting up the Bridge, if you haven’t already. Next, let’s take a look at some examples of it in action:
Access Spatial Data Directly in R
If you’re a die-hard R user, get direct access to your organisation’s GIS data without needing to open any ArcGIS software yourself. As long as you have ArcGIS Pro or ArcMap installed, then shapefiles, feature classes and raster datasets can be directly accessed in R using the arc.open function, even if they’re held in file geodatabases.
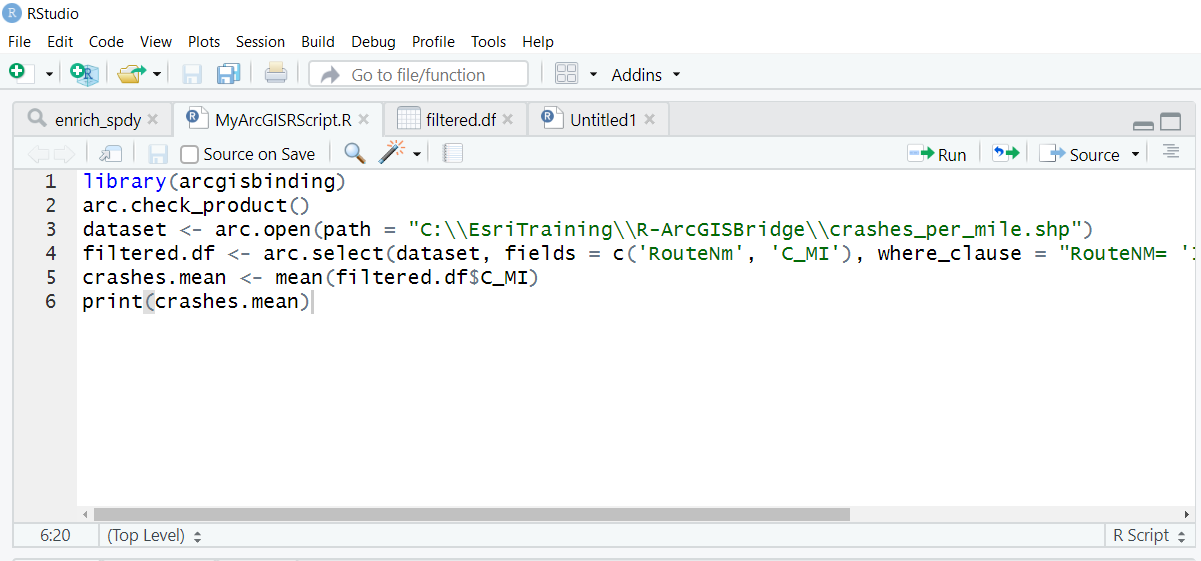
IMPORTING A SHAPEFILE INTO R USING ARC.OPEN, THEN PERFORMING SIMPLE ANALYSIS
If you don’t have ArcGIS software installed, you can still use shapefiles exported from ArcMap/ArcGIS Pro or ArcGIS Online in your R analysis.
Push Results from R into ArcGIS Pro and Beyond
R can produce complex and interesting pieces of statistical analysis, beyond what ArcGIS Pro is capable of. But how do you make the most of your results? While R can be used to create static charts and maps, why not take advantage of the sharing capabilities of ArcGIS to give your audience interactive visualisations of your results. These can then be shared to your wider organisation or even to the public.
The arc.write function can write results from R directly back to your file geodatabase in a GIS-ready format. Open the results in ArcGIS Pro and use the symbology tools to create beautiful visualisations. Then, share your map to ArcGIS Online and create a tailored web application using one of the many ready-to-use templates.
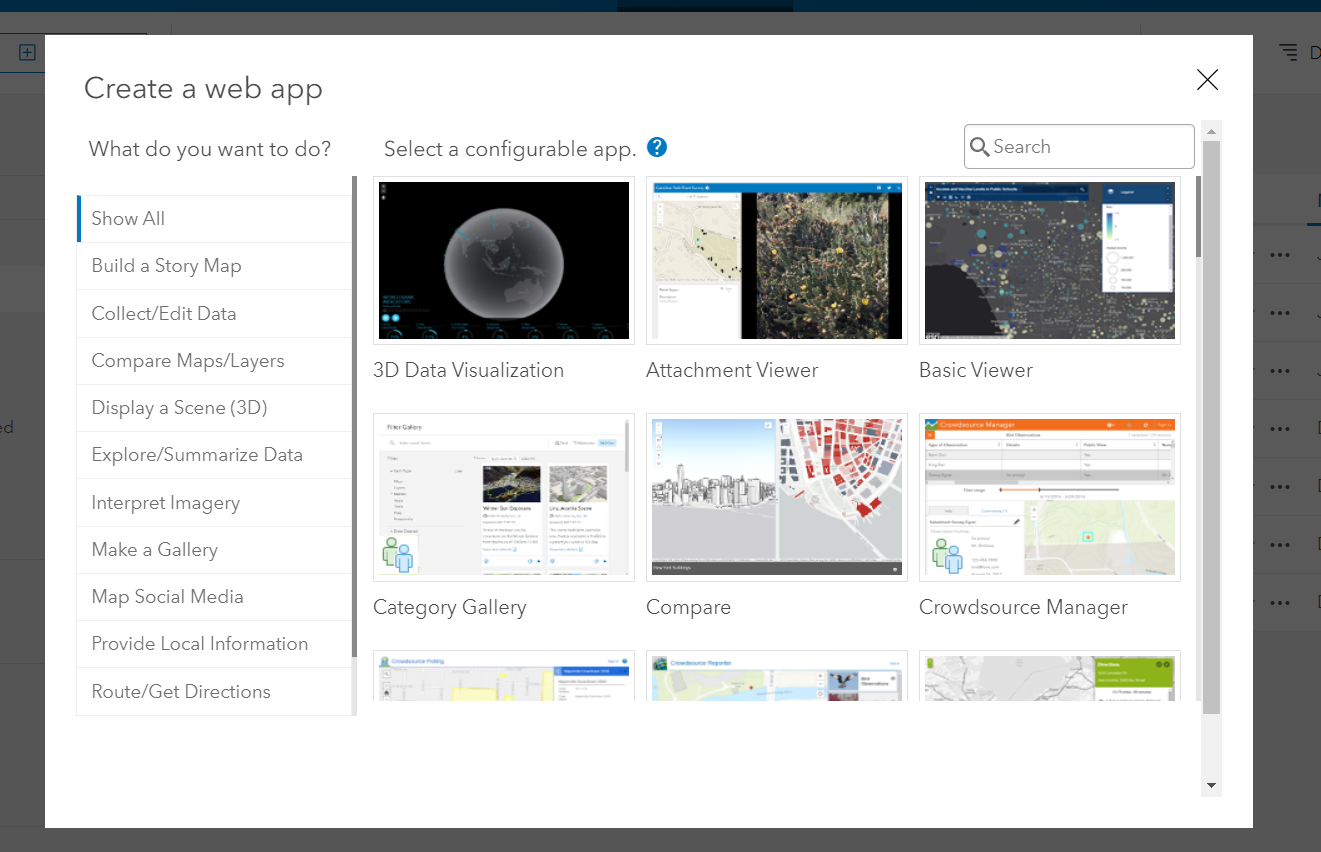
Share your analytical results in an interactive and visually appealing web application that can be accessed anywhere, no web development knowledge required.
Perform R Analysis within ArcGIS Pro
What if you have an R analysis workflow that you need to run regularly on your spatial datasets? GIS and R users can work together to create R scripts which run directly in ArcGIS Pro via a geoprocessing tool. Save time for both teams by allowing GIS users to take R functionality in their hands from within their own familiar software. They can even include the R script in their models.
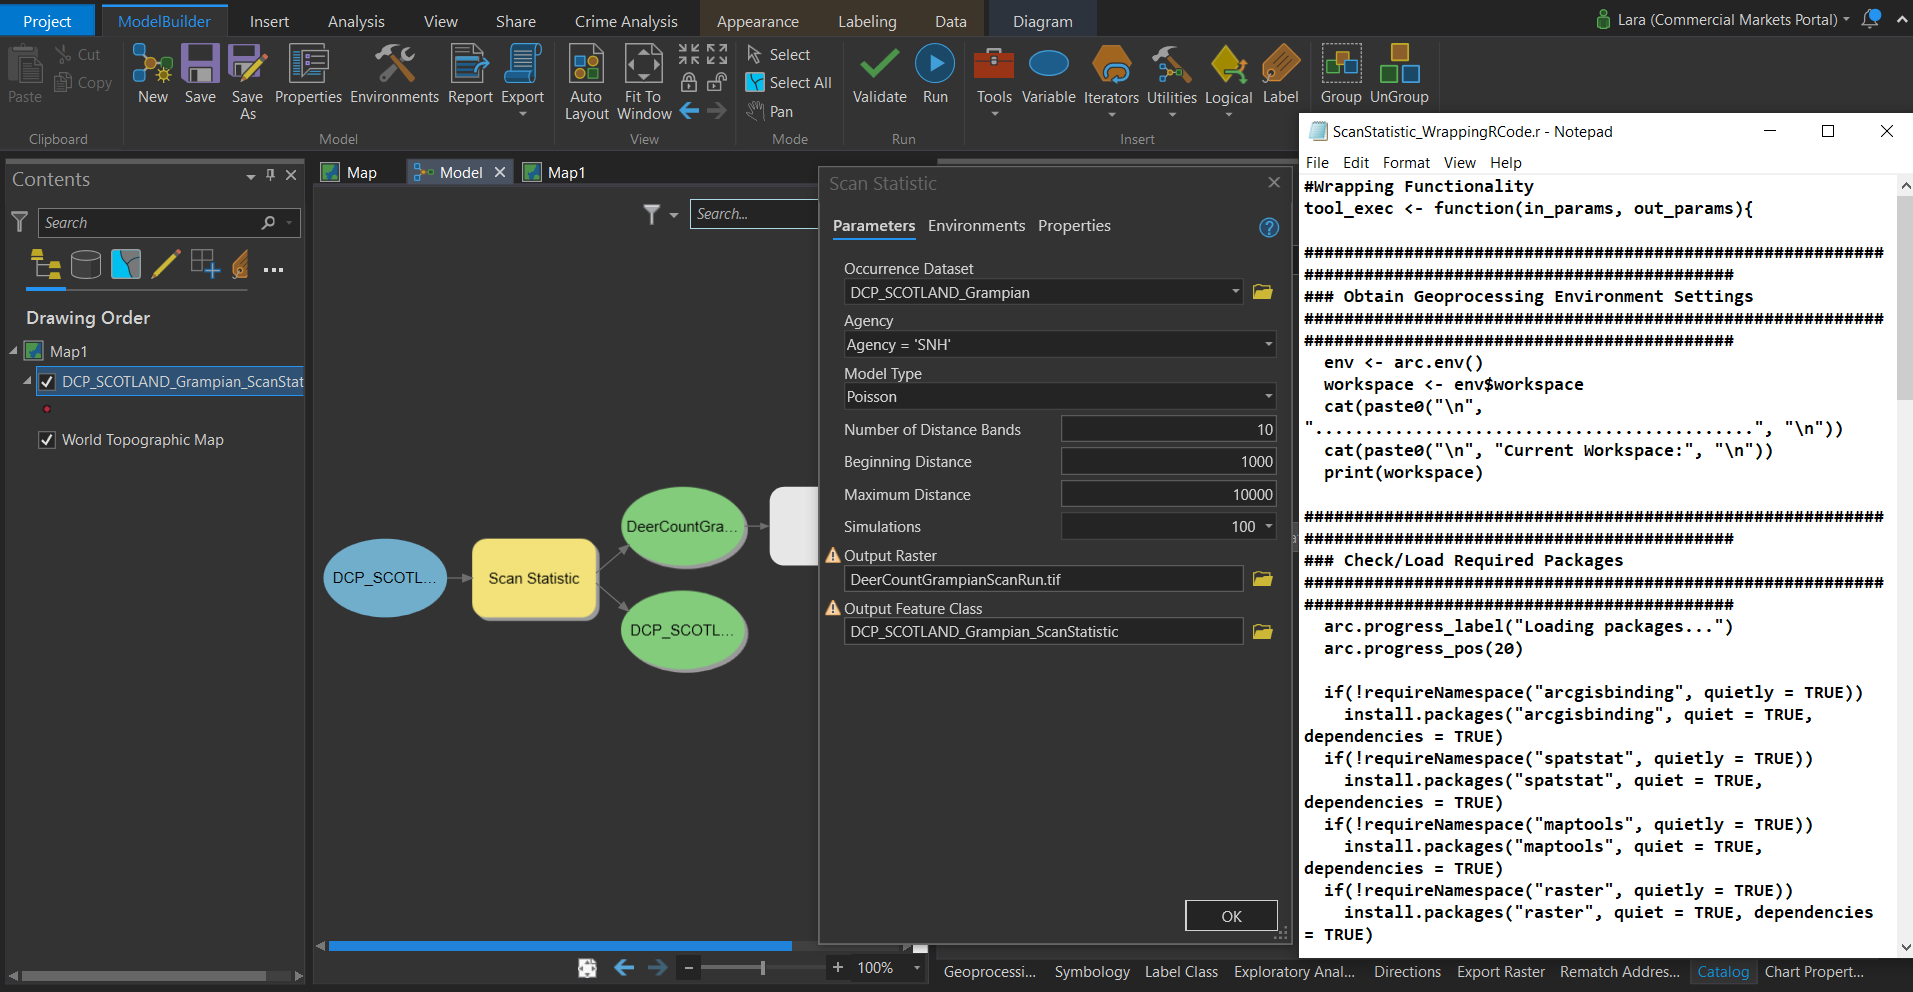
AN ANALYSIS “NESTING DOLL”: AN R SCRIPT, INSIDE A GEOPROCESSING TOOL, INSIDE A MODELBUILDER MODEL
Wrap your R scripts with python to obtain input parameters from the user like any typical geoprocessing tool. This gives your users the ability to customise how the R script runs without them needing any knowledge of R syntax themselves.
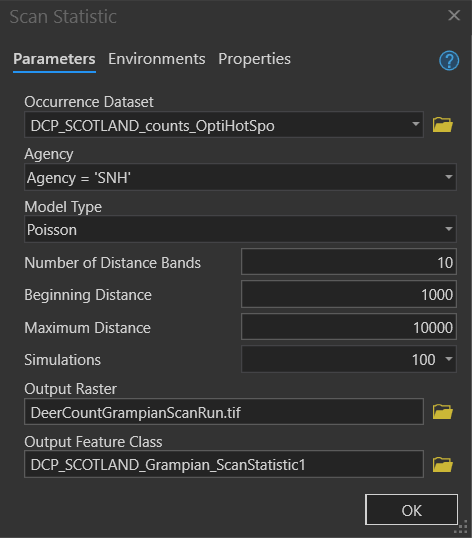
SCAN STATISTICS FROM R AS A GEOPROCESSING TOOL WITH INPUT PARAMETERS
Serve up R Models with a Web AppBuilder Front-End
We talked about presenting the results of your R analysis as a web application. But what about allowing your users to leverage the power of R themselves to perform analysis within a web application? Here’s an example showing how it can be done.
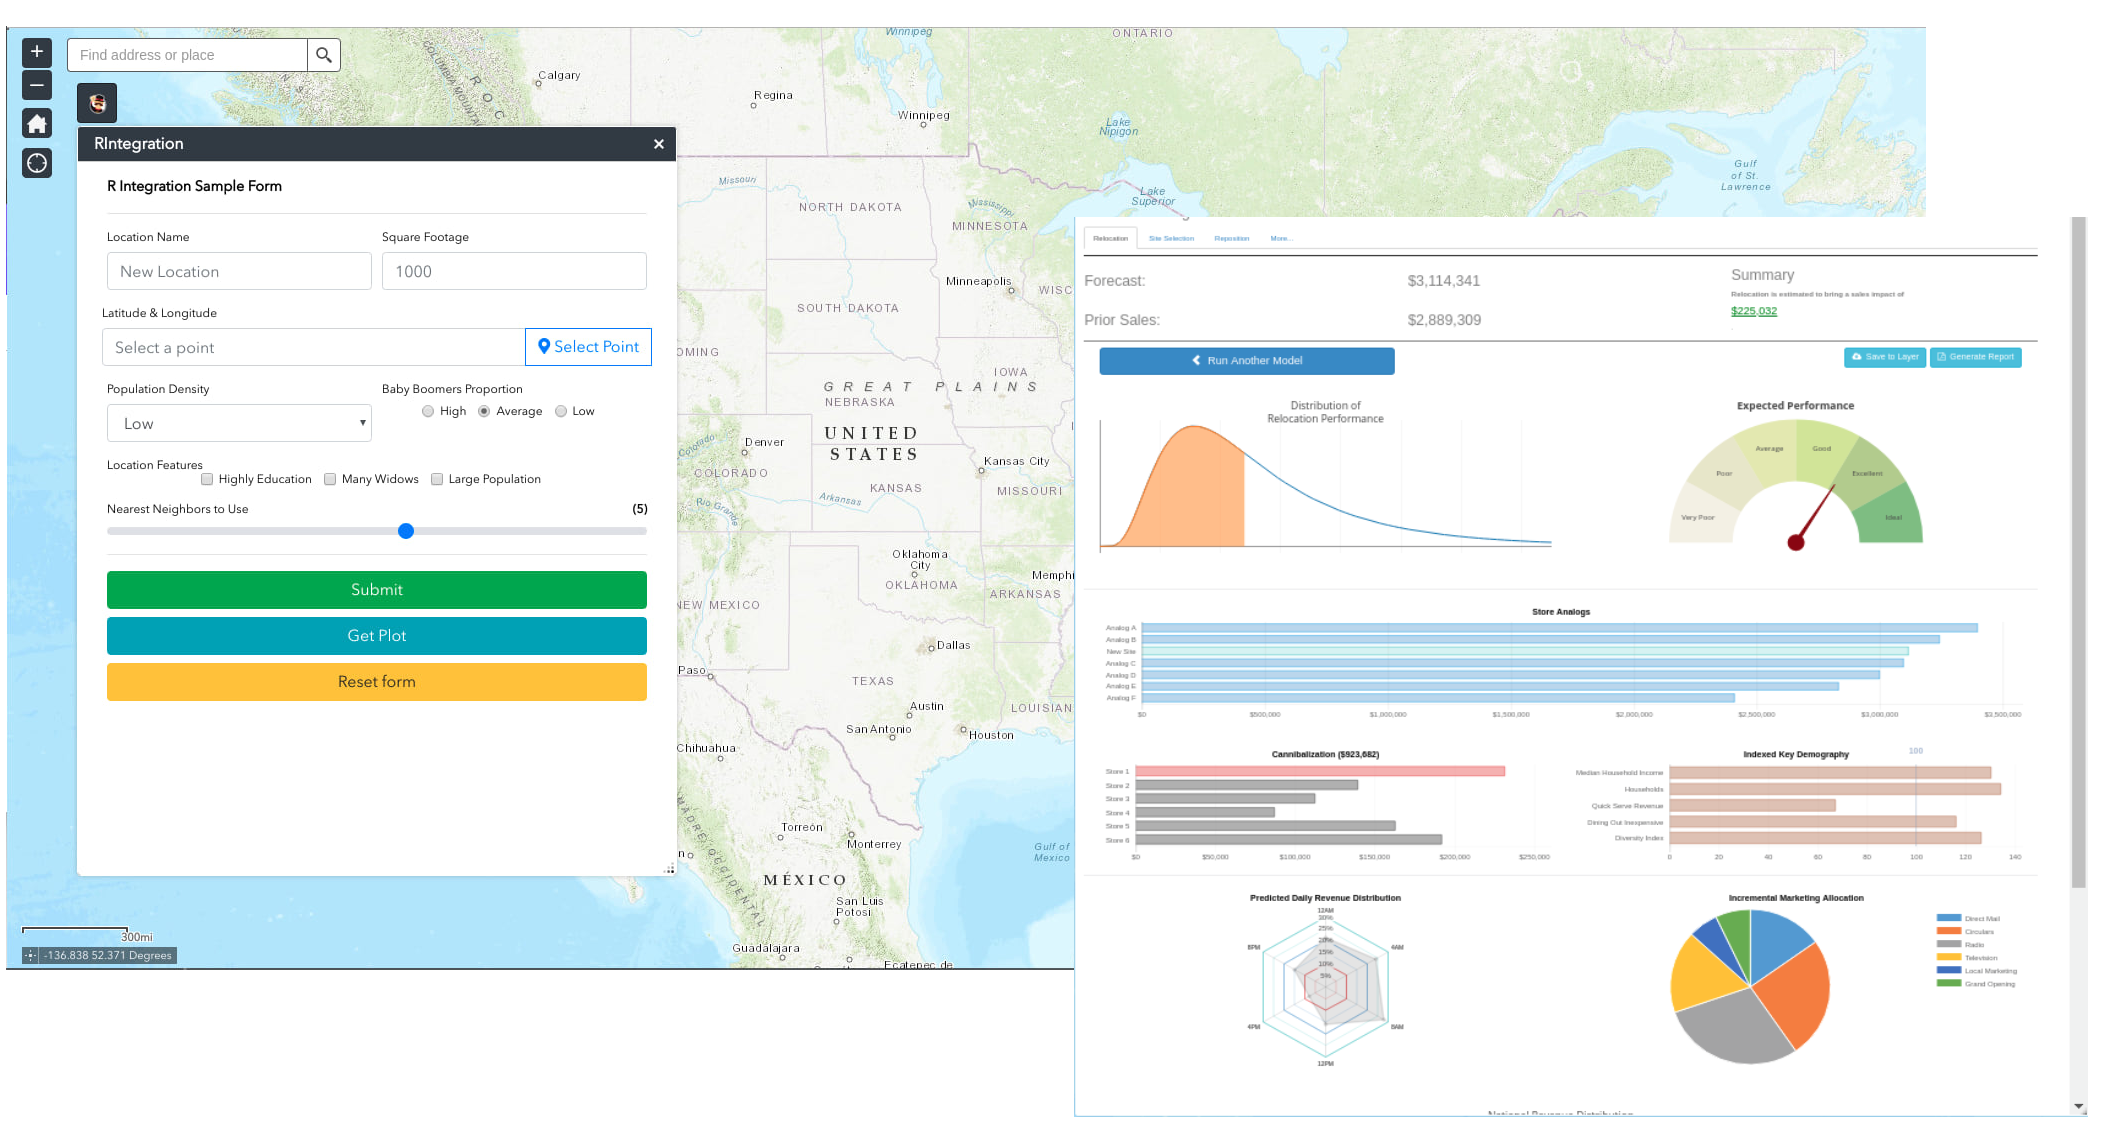
ALLOW YOUR USERS TO RUN R MODELS FROM WITHIN YOUR WEB APPLICATIONS
While not technically using the R-ArcGIS Bridge, this is yet another way to integrate ArcGIS and R using ArcGIS Enterprise. By using the ArcGIS APIs you can give your non-technical users the ability to run your R models in a user-friendly, spatially-enabled interface.
Feeling inspired? Have a go at analysing San Francisco crime stats or find a new habitat for African Buffalo in a couple of our R-ArcGIS bridge tutorials. Or, share this article with your colleagues who use R and see what other ideas you can come up with.