Kenneth Field wrote a compelling blog where he explored how different cartographic approaches to data can skew the output in ArcGIS Pro. But this blog made me wonder, how does ArcGIS Online measure up in comparison? Can the same, or even other techniques, be undertaken in Pro’s online counterpart?
To explore the cartographic tools in ArcGIS Online, I am taking the 2021 Census data for England and Wales that was recently published in Living Atlas and am focusing on the data at the Lower Tier Local Authority (LTLA) level. The data is initially presented in Map Viewer as a standard choropleth map – a clear and functional visual representation of the total population. What other options does ArcGIS Online offer to explore this data?
When navigating to the Styles section I can choose multiple attributes to study, to which Map Viewer will automatically present a range of smart mapping options suited to the data selected. I have chosen the attributes for the male versus the female population of each LTLA and am offered the following options.
Compare A to B
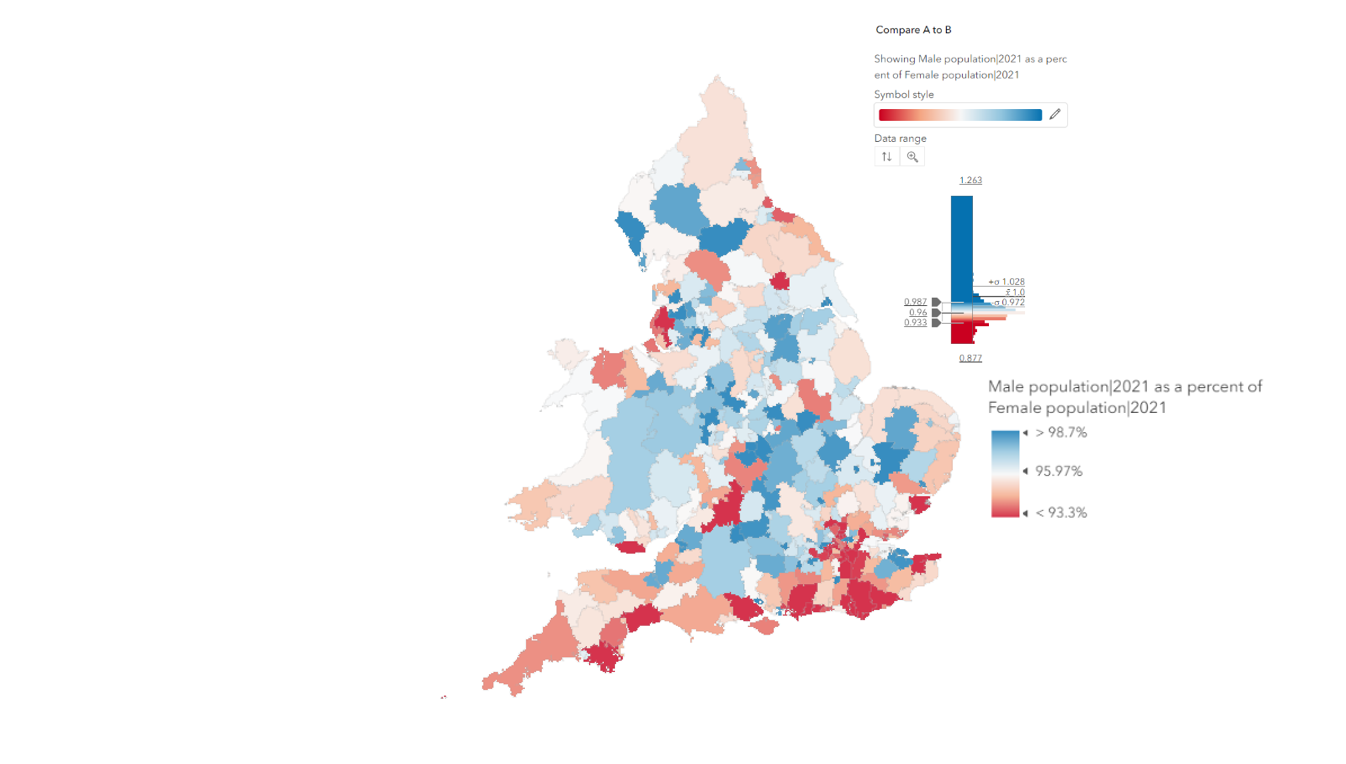
The first Style is Compare A to B which features a graduated colour map of the percentage of the male population to the female population. The clear visuality of this Style immediately reveals the pattern of a higher comparative female population along England’s southern coast. However, this Style could mislead the audience to think that there are no areas of England where the male population is higher. It is only when opening the Style Options that the top value of the range is revealed to be 1.263, meaning there are areas where the number of males exceeds the number of females. Is there a Style that showcases this aspect of the data in a clearer format?
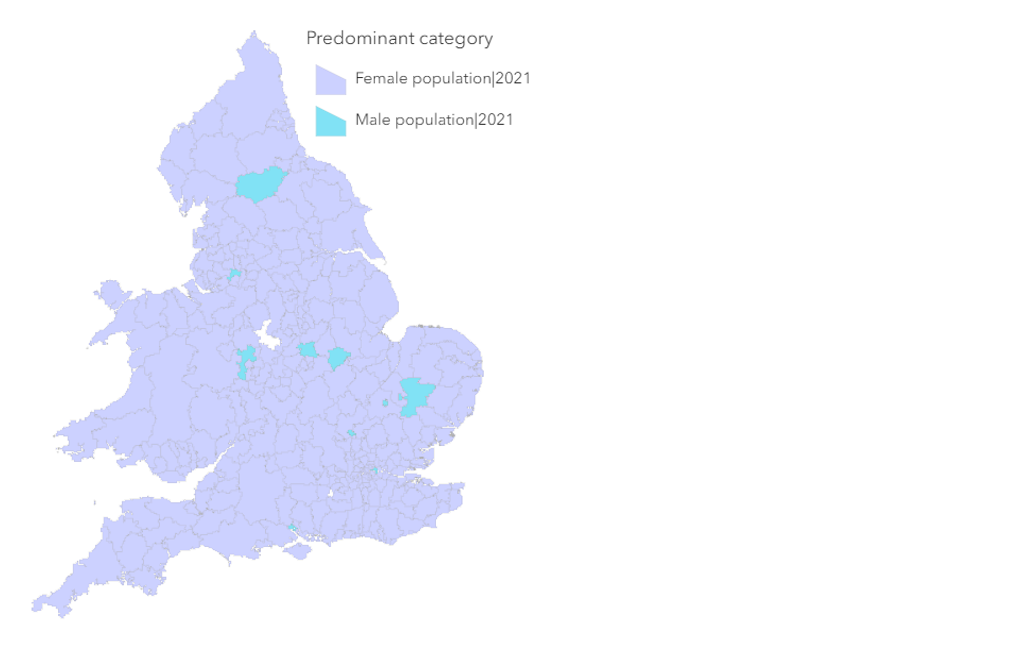
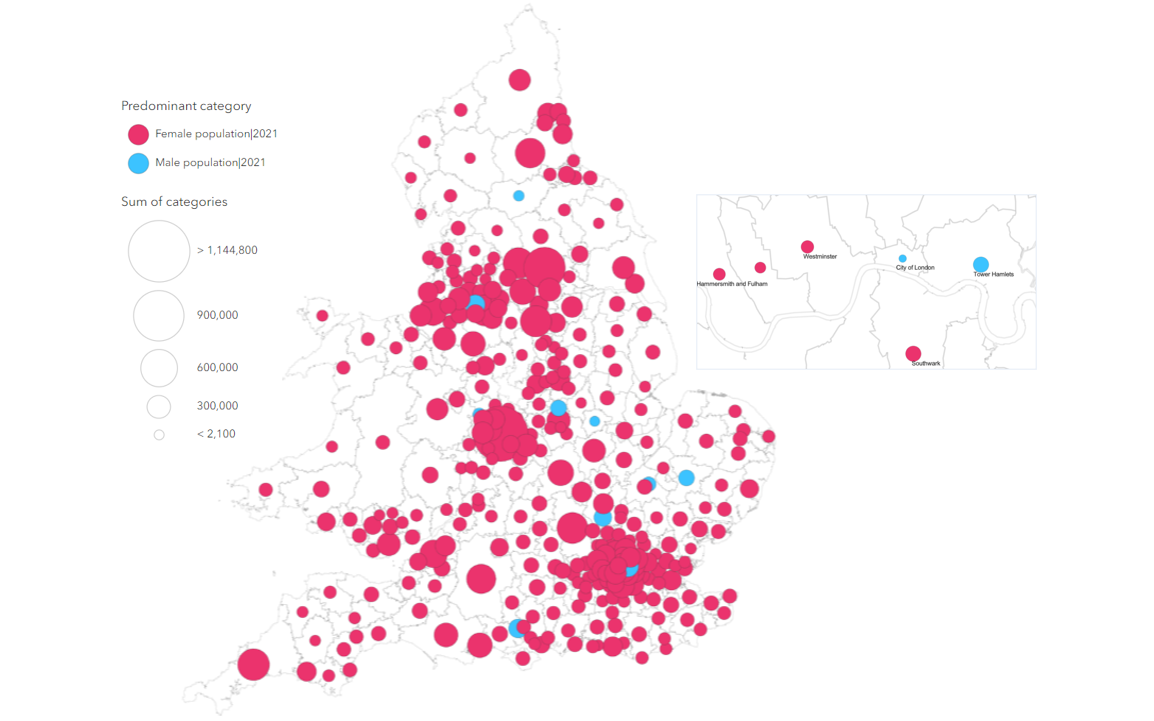
Predominant Category
The binary output of the Predominant Category Style plainly exposes the areas where one gender is more pervasive that the other. Yet, this output gives no indication of by how much one gender overtakes the other.
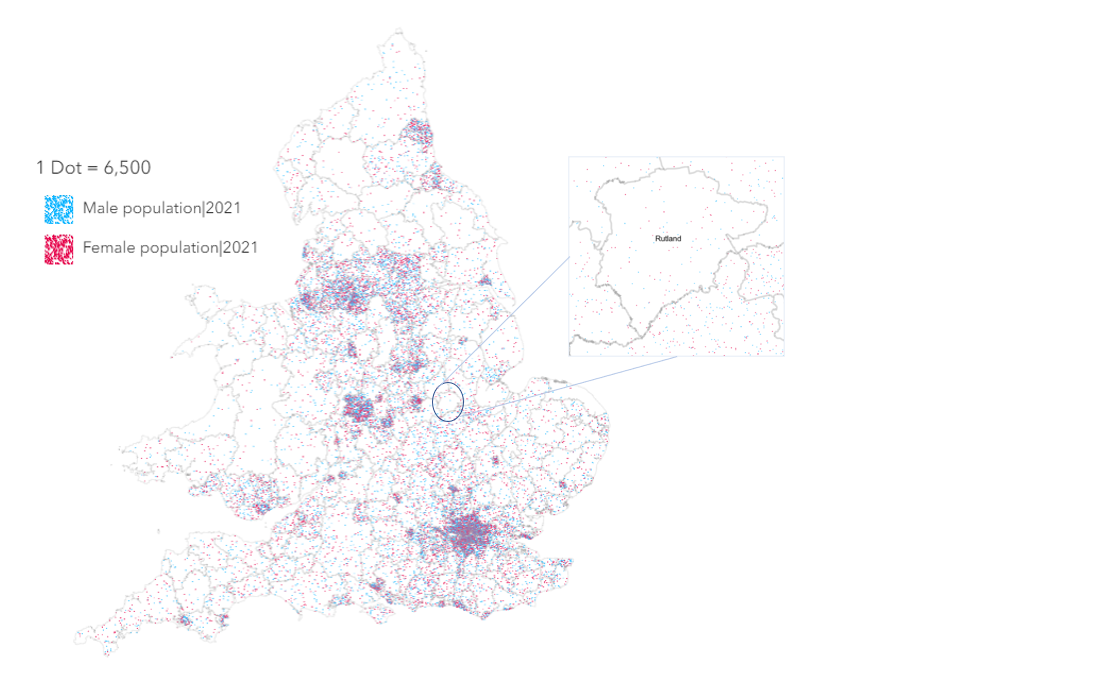
Dot Density
Another option that ArcGIS Online offers is to create Dot Density maps of your chosen attributes. For my attributes of male and female population, this Style is valuable in the way it indicates the actual population of each area. However, when focusing in on an area, such as Rutland, that the Predominant Category map identified as male dominated we can see how the Dot Density Style falls short in effectively communicating this majority in the population. In part, due to a lack of variance in the data to which this Style is not suited.
Charts
When zooming into areas like Central London, the Charts Style provides a clear visual that immediately communicates the majority gender in each area. Yet, it provides no information regarding total population size and at a small scale becomes much harder to interpret.
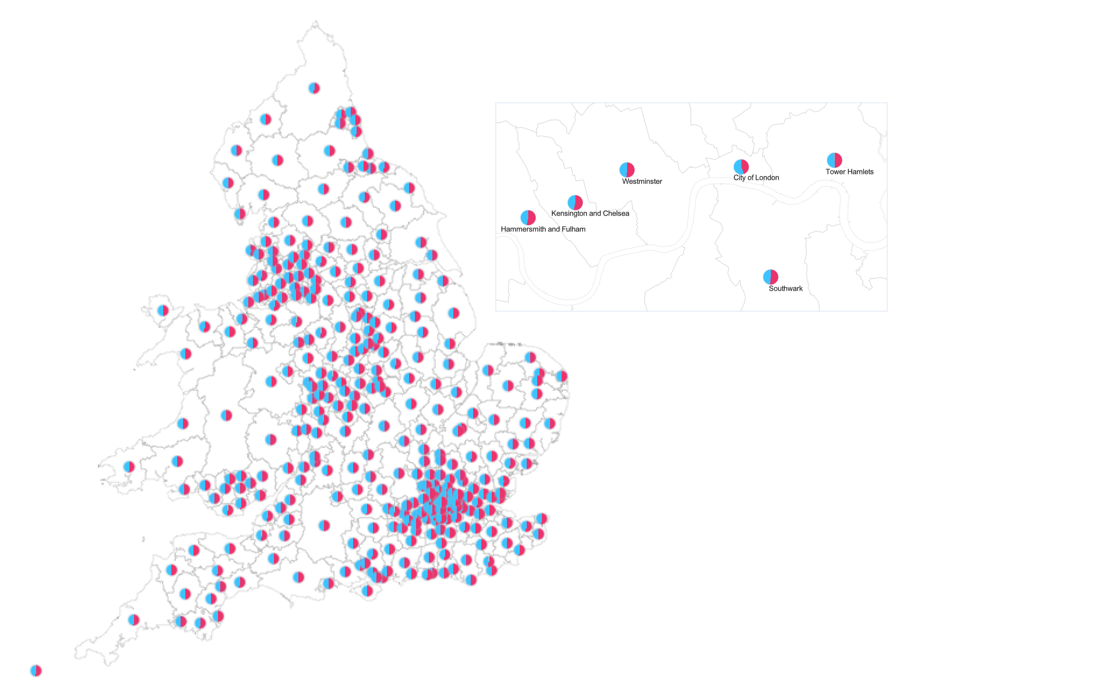
Predominant Category and Size
The Style that best fits this type of data at both a macro and micro scale is the Predominant Category and Size Style. Compared to the previous Charts Style, this presents an easily understandable representation of both the majority gender of each LTLA area and its population. While the overlapping spheres can obscure the data to an extent when viewed at a small scale, the map remains readable and clearly communicates its intended message.
Smart mapping gives you a useful starting point to explore your data but ArcGIS Online offers a multitude of ways to display your data. It is as easy as clicking a button or flicking through Styles. This ability to expedite the cartographic process and produce easily readable maps that can be immediately shared with the wider world is a benefit that should not be overlooked.