The new Maps+ Beta services are now live and available to existing Maps+ subscribers from within the ArcGIS Marketplace (sign in required). In anticipation of this, I took the opportunity to get to know the new arrivals to the Maps+ family.
The beta services are derived from two of the datasets offered in Ordnance Survey’s new National Geographic Database (NGD).
In this blog post I’ll be taking you on my journey investigating what’s in the new Land Use and Geographical Names Beta services: testing out workflows, looking into potential use-cases, and of course creating some maps!
Decode the Landscape with Land Use Data
Land use data is a valuable tool for understanding the interactions between people, the environment, and the economy. By analysing these squares on our geographical quilt, we can make more informed decisions about how to use land resources appropriately.
The OS NGD Land Use Theme contains features that represent areas identified as having a specific function such as schools, shopping centres and caravan parks, and can be used to contextualise and analyse land use.
Taking a look at the OS NGD Land Use feature service, I was immediately impressed with how clear a snapshot of human and economic activity patterns I got with just a few clicks.
Two tiers of information
Using Tier A of the dataset (a high-level description of the main activity that takes place at a location) users can get an insight into the location, extent and number of sites in a region. From this, they are given a better idea of how land use differs across an area e.g., whether it is residential, commercial, greenspace, transport or a medical hub
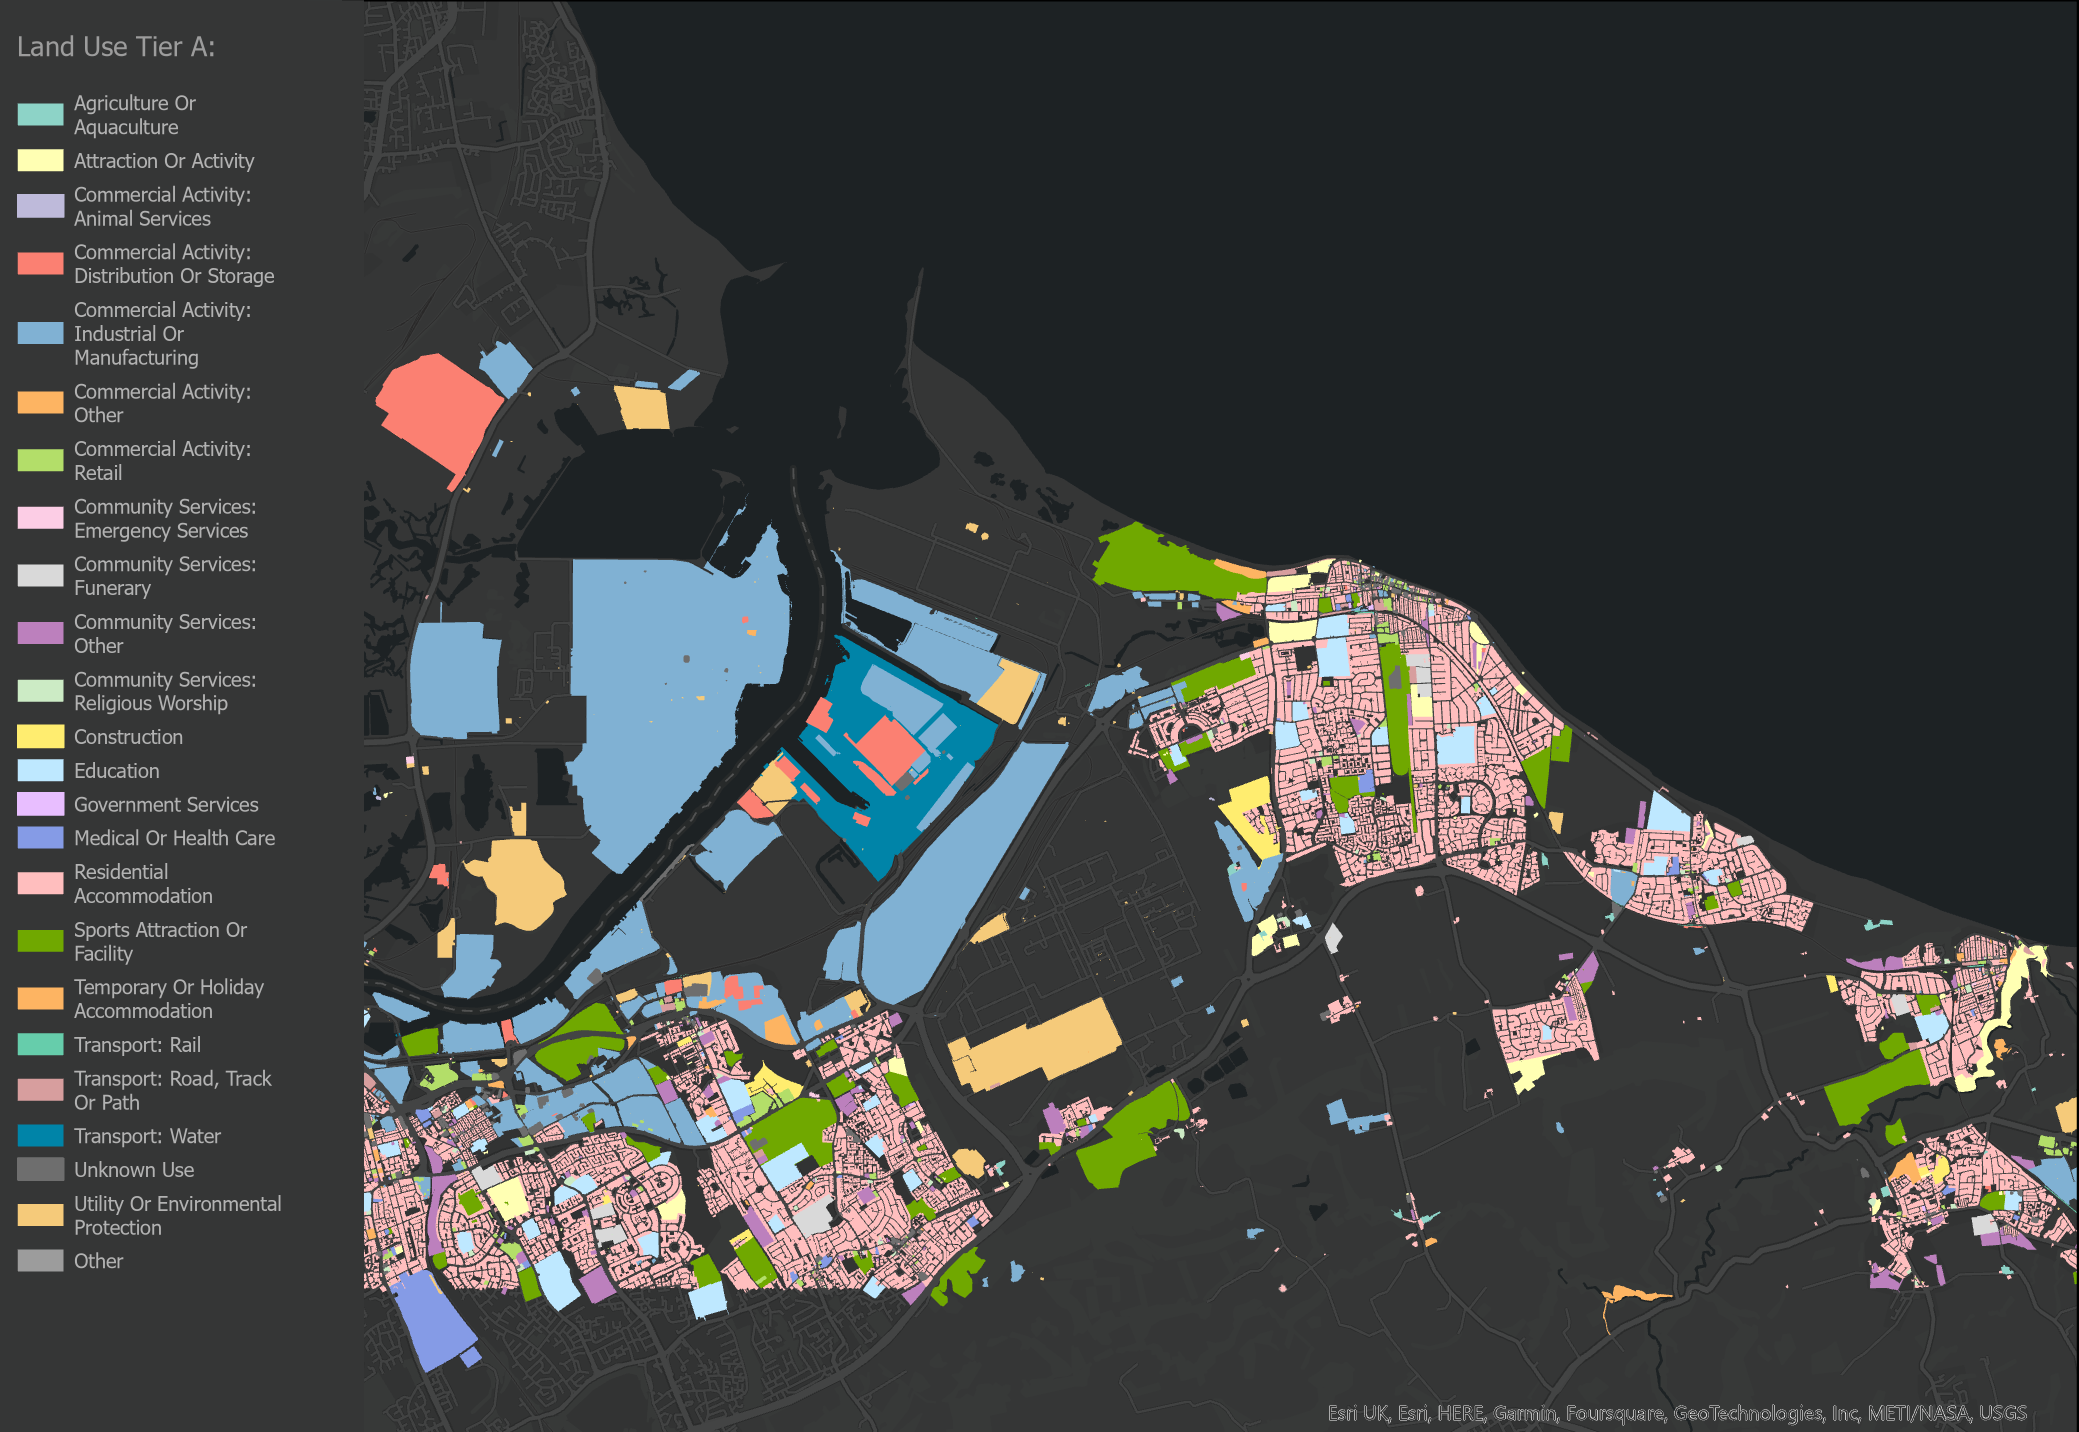 Fig 1: OS NGD Tier A Land Use in Middlesbrough (Small Area).
Note: I found the dataset’s attribute information particularly useful when I wanted to learn a little bit more about a non-residential property – like its name, description or even the parties operating the sites for universities and railway stations.
But what if I require a little more detail in my land-use assessment?
As it turns out, this extra information is provided in the OS Tier B Land Use data. This category provides a bit more depth when describing the type of activity that takes place at a location.
Ever the fair-weather sports enthusiast, I decided test this category out by mapping the break-down of land used for sporting activities in the Greater London area.
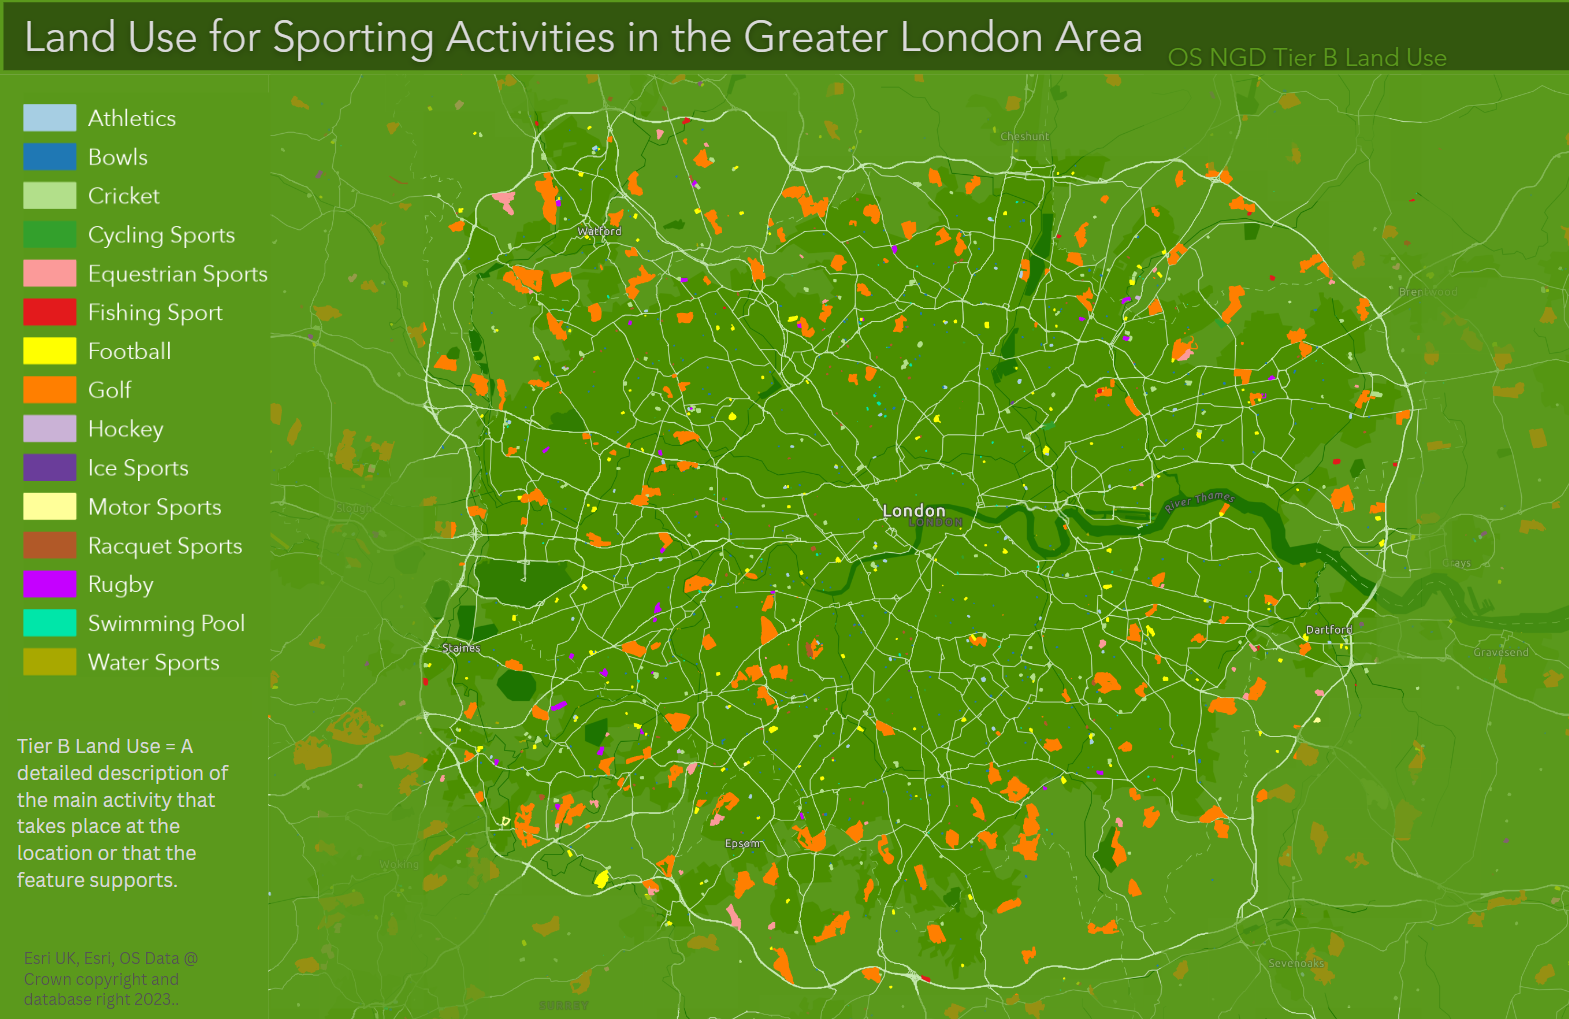
Fig 2: OS NGD Tier B Land Use for Sporting Activities in the Greater London Area.
This example illustrates the patterns across fifteen land use categories (and whole lot of golf courses). Beyond the sporting world, there are over twenty more classes to explore and analyse.
The use cases for this data type span from urban planners identifying areas most in need of additional services, to organisations arranging the placement and expansion of their infrastructure, and even to multi-modal transport planning.
This just scratches the surface of land-use data usability, but hopefully it sparks some inspiration for investigating its use in your own workflows!
Advance your Area Analysis
Assessing land-use patterns is one part of the puzzle of understanding our environments. But how about incorporating land-use data with additional analysis to generate more powerful spatial insights?
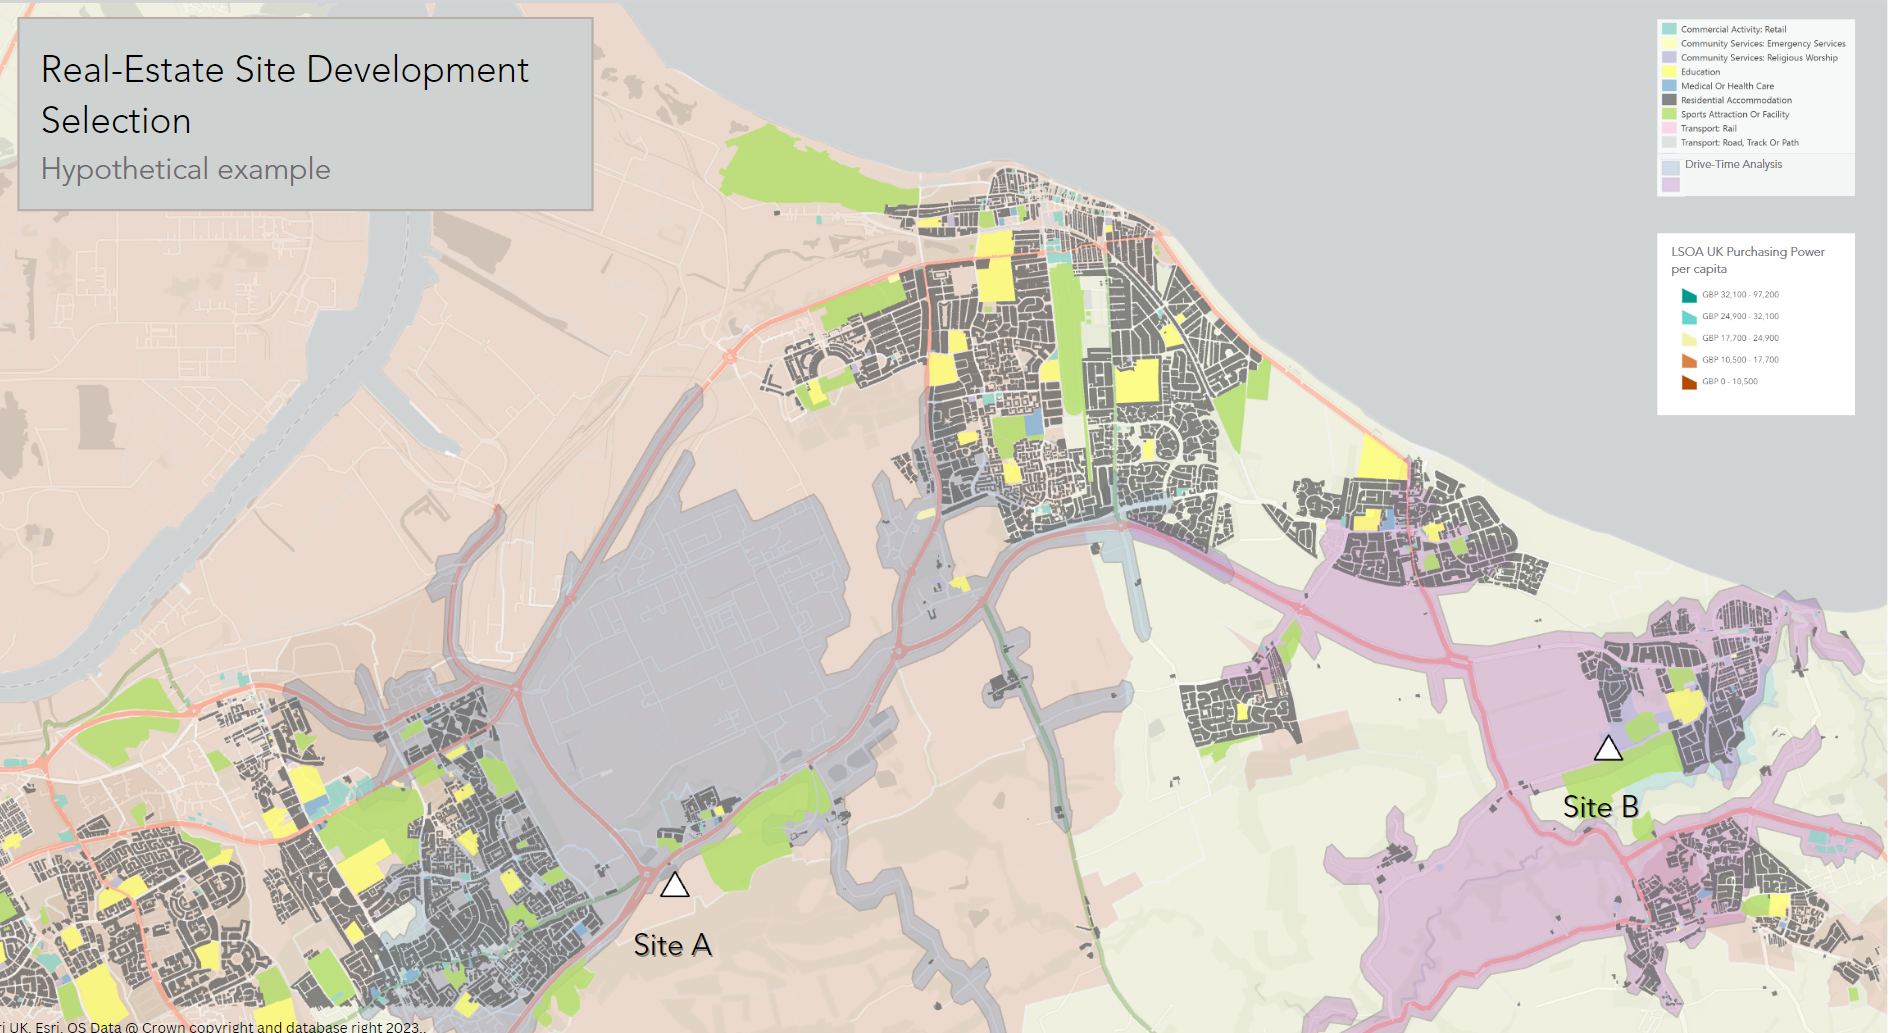
Fig 3: Hypothetical Real-Estate Development Site Selection Analysis.
Taking the example of real-estate development, I used the OS NGD Land Use feature service to analyse land-use patterns and facilitate my decision between two potential development sites: A and B.
I filtered my land use data to show the locations most relevant to potential buyers, existing residences, schools, greenspaces and health services. Adding in Purchasing Power data from ArcGIS Living Atlas of the World gave a better understanding of the neighbourhoods’ level of affluence. I included OS Open Roads data to give an indication of the locations’ connectivity, and lastly, I ran a 5 minute Drive-Time Analysis to see, how many locations of interest for potential buyers fell within the sites’ travel boundaries.
And there you have it – an insightful visualisation to facilitate my decision-making process!
Navigating your Way with Access and Routing
No land parcel is an island and neglecting the connectivity between these features means missing out on some invaluable insights.
The NGD Land Use collection sheds some light on interconnectivity through its inclusion of access and routing points. The Site Access Location feature shows the point at which pedestrians, vehicles or both can enter or exit a site, while the Site Routing Point feature indicates the location on the road network that provides that access.
Fig 4: Exploring pedestrian access points using the OS NGD Land Use service on ArcGIS Pro.
This functionality may be useful for the likes of local authorities and planners to better understand the location of access points to major sites (such as train-stations, schools, and parks), and assess how pedestrian-friendly an area is.
Tip: This can be linked to a premium data offering; OS NGD transport networks to provide additional routing and logistical insights to users.
Gain more from Geographical Names
While digging into land use patterns can unearth revelations about present human activities in an area, geographical names offer an enhanced understanding of a location’s cultural context and past.
The Geographical Names feature service offers a comprehensive list of names of features and places of geographic significance captured by Ordnance Survey. Its use for quick and simple gazetteer searches and accurate labelling is a straight-forward option, but it can also be harnessed to perform some high-level spatial analysis of named features and places.
For instance, environmental organisations could use geographical name datasets to monitor and analyse the distribution and health of natural resources, such as forests, rivers, and seas to help identify areas that require protection.
Additionally, emergency response teams may use a geographical name dataset to quickly locate and identify geographic features, such as hospitals or potential evacuation centres. This can help in coordinating emergency response efforts and evacuating people from affected areas.
One particular aspect of this dataset I particularly enjoyed was the ability to look up places or roads with alternative names as the collection contains place name data in English, Welsh and Scots / Gaelic. 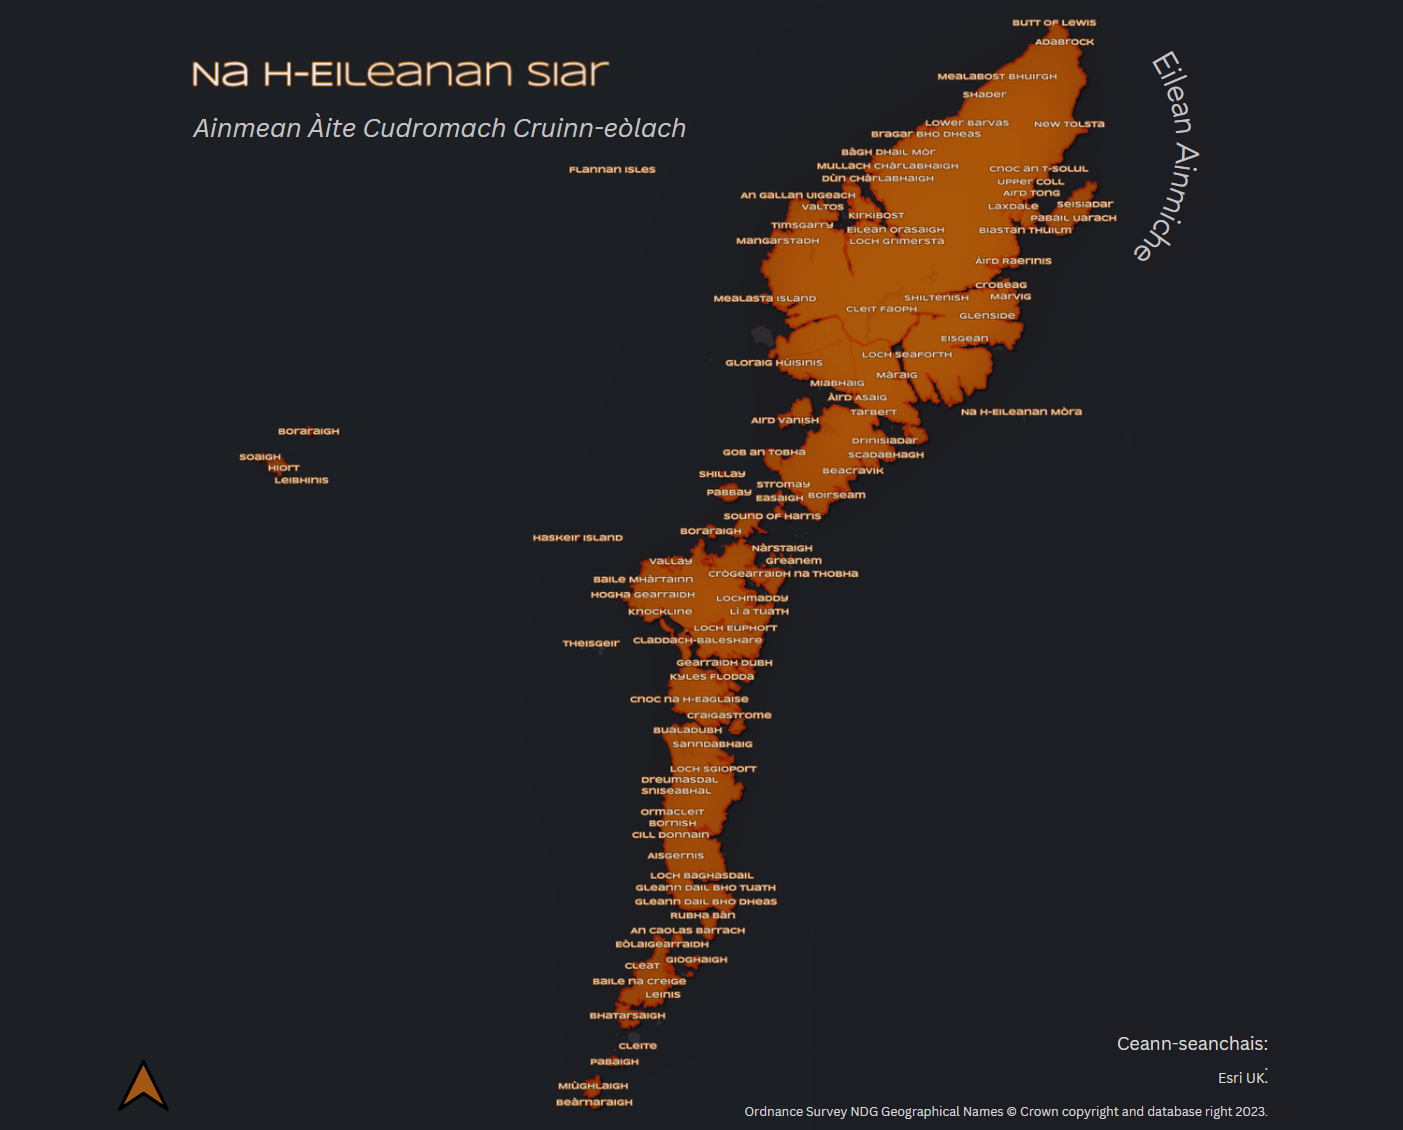
Fig 5: OS NGD Named Areas of Geographical Significance on the Western Isles.
Bearing this in mind, I set to creating a map of geographical areas of significance that have Scots/Gaelic as their primary or secondary names’ language using the OS Geographical Names collection on the Western Isles – no Na h-Eileanan Siar.
That concludes my trip around the new OS NGD Beta service offerings. I’m hoping I stirred your imagination for using these latest services along the way. If you are interested in getting your hands on these services, be sure to get in quick – they will be available in Beta from the Esri Marketplace
So, whether it be in an analytical workflow, a business use-case or merely putting my cartographic efforts to shame – take it away with your land-use and labelling!