Please note the views expressed in this article are the author’s own, and do not necessarily represent the views of the organisations mentioned in the text. All websites, APIs and data sources referenced are publicly accessible over the internet.
Local Development Plans have been a feature of our planning system in Great Britain for over fifteen years. Various different regulations and frameworks apply in England, Wales and Scotland, but in all three systems Local Planning Authorities are responsible for compiling a Local Development Plan (Local Plan) which describes the authority’s strategies and planning policies for its area.
Since Local Plans are statutory documents, and planning is obviously a contentious subject in a community, Local Authorities have tended to play safe during the consultation and publication of their Local Plan. Typically this process ends up with a long PDF document published on the council website, accompanied by various appendices and maps that follow the guidance and standards.
The Government white paper “Planning for the Future” published in 2020, which only applies to England, was fairly critical of the policy and practice of developing Local Plans. It says:
Local councils should radically and profoundly re-invent the ambition, depth and breadth with which they engage with communities as they consult on Local Plans.
Recommendations
There are several specific suggestions in the white paper:
- Local Plans should be visual and map-based, standardised, based on the latest digital technology, and supported by a new standard template.
- Local Plans should set clear rules rather than general policies for development.
- Reviews should be undertaken sooner than five years where there has been a significant change in circumstances.
To this list I would add:
- Local Plans should better reflect national housing policy and how it applies in the area, so that the link between Local Plans and the nation’s housing need is better aligned and better understood.
- Local Plans should provide access to digital data, by easy download and also as an API, allowing both developers and interested members of the public to explore and use the data in different ways.
- Local Plans should be living documents (or rather real-time data), so that all stakeholders understand how they are being delivered and allowing them to change in response to changing local needs.
Some of the above is about the contents of the plan itself and some about how the plan is published. In this blog post I want to talk a bit about the way Local Plans are published.
Publishing a Local Plan
As an example, I looked at Bristol City Council’s existing Local Plan, published way back in 2011. Like many LPAs, Bristol have published this as a series of PDF documents. The first document contains the strategic intent and narrative, but it was the Site Allocations Policies Map, a 42 page PDF of maps, that really got my interest. Site Allocations are of particular interest to the community, to property developers and other stakeholders. They detail why and how locations identified by the council and through consultation will be developed, and also contain a set of development considerations. Why not publish this as an interactive map?
Don’t worry – Bristol City Council did more than that. They published an interactive map viewer using ArcGIS which contains lots of the spatial data supporting their Local Plan. And included a link to it from their Local Plan homepage. Great! Now I can explore the Local Plan interactively, using a simple GIS viewer. As a developer or member of the public, this might help me to understand the plan. I can link through to the appropriate section of the narrative report from the map popups.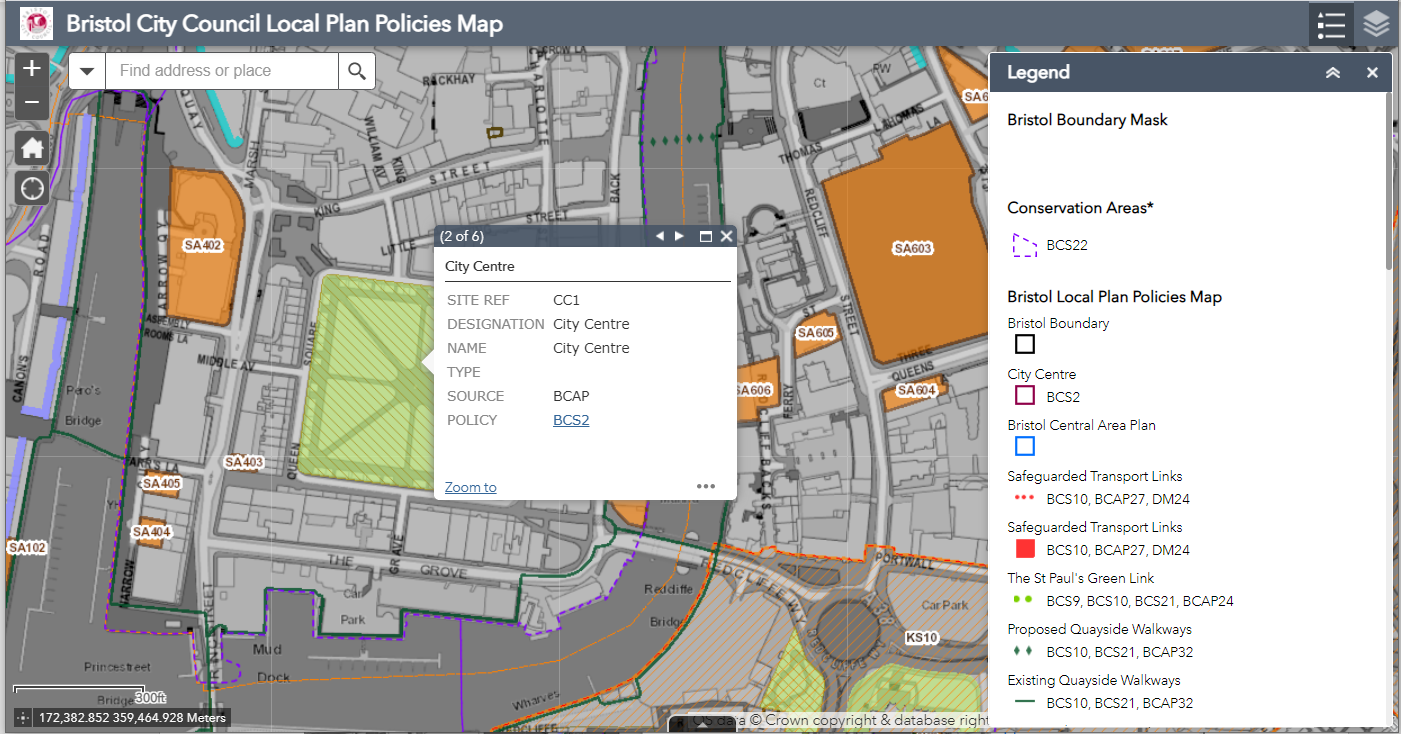
Now here is where it gets interesting. When using ArcGIS – when you publish your Local Plan in this way – what actually happens is that you enable an API on to your data, an API on to the evidence base and the findings of your Plan. Although Bristol don’t mention this explicitly on their website information, I can explore this API and the data behind it in a browser or other client (or in fact programmatically). If you want to know a bit more about APIs and this API in particular, I recommend reading my blog post from a couple of years ago.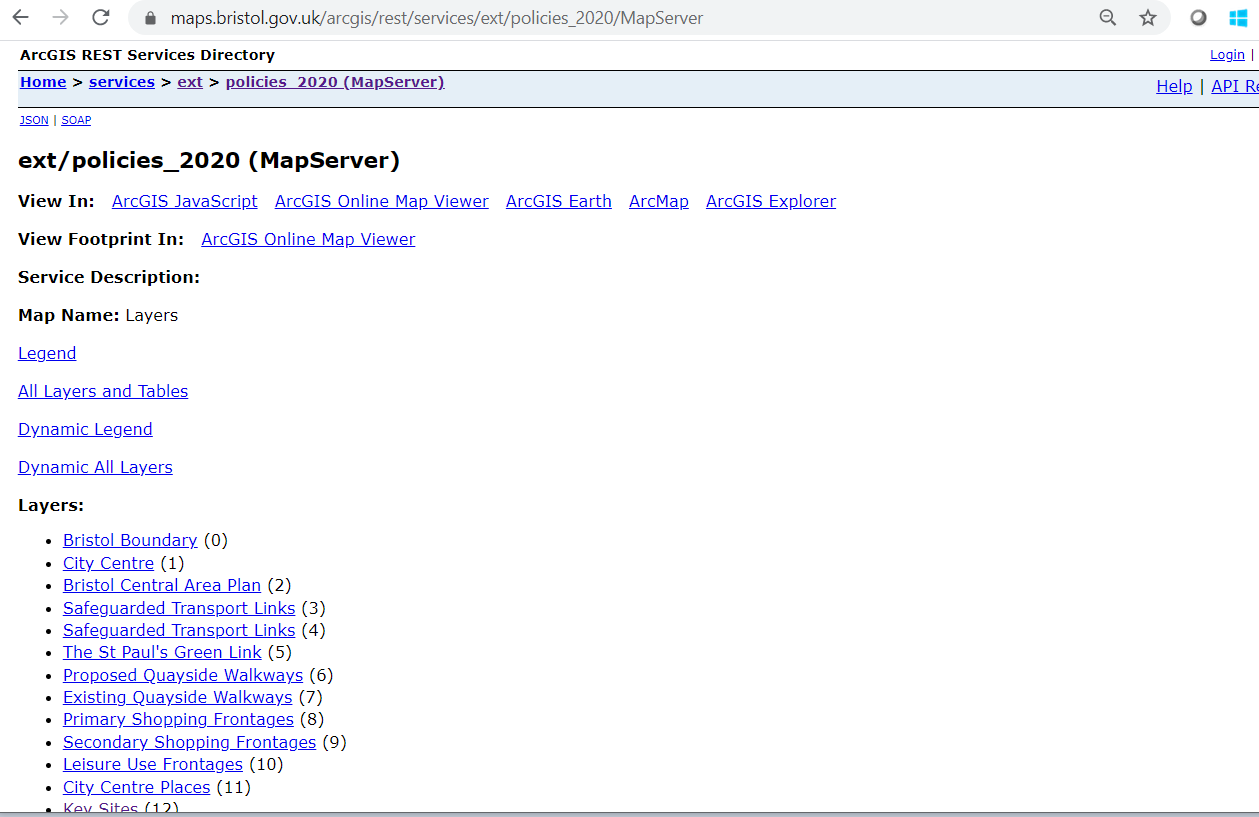
So what? Well now I can explore, understand and interrogate the Local Plan interactively alongside my own data, using my own software, and in different ways – in ways that I choose. For example, here it is in 3D: this is reading Bristol’s Local Plan (being read live from the Bristol City Council API) in 2D, and overlaying it with a 3D extrusion of Ordnance Survey MasterMap data, and 2D Land Registry Index polygons. Now I can understand how the Key Sites identified in the plan are currently split into property titles, and how this relates to the existing buildings around them.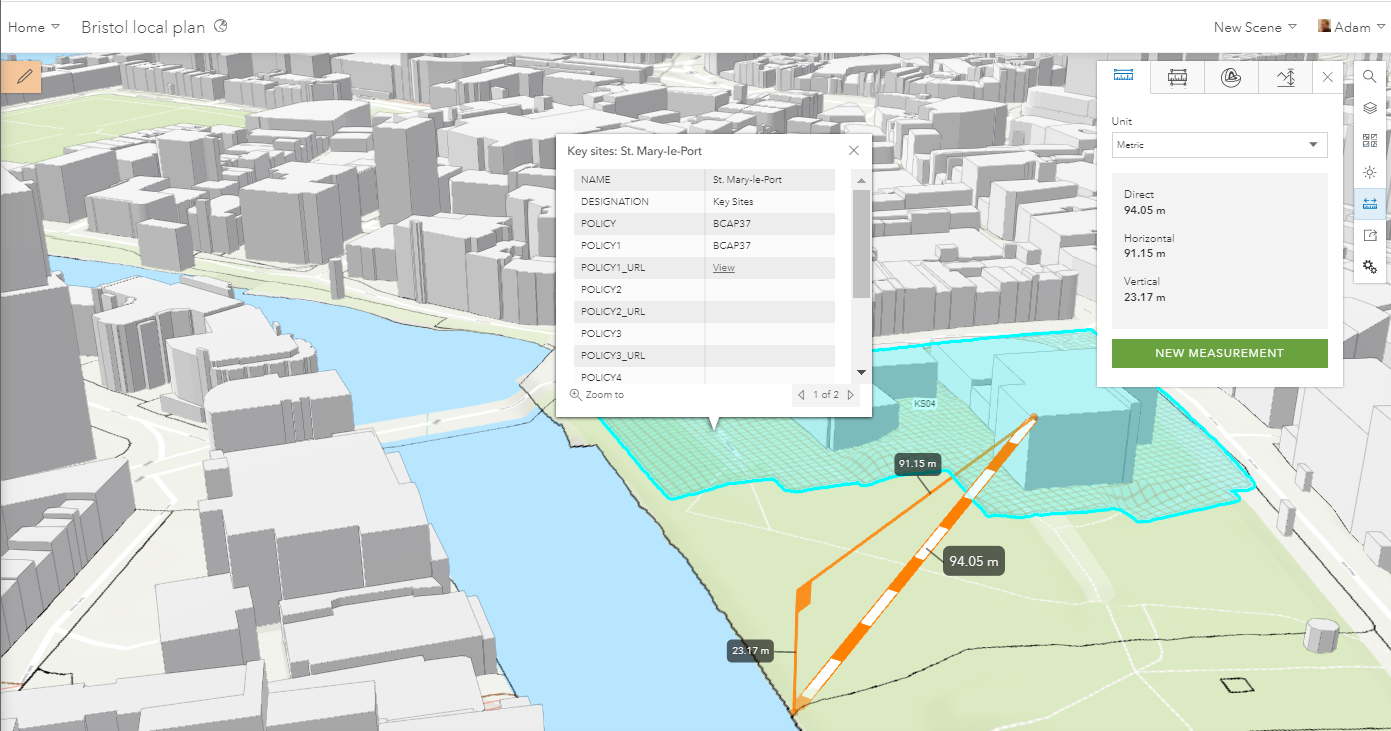
As a slight aside, some local authorities are already beginning to use 3D geospatial technology to enhance the community’s understanding of development through better visualisation, for example showing a “before” and “after” view of a particular development that is interactive and accessible to non-expert users. Here is an example from Nottingham City Council who are publishing details on Major Developments using interactive 3D web mapping applications.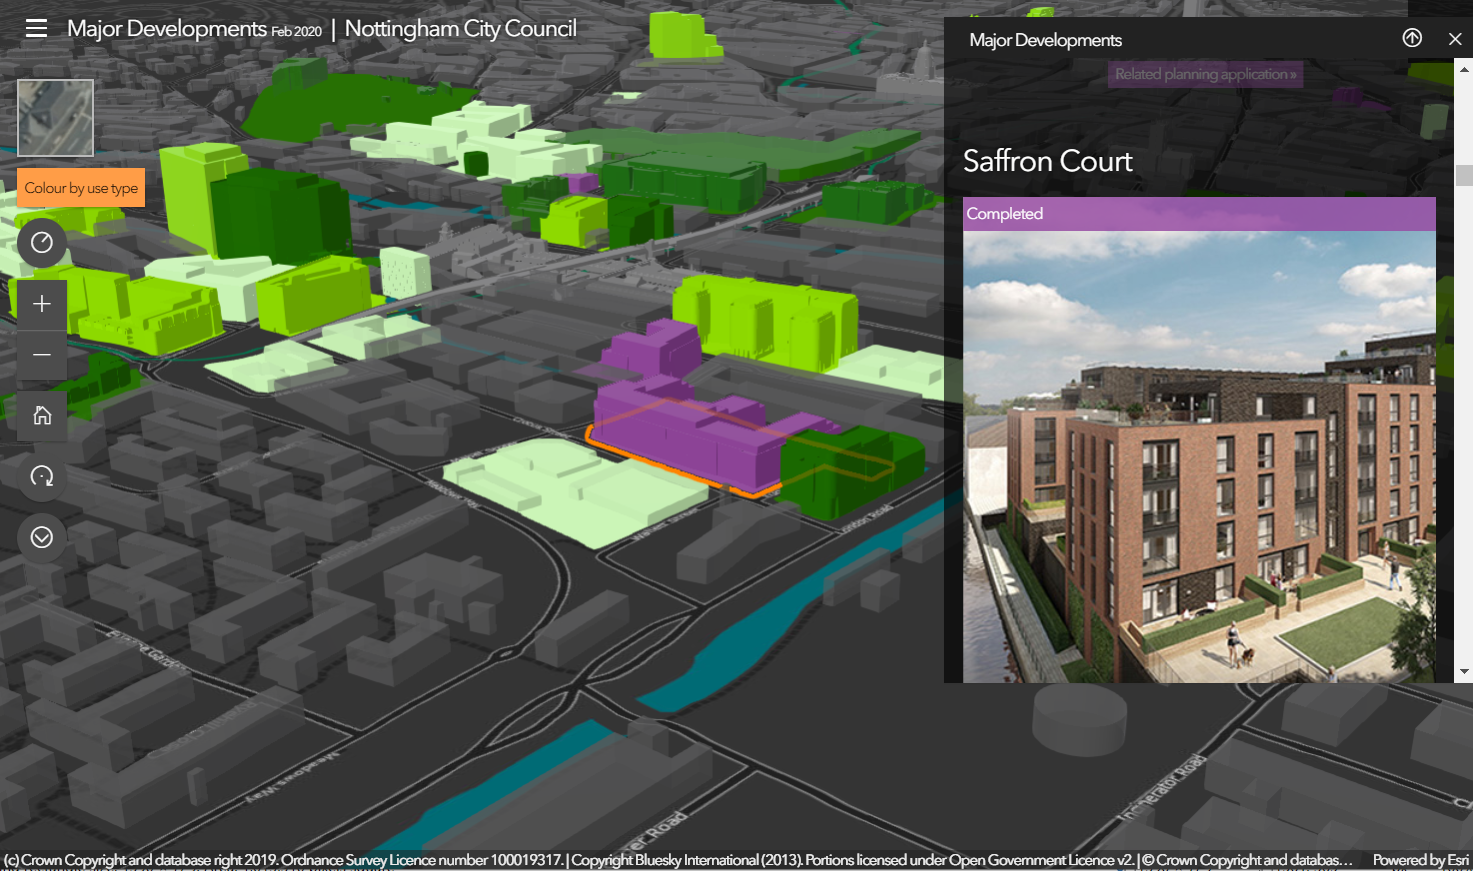
Back to Bristol’s Local Plan. Using ArcGIS simple web application configuration tools, pointed at the same, existing API published by Bristol City Council, I can create a completely different view for a different audience. Here is a web application which presents the Local Plan to the public based on where they live – a hyper local view. This combines the Local Plan data with ONS Census data to provide on-the-fly analysis of the data which is presented to the public in an understandable way. For those interested, in Esri we call this the Nearby app template. It only takes a few minutes to create public-facing web applications like this.
In this example, we don’t allow the public to provide feedback on the plan, but if this sort of view was available at consultation time, the app could easily be extended to provide a mechanism for providing comments back to the Local Planning Authority, or crowd-sourcing alternative proposed uses for key sites, or other feedback.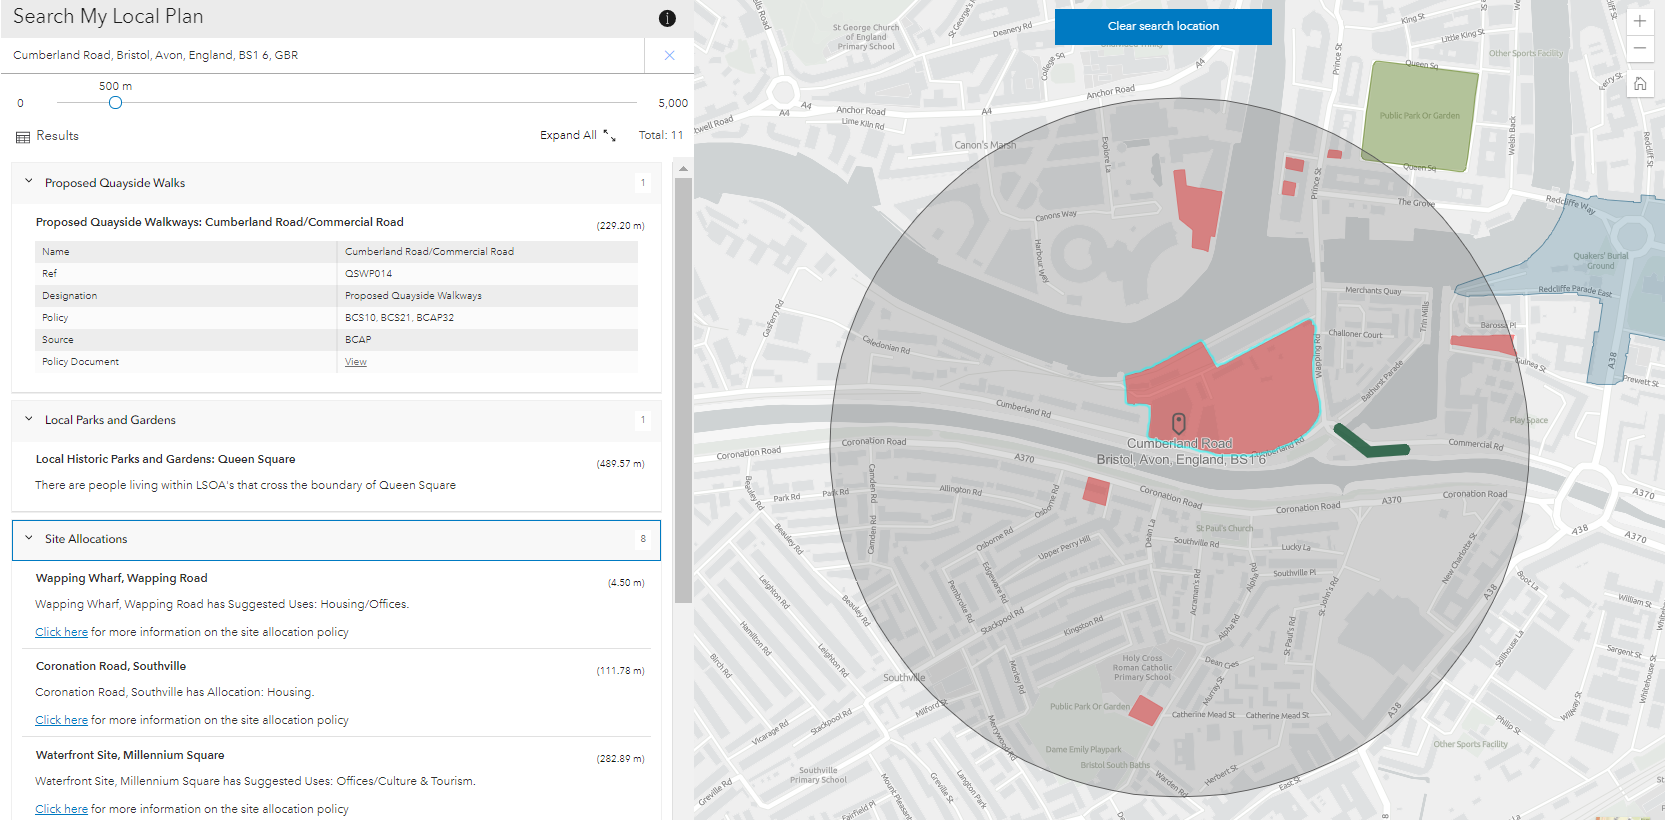
A new kind of Local Plan
At this point I started thinking – hold on a minute! The adopted Local Plan only changes every few years. Accessing the data live, via a real-time API is nice, but I could easily just take a copy of the data and load it into my CAD system or public web application.
But what if the Plan wasn’t static? What if it changed as the world around it changed – as developers bought up key sites and transformed the city. A digital twin of Bristol emerges – one focussed not just on the now but the future of the city, based around strategic and tactical planning. This ‘living’ version of the Plan is accessible to the public, so the whole community can see progress being made, whilst also being able to search the local plan spatially to get a clearer picture on what is happening in areas of interest to them, near where they live or work, and provide feedback to developers and the authority. Local authorities tell us that a more engaged citizen fosters a greater sense of collaboration between the community and the authority. Here is a great opportunity to engage people.
Or – what if the map contained every Local Plan? What if I could look at the entire country – for example in England looking at MHCLG housing need at a national scale – then zoom in revealing each Local Planning Authorities’ Local Plan? This would provide a seamless, national view of planning policy and how Local Plans are implementing national policy.
We have seen some of this thinking at a sub-national scale with the recent launch of the London Planning Datahub from the Greater London Authority. This brings planning data from across all London Boroughs and makes it available as dashboards and services to allow others to interrogate, analyse and visualise.
The opportunities for digital Local Plans are vast and are still emerging. Think for example about how we can use Virtual Reality and Augmented Reality to help citizens and stakeholders visualise the impact of a proposed policy or a particular development. ArcGIS now has an SDK supporting both the Unity and Unreal games engines, opening up the prospect of truly immersive digital representations of our communities; photo-realistic experiences powered by live, real world data.
The technology to do this is already here, and local planning authorities are starting to embrace it. We just need a bit of ambition and collaboration across Government. Planning authorities also need to invest in developing their knowledge and skills to use these technologies to deliver better outcomes in planning and to provide greater recognition for the vital role planning has in shaping our communities.