Many of us using ArcGIS Online have got a huge amount of data stored in the cloud – hosted layers with a large number of features and fields that are simply overwhelming and difficult to get any useful information from. With Report Builder for ArcGIS, you can quickly design and generate a report for every single feature in a dataset, giving you a dynamic and interesting way to explore the trends and patterns in your data.
This blog will showcase how Report Builder for ArcGIS can effectively communicate a large amount of information. In this example I have combined some datasets from a variety of sources to explore aspects of UK protected areas in a series of reports, including the number and distribution of Eurasian otters (Lutra lutra) found within them. Whilst driven by a personal interest, such a report could be relevant to wildlife conservation groups such as the Mammal Society or those authorities managing the protected areas.
If you’re new to Report Builder for ArcGIS, first get to know its core capabilities and interface by reading this introductory blog.
Where did I source the data I used?
For this report, I combined open datasets from several sources across the internet, which are all linked at the end of this article. Some highlights include:
However, I still had a bit of work to do before I was ready to make my report.
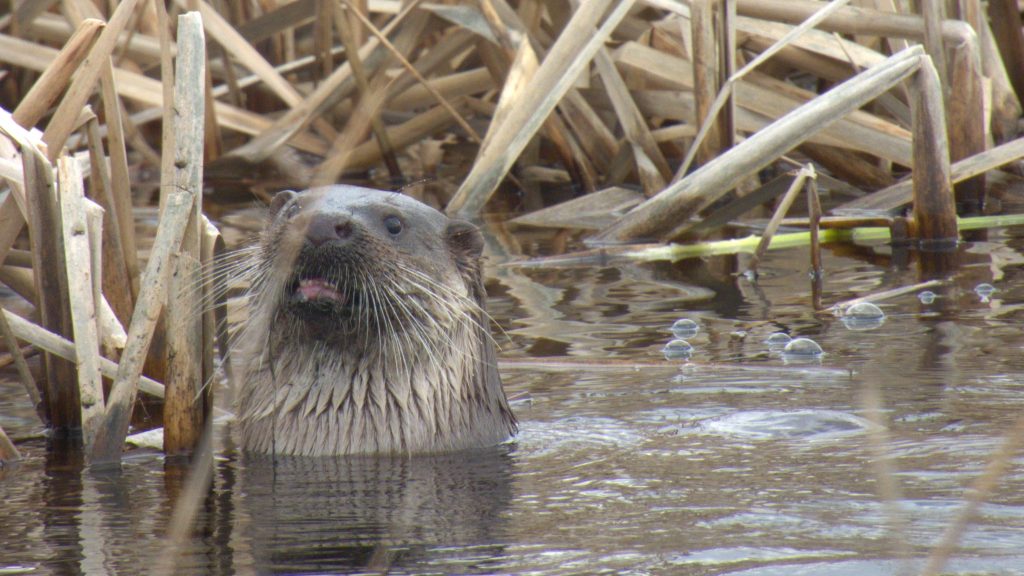
This photograph was taken by Phil James in the Bristol Channel
Report Builder creates an individual report from every feature in a hosted layer, which means that a lot of fields in one attribute table gives you many variables to use in your report. So, I processed the above data using ArcGIS Pro to bring everything together into one attribute table.
After some data format conversions, polygon processing and a fair few spatial joins, I had a feature layer showing all the National Parks, Areas of Outstanding Natural Beauty and National Scenic Areas across the UK. The attribute table included detailed information describing how much of each land cover type was inside each protected area, as well as how many otters were spotted each year.
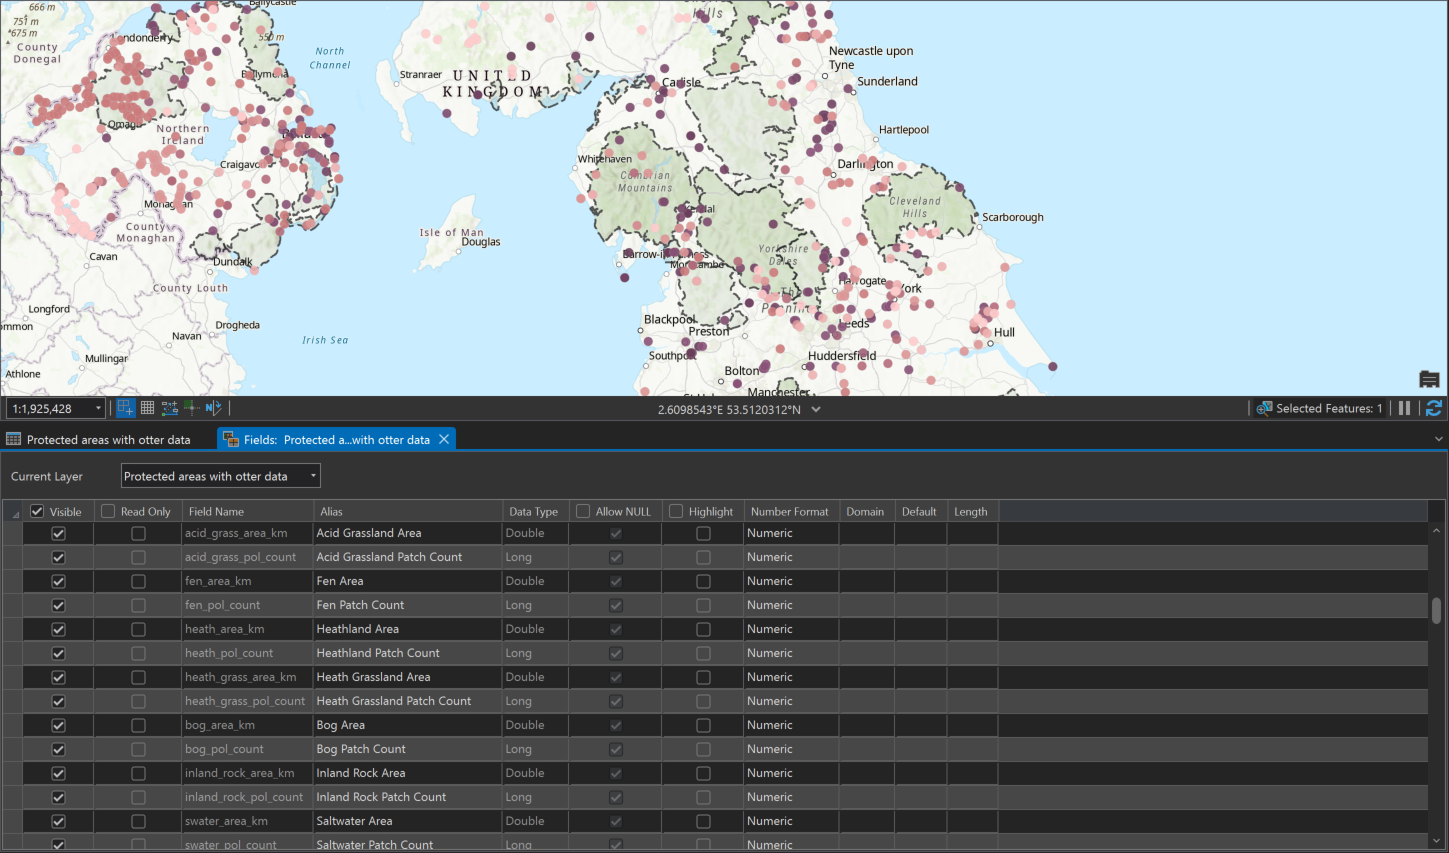
In the end, there were 123 different fields, but I didn’t use every single one of these in the final report; some were present for the purpose of processing.
How can this information be used in Report Builder for ArcGIS?
If you’ve used Report Builder before, this is the part that you’ll be familiar with. I selected the layer with the detailed attribute table as the primary data source, after which I could start creating all the graphs and figures that you can see in the final report.
The widgets that make up the report are key to interpreting and picking out trends in the data. My first choice was to add a pie chart describing the different land cover types found within the protected area in question. I could have used any number of widget types to show this data, such as filled icons, a polar chart or an icon chart, some of which are used in other places in the report. All of these graphs have a variety of their own customisation options and settings, which helps to configure the report to an exact specification.
Adding a widget is as simple as dragging and dropping an icon onto your draft report and picking some fields.
As well as displaying data, widgets can also be used to compare data. Using a bubble chart, I can compare the number of otter sightings, the size of the protected area and the length of rivers within it. By using widgets such as this, we can see the predictable trend that the larger the protected area, the more rivers are found within it, however, we can’t see a clear relationship between either of these factors and otter sightings. Imagine what more we could learn with a few more graphs examining different variables!
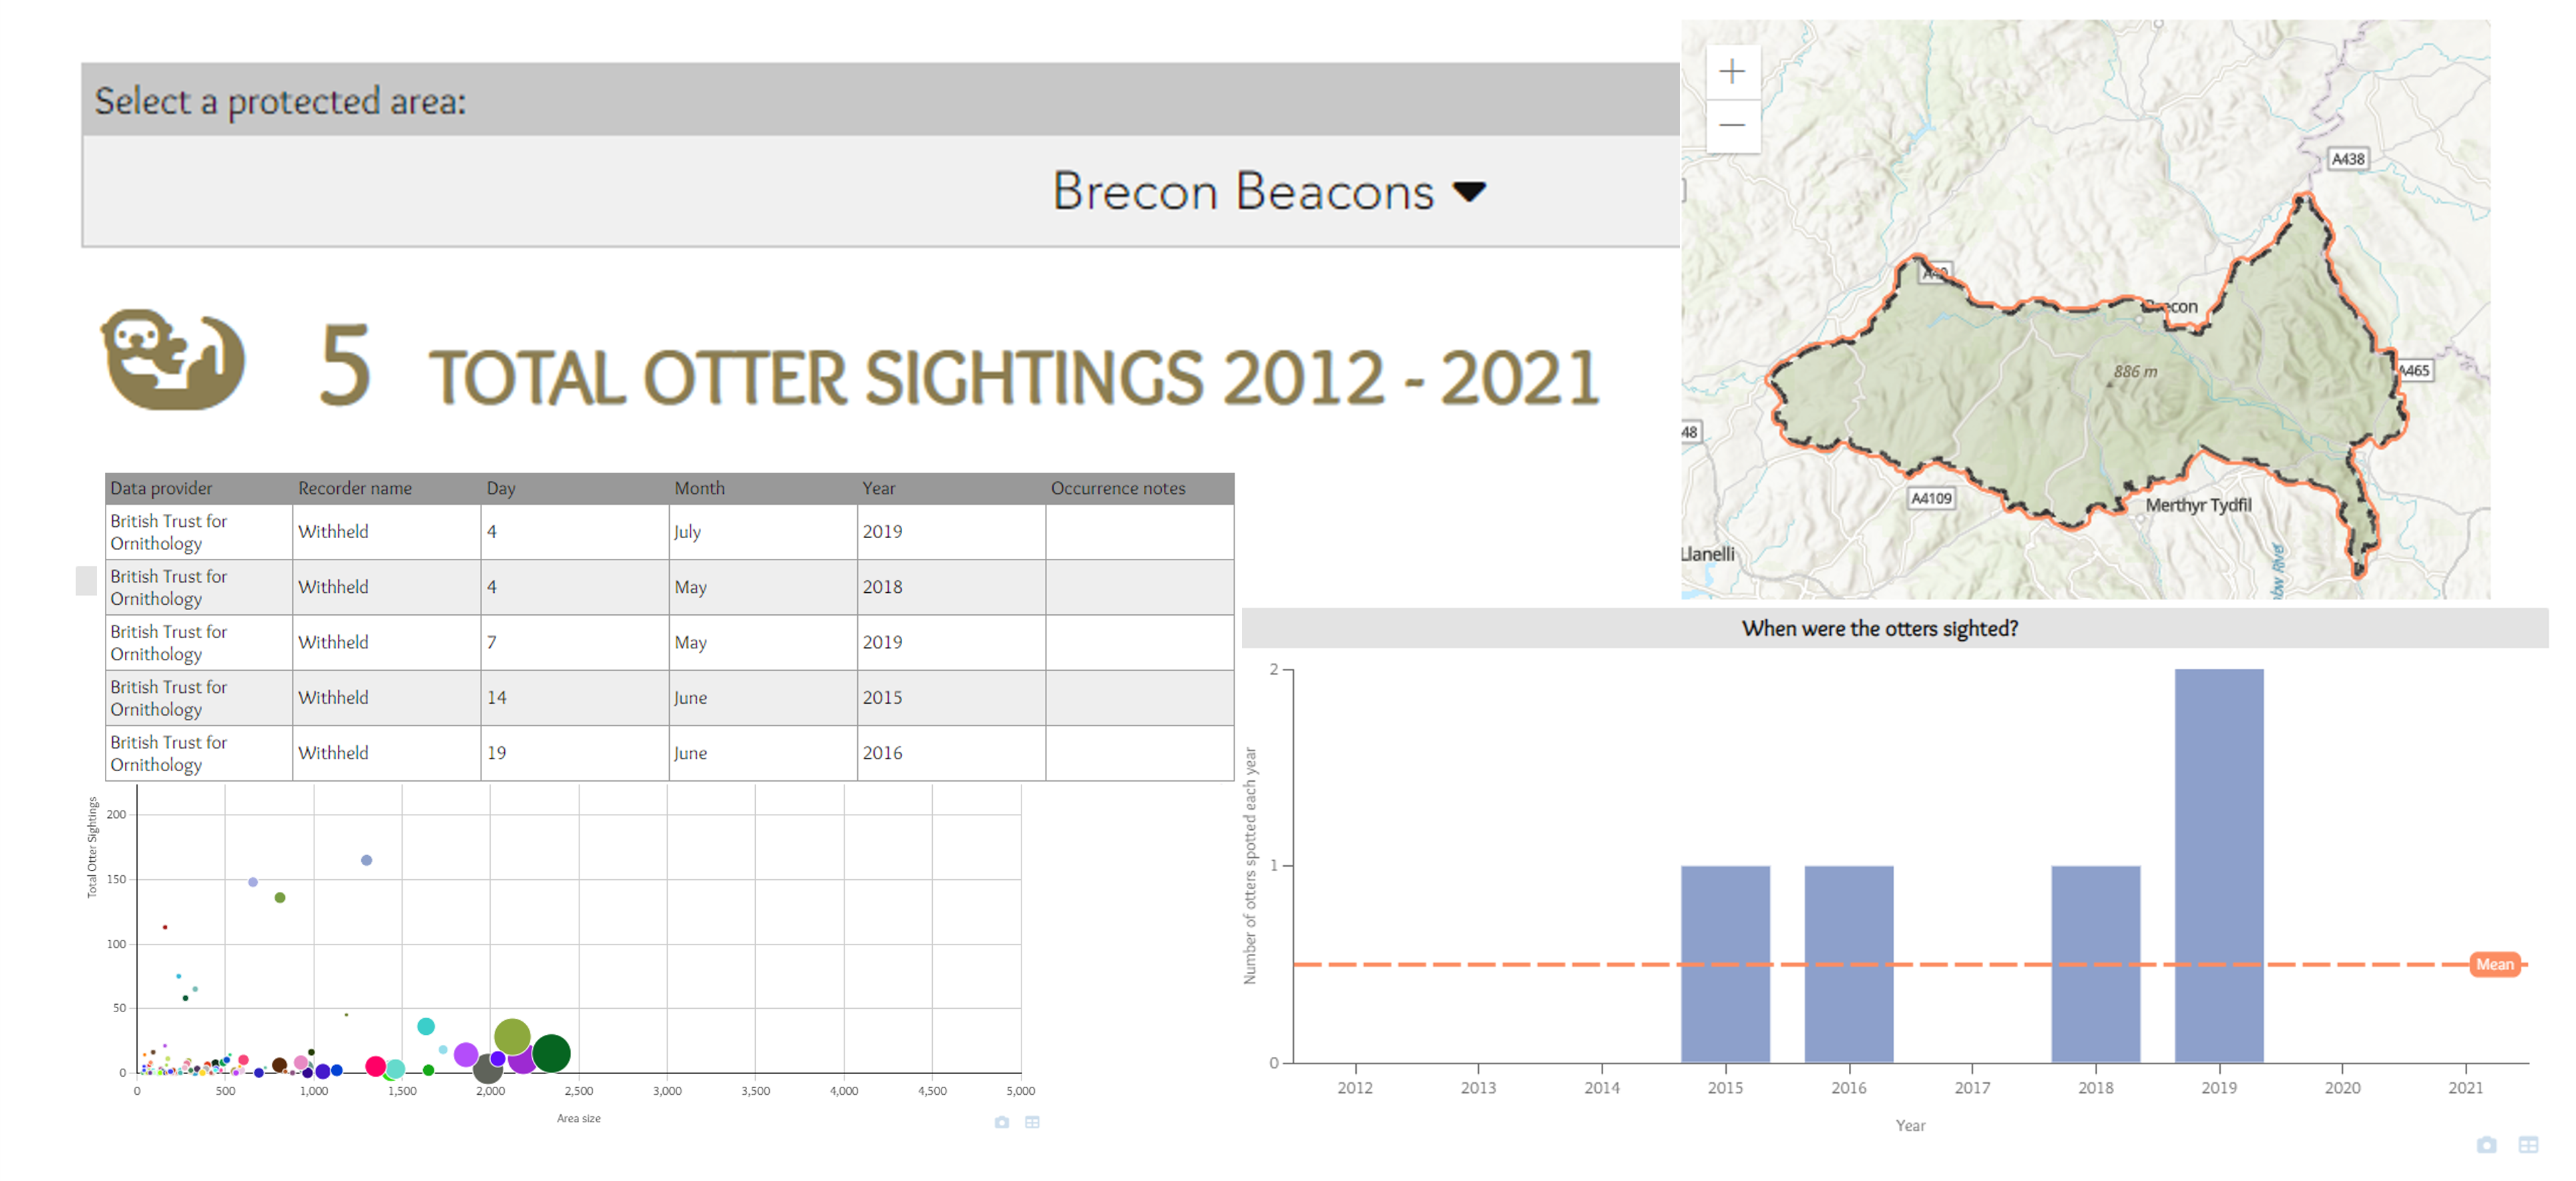
These are some of the widgets I used, but there are plenty more in Report Builder!
Once I had designed one report for one protected area, the rest of them were generated automatically using that first report as a template. You can check out the final catalogue of reports here!
Create deeper interactions between ArcGIS Online and Report Builder for ArcGIS
There are many ways that you can use Report Builder in tandem with ArcGIS Online; why not try out some of the following ideas?
- Create a design that you love with one report, then export it and use it to quickly create reports with all your other datasets stored in ArcGIS Online!
- Create a feature layer with Survey123 responses and then create a report using this same hosted feature layer. Every time a new survey response arrives, a new report will be generated automatically based on the new data!
- Set up a Sweet for ArcGIS app that fills in fields automatically as you edit, then use this same feature layer as the basis for a report. The Reports will automatically update as you change things in the original dataset.
There are plenty of ways to use these reports within ArcGIS Online as well; each report has its own static URL that incorporates the field that you set as the ID field, often a unique number. This means you could dynamically calculate the new field in Map Viewer and link it in pop-ups – follow this link to explore an app using the Otter Spotter report!
This is just one way of using these reports in other parts of the ArcGIS System. Click on this image to explore the app yourself.
This process of building one report to generate the whole series has the potential to speed up so many workflows. The widgets and customisation options are a great way to share data from otherwise incomprehensible feature layers in a dynamic and captivating way. Be sure to read more on Report Builder for ArcGIS, or try it out yourself with a 30-day free trial!
All the open data used in this project is as follows:
- National Parks (England)
- Areas of Outstanding Natural Beauty (England)
- Areas of Outstanding Natural Beauty (Wales)
- Areas of Outstanding Natural Beauty (Northern Ireland)
- National Scenic Areas
- Otter Data filtered to the relevant years and then to only include open records
- Land Cover Map 2019 (25m rasterised land parcels, GB)
- Land Cover Map 2019 (25m rasterised land parcels, N. Ireland)
- OS Open Rivers