At this year’s Esri UK Scottish Conference, we saw the new ArcGIS Pro flood simulator tool in action. This new tool allows you to model how water moves and accumulates in a 3D scene, enabling quick, on-the-fly flooding scenarios. This dynamic approach to scenario planning provides a flexible, efficient way for planners to explore flood mitigation strategies and build urban resilience.
In this blog, I’ll focus on one particular feature of the tool: infiltration rasters, which allows users to model surface-specific infiltration rates. Through a case study example, I’ll demonstrate how incorporating green infrastructure – such as permeable pavements or rain gardens – reduces predicted flooding impacts.
How does the Flood Simulator tool work?
Using shallow water equations, the Flood Simulator tool models how water flows and accumulates throughout a 3D scene. Through setting parameters such as rainfall amount and duration within a defined area of interest, you can quickly run rainfall scenarios and visualise the results. This streamlined approach to flood simulation means you can easily re-run scenarios with different parameters, such as adjusted rainfall rate, or with flood barriers put in place, and easily compare results between these events. This is where the strength of the flood simulation tool lies, not as a replacement for more complex hydraulic models, but as a way of running quick, on-the-fly scenarios to explore potential outcomes in real-time.
Understanding infiltration rates
In flood simulation, infiltration rasters help simulate how different surfaces – whether concrete, grass, or permeable pavement – absorb water during a storm. Essentially, each cell in the raster is assigned an infiltration rate, which represents how quickly water can seep into the ground. The higher the infiltration rate, the less water runoff, reducing the risk of flooding.
Think about it… in a typical urban area, we’re surrounded by impermeable surfaces like roads, pavements, and buildings. These surfaces have low infiltration rates meaning when it rains, water easily flows over these surfaces, pooling in streets or low-lying areas. In contrast, areas with natural ground cover – like grass or trees – have higher infiltration rates, allowing them to absorb more water and reduce excess runoff.
By incorporating an infiltration raster within ArcGIS Pro’s Flood Simulator tool, you can capture these specific characteristics of the landscape you’re working with. By assigning different rates to different surfaces, you can simulate how these variations affect flooding in real time. Want to see what happens when you add green infrastructure? Simply adjust your infiltration raster, re-run the simulation, and instantly visualise how it impacts water flow and flood risk. This makes the process of planning for flood mitigation not only smarter but also incredibly efficient. Let’s take a closer look at this process in action.
Assessing flood mitigation potential of green infrastructure in Hebden Bridge
Hebden Bridge, a small town with a big history of flooding, is a perfect place to explore the impact of green infrastructure on flooding.
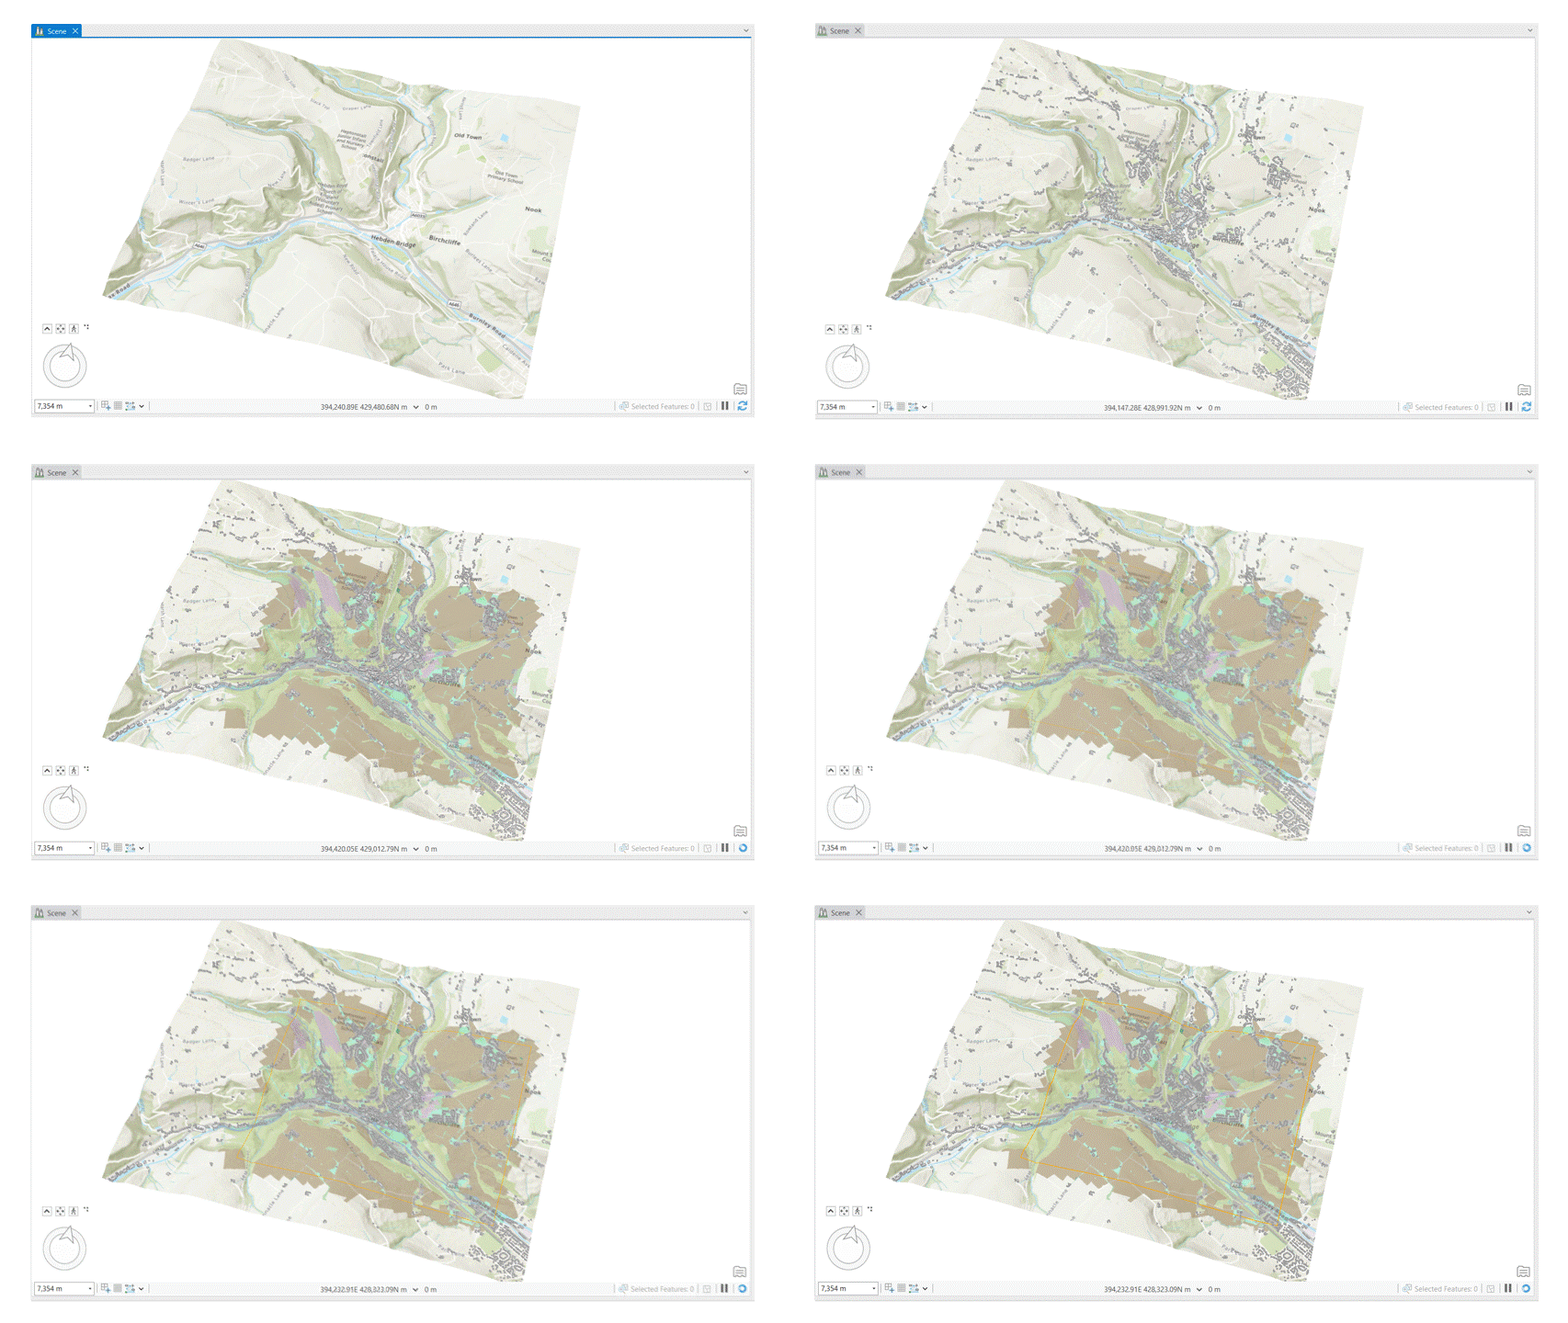
To get started, I need a land classification raster. For this, I’m going to use Ordnance Survey’s MasterMap Topographic Area data. This dataset contains more than 500 million real world objects – everything from roads to parks – represented by individual features. By using the Polygon to Raster tool in ArcGIS Pro, I can then turn this data into a land classification raster, assigning unique pixel values to each land cover type. In a different approach, you may instead choose to derive your land classification raster from satellite imagery using ArcGIS Pro’s Image Classification Wizard, or make use of the Land Classification data available in the Living Atlas.
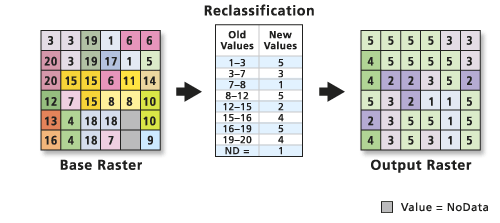
The next step is to create an infiltration raster, the core layer for this project. For this, I’ll use the Reclassify Tool to assign infiltration rates to each cell in the raster based on the surface type. The Flood Simulation tool recognises infiltration rates in either millimeters or inches per hour. The default rates used by ArcGIS Pro are outlined in the table below:
| Surface Type | Infiltration Rate (mm/hr) |
| Impervious Surface | 0 |
| Barren – Dry Sand | 125 |
| Barren – Wet Sand | 45 |
| Barren – Dry Clay | 25 |
| Barren – Wet Clay | 2 |
| Forest – Dry Loam | 200 |
| Forest – Wet Loam | 8 |
| Grass – Dry Sandy Loam | 250 |
| Grass – Wet Sandy Loam | 15 |
| Vegetation – Dry Clay Loam | 150 |
| Vegetation – Wet Clay Loam | 5 |
I’ll keep it simple by sticking to a few surface types, but if you want to dig deeper you can assign as many specific infiltration rates as you like.

How pixel reclassification works.
Running the simulation
Now that the infiltration raster is ready, it’s time to head over to a 3D Local Scene where I’ll set up the environment for running the Flood Simulation. For this scenario, I’m using OS 3D Buildings data, the World Elevation 3D layer, and my infiltration raster which will all participate in the simulation. For this demo, I set an exaggerated rainfall rate of 100mm/hr to emphasise the impacts – let’s hope Mother Nature doesn’t take notes! I’ll also ensure that my infiltration raster is selected from the Infiltration rate drop down in the configuration panel.
Now it’s go-time! Once the rain has settled and the simulation has completed, I can look at the resulting water depth rasters to identify areas where flood accumulation is particularly high. These areas highlight where green infrastructure could be most effective.

Introducing green infrastructure
Now I know where in my area of interest might be most impacted by an extreme rainfall event, let’s make some changes to try to mitigate the impact. Using the Pixel Editor tool, I updated the infiltration raster by replacing some impervious surfaces with green spaces or parks, and “rewilding” parts of the surrounding hills, by replacing some agricultural land with forests. These changes should slow down runoff, absorbing more water before it reaches the town.
![]()
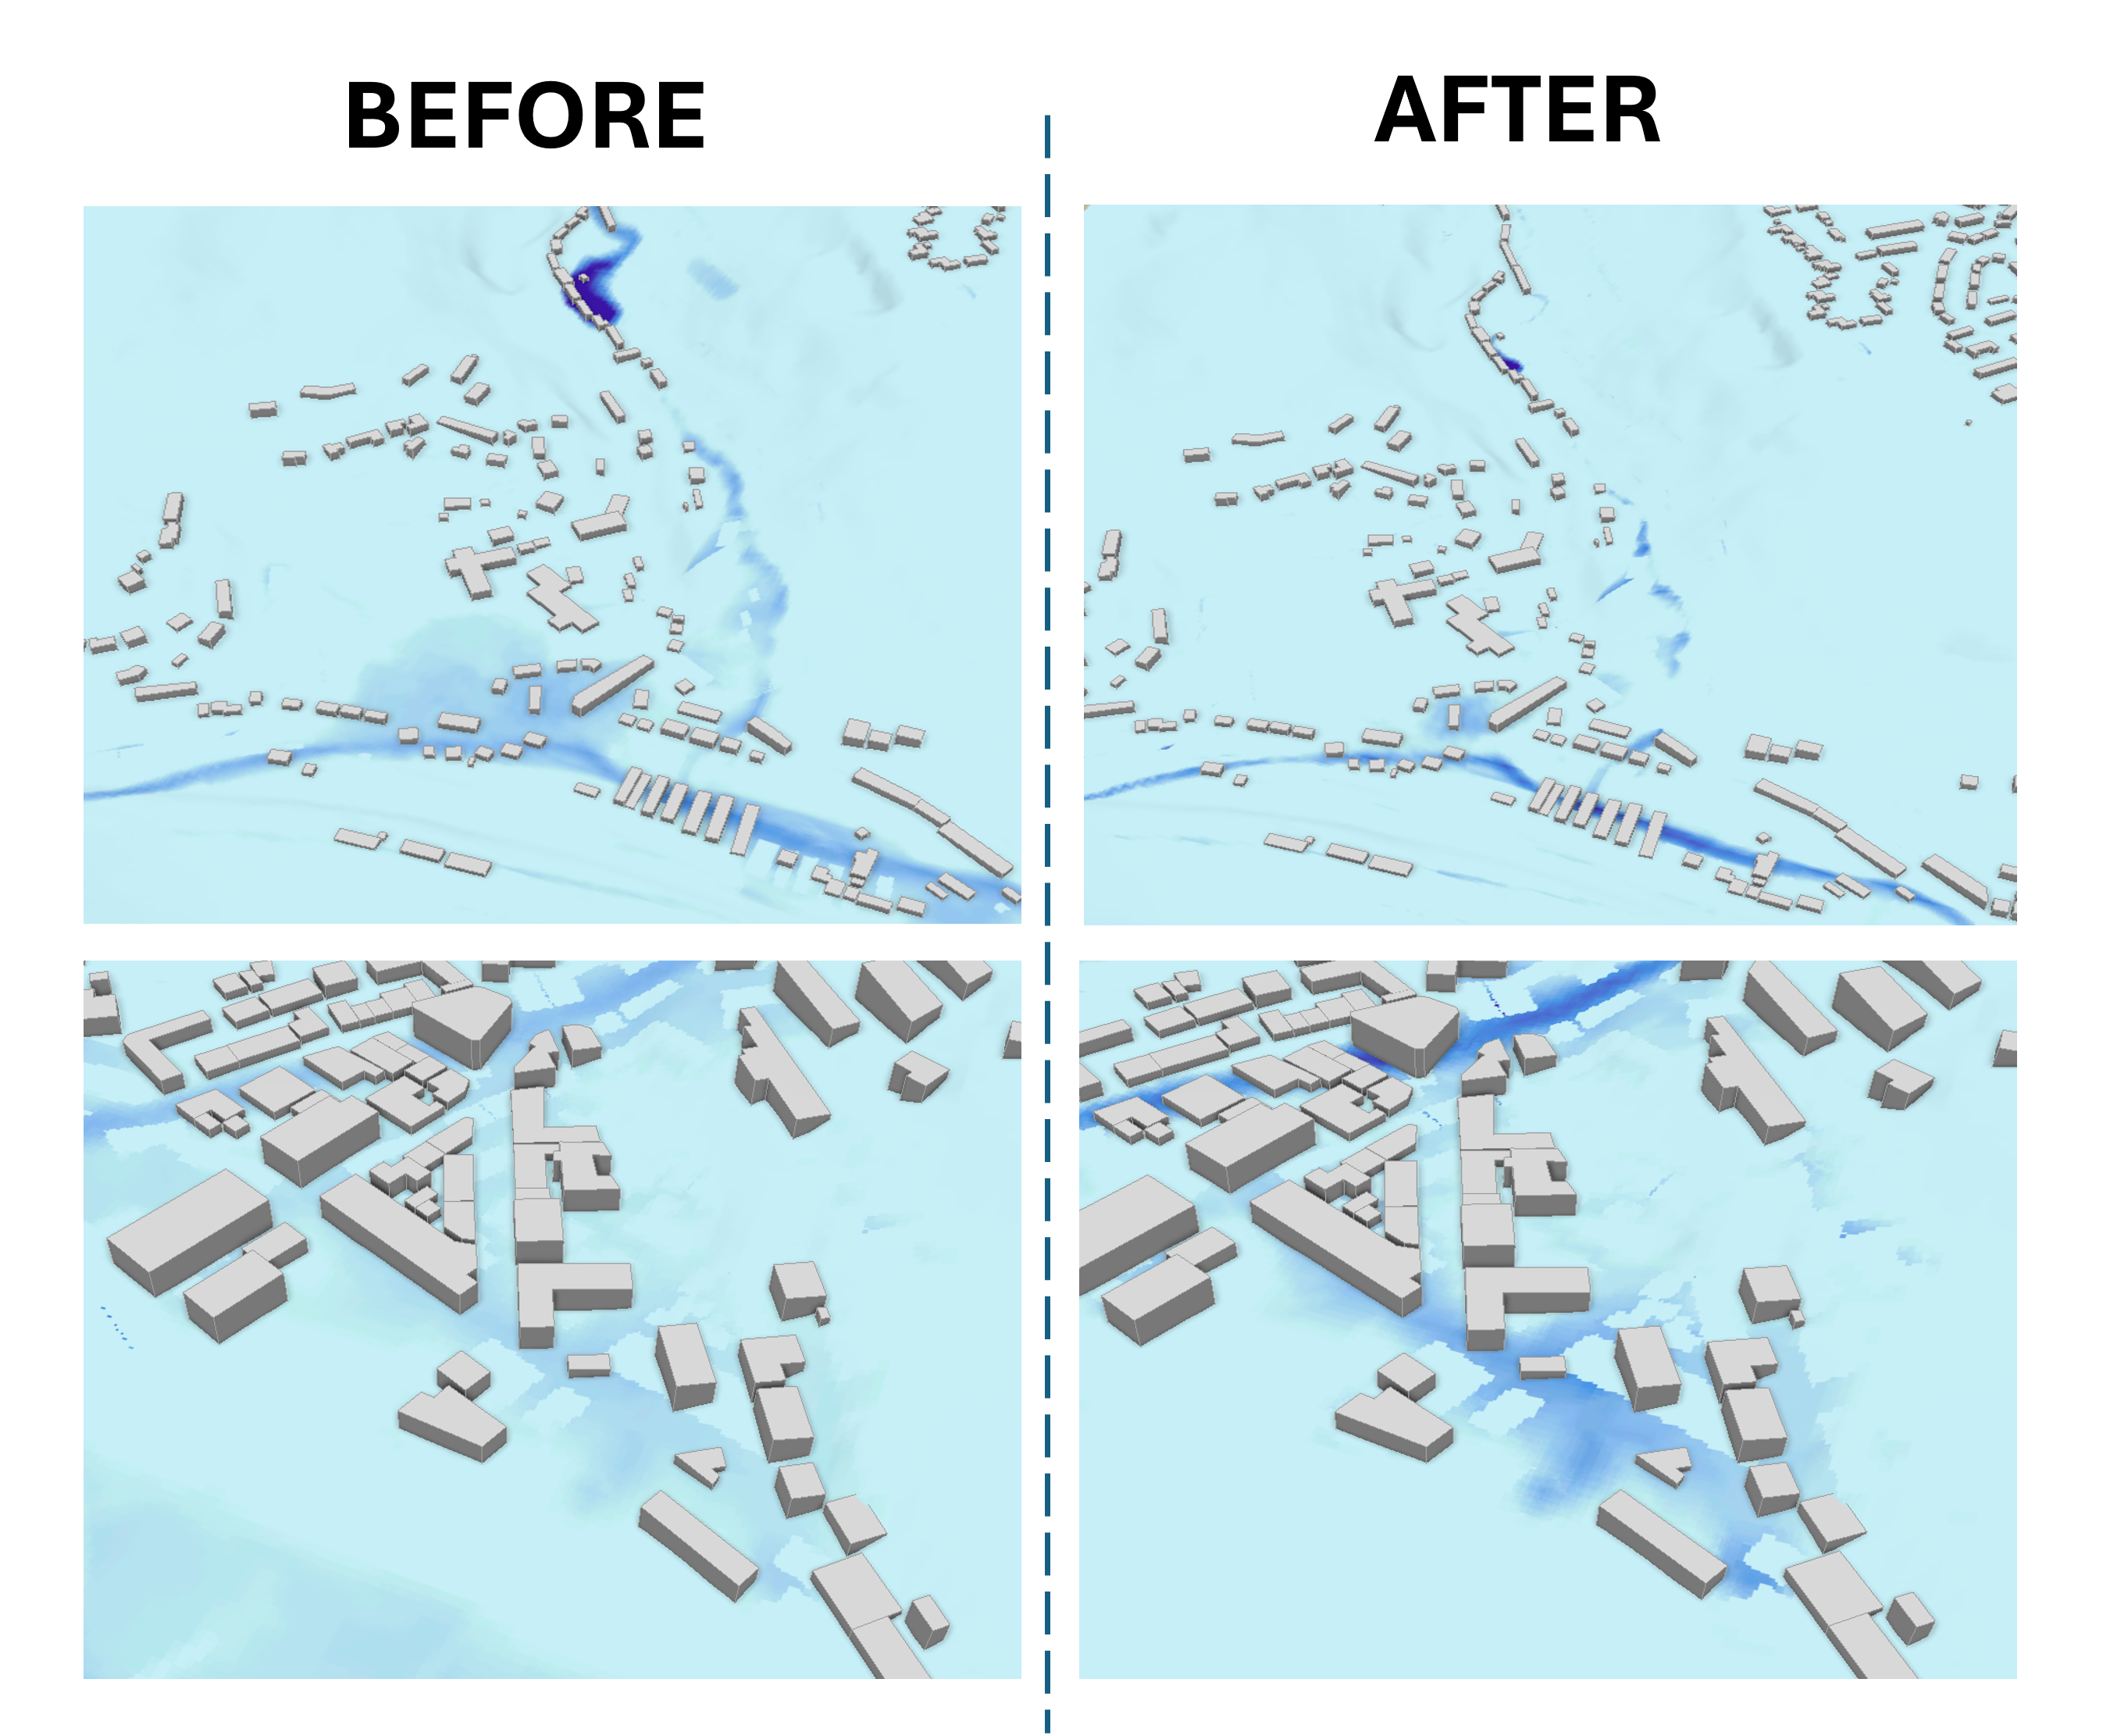
After updating the infiltration raster, it’s time to re-run the simulation and assess the impact of the newly introduced green infrastructure. Using the new water depth rasters produced by the simulation, I can visualise and compare how water flow and accumulation have changed across the landscape. In some areas the impact of flooding has decreased, but my mitigation has had unintended consequences in other areas. Check out the difference below!

Key Insights and takeaway
In my experience, the ArcGIS Pro Flood Simulator tool has proven to be a practical tool for visualising and assessing flood risks. It’s straightforward to adjust variables like infiltration rates and explore various flood mitigation strategies, making it a valuable resource for early-stage scenario planning.
Through this example in Hebden Bridge, we’ve seen how the impact of adding green infrastructure—like urban greenspaces and rewilded areas—can can be quickly visualised and assessed in ArcGIS Pro using the Flood Simulator tool. While this tool isn’t a replacement for more complex engineering models, it offers a quick, user-friendly way to test ideas and explore scenarios in real time, helping planners to make more informed, data-driven decisions.
As climate challenges grow, ArcGIS tools like the Flood Simulator help us plan smarter and faster. I encourage anyone involved in flood management or urban planning to try it out and see how it could support your efforts to build more resilient communities.