Power BI is an excellent tool from Microsoft for data visualisation and dashboards. ArcGIS, from Esri, is also an excellent tool for data visualisation and dashboards. Can I use both? Absolutely. In fact, we encourage our customers to have both tools as part of their business intelligence capability. Does that mean I need to store the data twice? No. Are they two separate systems? No. You can have a single-source-of-truth for data (spatial and non-spatial) that is presented to your staff via either tool or via both tools.
That is the point of this post.
The first thing to recognise is that the architecture of the two tools is very similar – or perhaps I should say aligned. And also the publishing workflow is aligned: both tools support power users, but also encourage self-service publishing. In both tools, a user typically authors real-time visualisations and analytic dashboards, using either a thick-client app (Power BI Desktop or ArcGIS Pro/Arc Map) or a web app. Then the same user publishes these visualisations – either to one person, to a group or the organisation, or to the world.
A fundamental principle of both tools is the idea of real-time business intelligence. As the data changes, the dashboards automatically update in real-time. In many situations you can create a highly functional and great-looking dashboard in either tool. Of course, for some things Power BI is better and sometimes ArcGIS is better.
How do I get business data stored in ArcGIS into a Power BI dashboard?
This is the most common question I get asked and key to answering it is to understand that these are two different ways of presenting the same data. Both tools expect to get the data from industry-standard data sources: databases, files (e.g. CSV), APIs (e.g. JSON) and so on.
Many ArcGIS users store their spatial data in a database, such as SQL Server, Oracle or Postgres (including database-as-a-service options available in Azure and Amazon Web Services). All database platforms supported by ArcGIS are supported by Power BI…
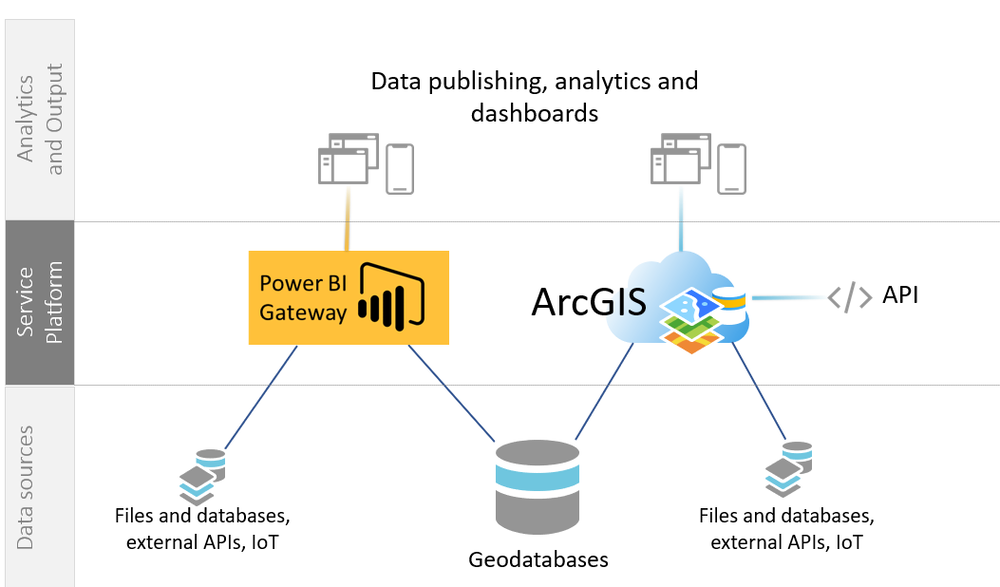
So just connect from Power BI Desktop directly to your existing spatial databases, design the dashboards you need and ignore the spatial context of that data. Present the data in Power BI using all the visualisations you are familiar with. To enable real-time dashboards using data from a database (spatial or not), you will need to use the standard Microsoft service platforms that form part of Power BI, such as Power BI Gateway or Power BI Report Server.
That is too easy. What if my ArcGIS data isn’t in a database? What if it is stored in the cloud in ArcGIS Online, or within ArcGIS Enterprise’s Data Store? We call these hosted feature services, and the data is accessed via web services – via a REST API.
Still easy! Simply connect Power BI directly to the query endpoint of the ArcGIS API. The API presents JSON, which Power BI can understand and show in visualisations, again all in real-time. In order to do this, use the query method of the feature service API. For more details, see the Appendix of this post.
If your users and groups are derived from Microsoft Active Directory/Azure AD then you can have a seamless authentication and authorisation experience between the two routes into your data. For example, you could create a single tabbed application using an ArcGIS Story Map, with one tab showing a Power BI dashboard and the next tab showing a map-driven ArcGIS dashboard. The end-user is unlikely to care – as long as they are getting the business intelligence they need to do their jobs.
How do I get business data which is already in Power BI on to a map?
Another question I get asked by customers is how they can show their existing Power BI data sources on a map. How can they put maps into their dashboards?
Often this is the same question as the last one! Those existing Power BI data sources are often ArcGIS data sources too. So a common approach is to use both tools alongside each other, so you get the best out of each tool. In the previous section I described how to do this.
But Power BI supports many more types of data source than ArcGIS does. There will be some scenarios where ArcGIS cannot connect to the real-time data source directly. Almost all of these scenarios will be with very simple spatial data - addresses and XY coordinates. The reason for this is that data sources capable of holding rich spatial data, such as lines and polygons, are likely to be supported by ArcGIS already.
So how do we get a map in Power BI? Well, it comes with three mapping visualisations from Microsoft which can be useful:
-
-
The Map works well for dots on a map if your data contains latitude and longitude. It does support addresses – Geocoding - but the results cannot be limited to the UK and in my experience it produces unsatisfactory results.
-
The Filled Map visual can be useful if you have specific, well-formed regions in your data such as Counties. It symbolises these regions based on the data to create choropleth maps.
-
The preview feature Shape Map Visual is a more general case of the Filled Map. It allows you to load in any existing, static map features in TopoJSON format and match your data to them to create powerful visualisations.
-
Although these can be used to show the location of the data in the world, it is harder to show it in its wider geographic context – for example overlaying the data against other geographic data or analysing its geographic distribution. If you want to understand the geographic context of data already in Power BI and ArcGIS cannot connect to those data sources directly, there are two options:
- It is often best to export data from Power BI as a CSV and load into ArcGIS, which allows a wealth of mapping and analysis options.
- If your data contains addresses or lat/long coordinates these can be mapped using the ArcGIS Maps for Power BI visualisation directly within Power BI, which is included by default with Power BI. Both the included and the premium version of this visualisation allow reference layers to be overlaid from ArcGIS on top of your business data, providing real-time geographic context. The symbolisation (colours/sizes) shown for the data locations is updated in real-time as the Power BI data source changes. If, instead of co-ordinates and addresses, your data contains Countries, Counties, UK Districts, Lower Super Output Areas, Postcodes or UK regions, then the visualisation will also show these correctly. To decide if you need the Free or Premium version, this video is useful. Note that at the moment, only Power BI Pro users can access dashboards using this visual.
Summary
In this article I have explained that there is no need to draw a distinction between ArcGIS and Power BI as two separate systems. They are instead two different ways of visualising the same data. If you want to know more about when an ArcGIS dashboard might be the right choice and when a Power BI dashboard might right choice, please talk to your existing contacts at Esri or email me at abranscomb@esriuk.com.
If you are an ArcGIS user already and have come across the ArcGIS Maps for Power BI plugin, remember that it is a powerful visualisation for data which is already in Power BI, but it is not a magic way to allow your ArcGIS data to be used in other Power BI visualisations – because no magic is needed!
And finally, to see some of this in action we’ve also created a video.
Appendix
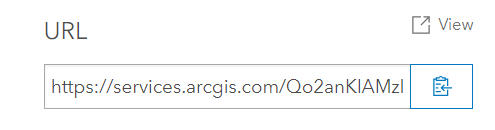
Since we are accessing via an API, some very basic knowledge of query parameters and the ArcGIS API is required. In my ArcGIS Online item, I navigate to the services URL:
I edit the query parameters to retrieve:
-
-
All rows of data
-
All fields
-
No geometry (since most Power BI visualisations typically cannot sensibly use the geometry - but the map-based ones can of course use points)
-
The resulting URL looks like this:
Now we use this URL as the data source in Power BI. Although this seems like a long process, these steps are normal practice when designing queries for Power BI.
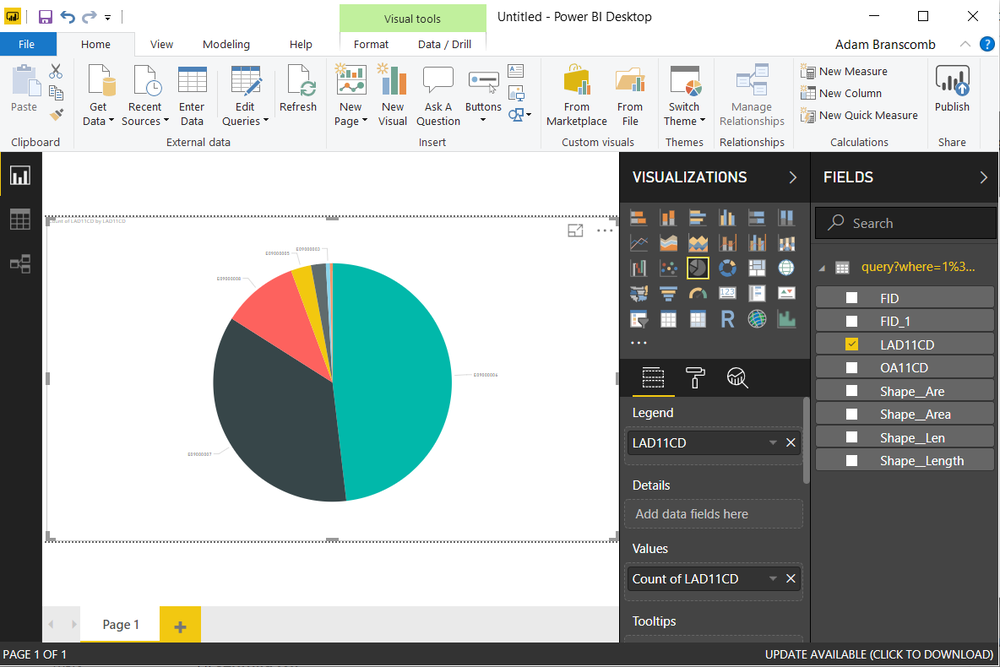
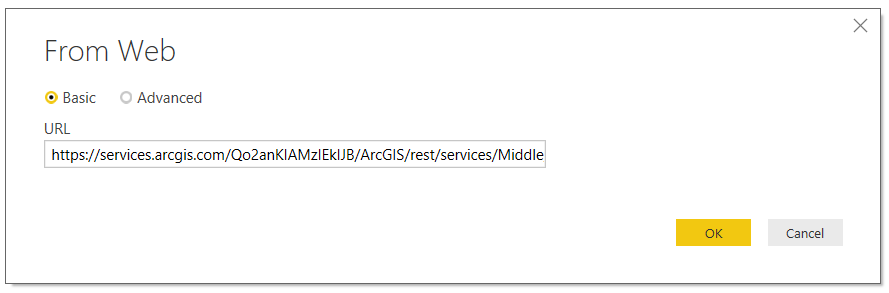
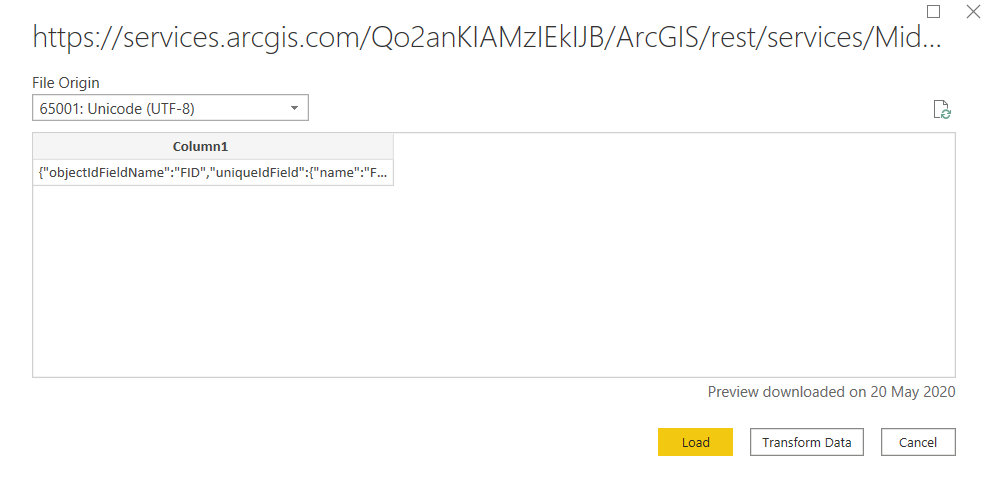
In Power BI desktop, Get data using the Web option. Enter the URL above as shown below:
If you have not used this web API before in Power BI, you will be prompted to configure authentication options at this point. If the data in ArcGIS is secured, there are various methods to ensure Power BI can connect to the secure data, such as generating tokens or using URL referrers (limit usage). However, you must ensure that you do not share secure data more widely than your ArcGIS named user licences allow.
If your data can be accessed anonymously, then these methods are not required. In this example I access an ArcGIS Online hosted feature service which is shared publicly. So I just click Connect, leaving the default option of anonymous access.
Power BI will then display a dialog like the one below. Hit Transform Data as we need to tell Power BI a little bit about the JSON so it knows how to handle it.
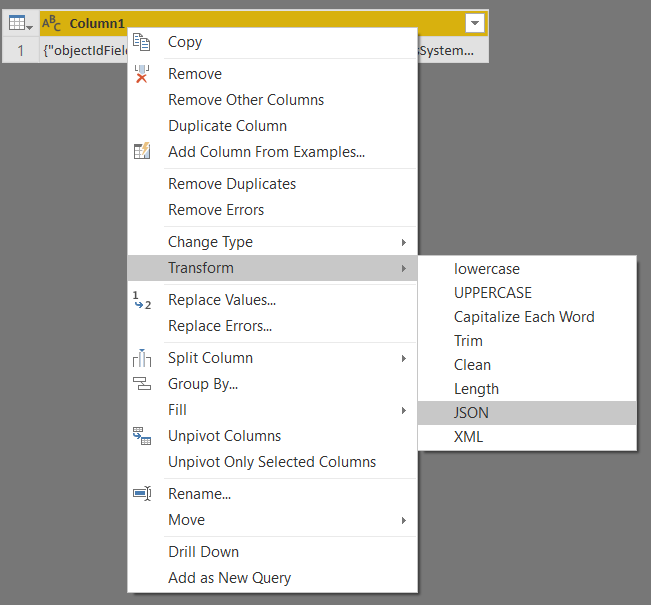
First, if Power BI has not recognized it as JSON, force it using the Transform option as shown below:
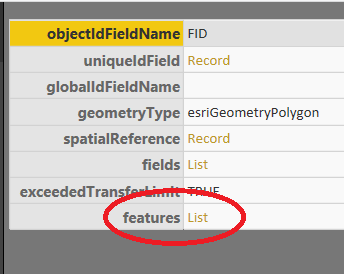
Then drill into the record, and drill into the Features list :
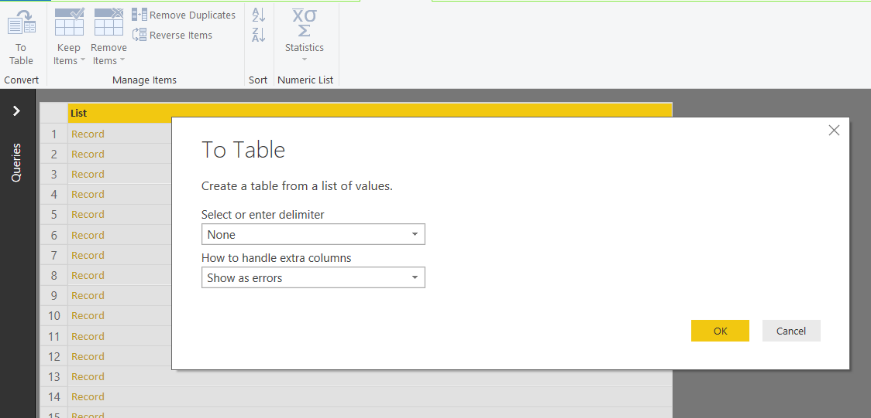
When you see a list of Records, press To Table and hit OK on the dialog below:
Then use the Expand button (see screenshot) and uncheck the Use Original Column Name as prefix:
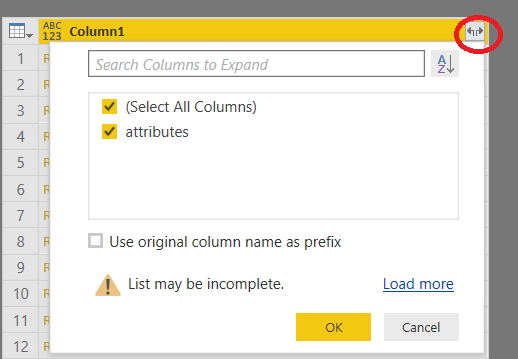
Then use the Expand button again to expand the Attributes. At this point your data should appear. Press OK the press Close and Apply. Your data is now in Power BI ready to use in Visualisations.