I’m not a developer. Until recently, I’d never so much as looked at a line of code, let alone attempted to write some myself. I assumed that without a computer science degree, there was no point even trying. When struggling to format a pop-up correctly one day, a colleague of mine suggested I use Arcade. With only a couple of lines of simple code, I could display my text exactly as I wanted, without having to recreate all of my fields from scratch. Maybe coding didn’t have to be as hard as I thought.
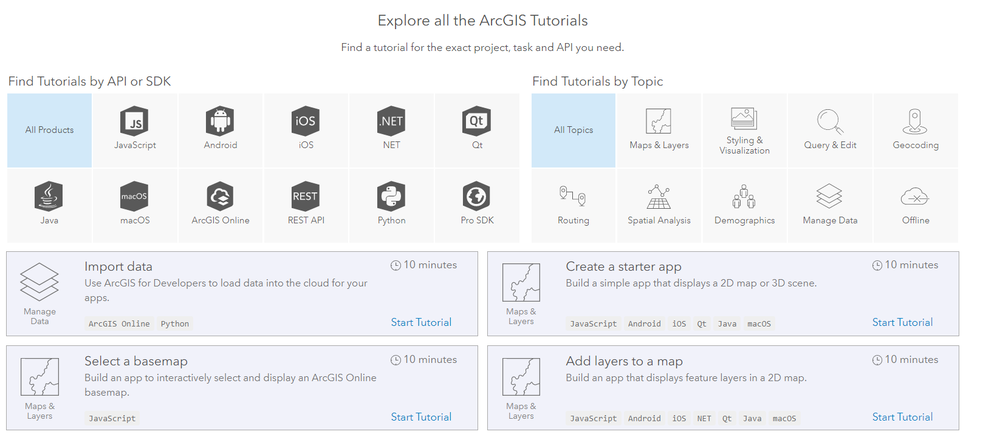
I was then introduced to the ArcGIS Developer Tutorials. A whole suite of labs designed so that you can create real results from writing code in less than 15 minutes a pop. I’m going to show you how I used these tutorials to make my first (very basic) app using the ArcGIS Maps SDK for JavaScript. Hopefully, this will encourage anyone who is hesitant to take their first steps into the world of developers. If I can do it, then you definitely can.
As the Data Curator at Esri UK, I wanted to base my app around a layer from the Living Atlas. The Living Atlas, if you didn’t already know, has a huge wealth of GIS-ready datasets for you to use in your own maps and analysis as part of your ArcGIS Subscription. I chose the Geolytix Retail Points layer, which is a single layer containing every supermarket in the UK. Using this and the Developer Tutorials, I planned to create a simple web app where users could search for locations and see nearby supermarkets.
Step 1 – Create the starter app
With zero idea of how to start, this first tutorial provided me with an app template in Codepen that has the basic HTML set out, adds the CSS and API references, and creates a simple 2D map view. I simply took a ‘fork’ of the existing app that I could then edit to be my own. This was a great way to get me up and running without any prior knowledge.
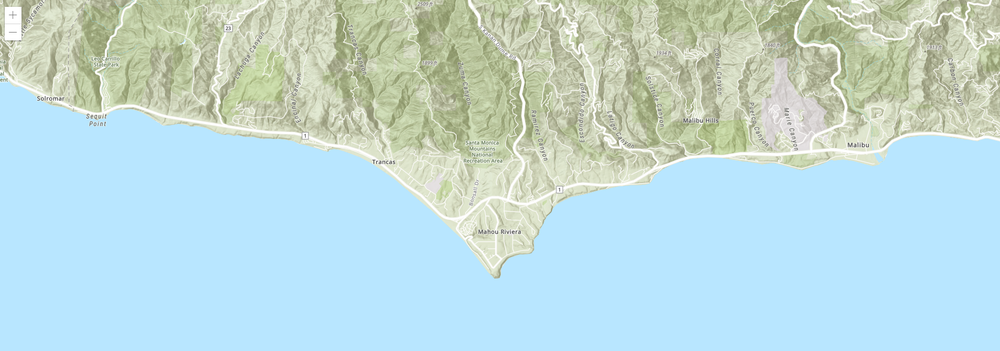
The simple tutorial app.
However, I want my app to focus on the UK, not California. Not a problem, just a few tweaks to the tutorial code allowed me to change the ‘centre’ point of my map and adjust the zoom so that I could see London in my map view.
//Create the mapview centred on London
  var view = new MapView({
        container: "viewDiv",
        map: map,
        center: [-0.1,51.5],
        zoom: 13
Here’s the result:
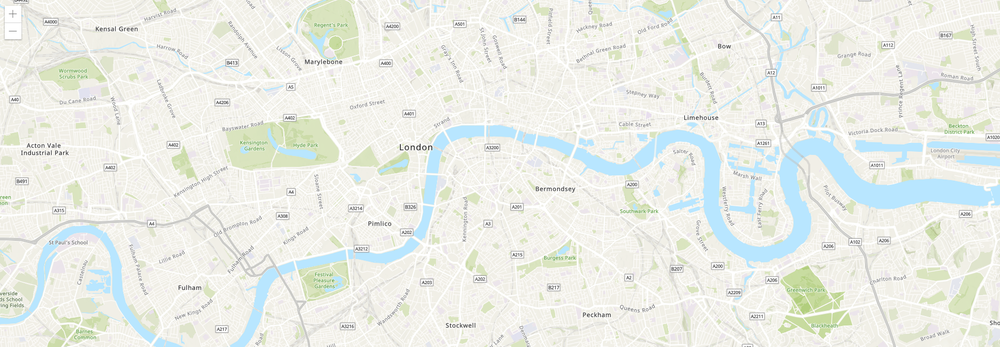
The app with a re-centered map.
With me so far?
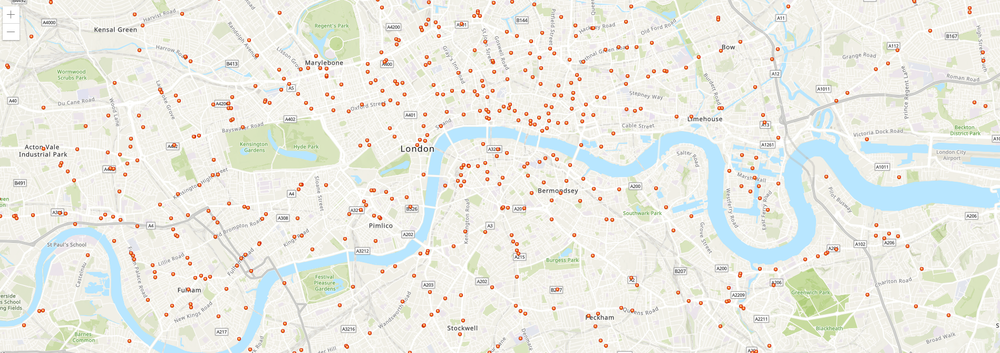
The app now shows supermarket locations.
This is great but I’m not a huge fan of the default symbology.
Step 3 – Add symbology
I wanted to make the points a bit bigger and colour them according to what retailer they are to make the map a little more user-friendly. To do this, I needed to add some extra code in before my feature layer variable. I created new variables for each of the different supermarkets, setting their type as “simple-marker” and setting their colour with a hex code to match their branding. I also created an ‘other’ variable with grey colouring to encompass some of the lesser known supermarket brands so that the resulting map wouldn’t be too busy.
  // Symbol for tesco
    var tesco ={
      type: "simple-marker",
      color: "#00529f",
    };

// ***repeat for other supermarkets***
I then defined a uniqueValueRenderer based on the field ‘retailer’. I set the defaultSymbol to my ‘other’ value, then outlined the rest of the supermarket variables I’d already created in the uniqueValueInfos.
      // Define a unique value renderer for the supermarkets
      var supermarketsRenderer = {
       type: "unique-value",
          field: "retailer",
        defaultSymbol: other,
        uniqueValueInfos:[
          {
            value: "Tesco",
            symbol: tesco
          },

// ***repeat for other supermarkets***

};
Make sure to add the renderer to your feature layer variable. I added in an opacity of 0.75 to make the layer a bit less harsh on the eyes and allow you to see some detail of the map through the points.
   // Create the supermarkets layer
      var supermarkets = new FeatureLayer({
        url: "https://services8.arcgis.com/3ArZhpXFARDixnL2/arcgis/rest/services/Geolytix_Retail_Points_Q4_2018/FeatureServer",
        renderer: supermarketsRenderer,
        opacity: .75,
    });
Here’s the final symbology:
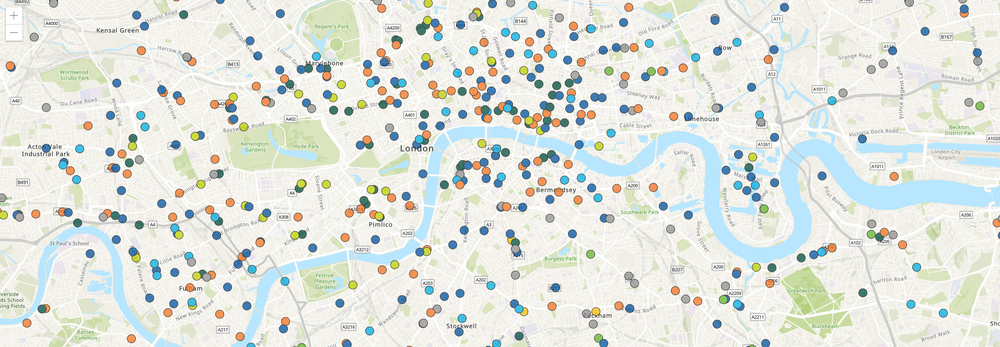
Extending the app with a unique value renderer.
Step 4 – Configure Pop Ups
Next, I wanted to create pop-ups so that users could interact with the map and get more information, such as an address. I followed this tutorial to create the pop-up variable, using the appropriate field names from the Geolytix layer to create the title and content.
 //Create pop-up variable
    var popupsupermarket ={
       "title": "",
        "content": "
    ;
I then added the pop-up template to the feature layer variable after the renderer.
// Create the supermarkets layer
      var supermarkets = new FeatureLayer({
        url: "https://services8.arcgis.com/3ArZhpXFARDixnL2/arcgis/rest/services/Geolytix_Retail_Points_Q4_2018/FeatureServer",
        renderer: supermarketsRenderer,
        opacity: .75,
        popupTemplate: popupsupermarket
    });
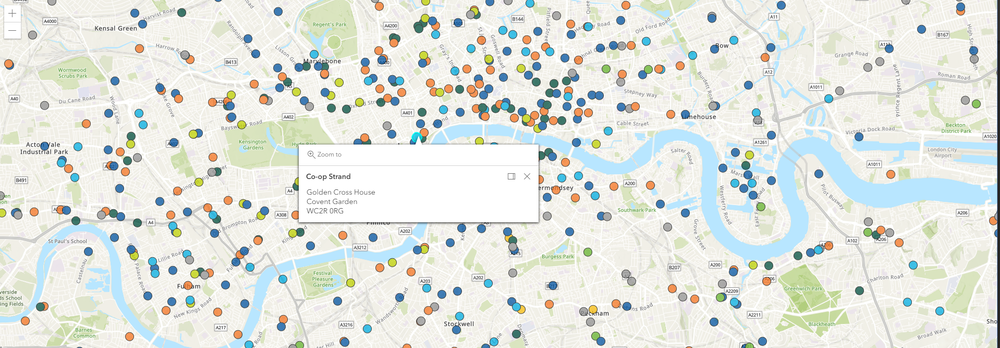
With added pop-ups.
Our app is almost there! Finally, I want users to be able to search for an address or location and see nearby supermarkets.
Step 5 – Add Search widget
Following the tutorial exactly here, I added the search module into the require statement at the start of my code.
 require([
      "esri/Map",
      "esri/views/MapView",
      "esri/layers/FeatureLayer",
      "esri/widgets/Search"
    ],
    function(
      Map,
      MapView,
      FeatureLayer,
      Search
    )
At the end of the code in the main function, I created the search widget and added it to the top right corner of the view.
      // Search widget
      var search = new Search({
        view: view
      });

      view.ui.add(search, "top-right");
Now I can search for locations and see nearby supermarkets on my map.
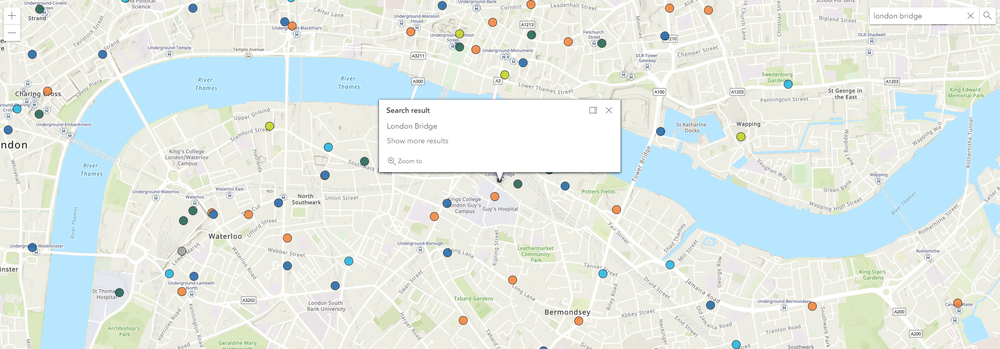
My simple app with an added layer, enhanced symbology, pop-ups and a search widget.
I know it’s very simple, but for someone who has never touched JavaScript before, it’s an exciting start! I hope this has encouraged you to take a look at the Developer Tutorials and have a go yourself. Here’s the full codepen project if you want to see the whole thing working together. Feel free to take a fork and start playing around with your own configuration.