The makeup of our cities plays a key role in our day to day lives and how we interact with our environment. To get a better understanding of where we live, we’ll be exploring what land cover our cities consist of using the new datasets that have recently been added to ArcGIS Living Atlas of the World.
Are they all urban jungles? Or is there a lot of greenspaces amongst the buildings? Let’s find out!
ESA Land Cover
The first dataset we’ll be exploring is the 10-metre resolution WorldCover from the European Space Agency (ESA) for 2020. This highly accurate dataset combines optical images from the Copernicus Sentinel-2 satellites as well as cloud penetrating radar data from Sentinel-1 to cover the whole globe every 5 days! This dataset can used for a whole range of applications, such as food security, carbon assessment, biodiversity monitoring and much more. For more information, check out this great video from the ESA.
Having this quantity of data at my fingertips is great but tasked me with a difficult question, what cities do I choose?
Fortunately, this decision was made easy for me by the recent Jubilee celebrations. What better way to celebrate the latest civic honours than taking a look at the land cover for the new cities? Although eight cities in total were announced as part of the celebrations, I decided to focus on four cities: Dunfermline, Bangor, Wrexham, and Milton Keynes – one from each country. To determine the city boundaries, I used the Office for National Statistics 2021 Wards layer. As there was no definitive city boundary I combined wards that were either named after the city or covered the general area.
Dunfermline
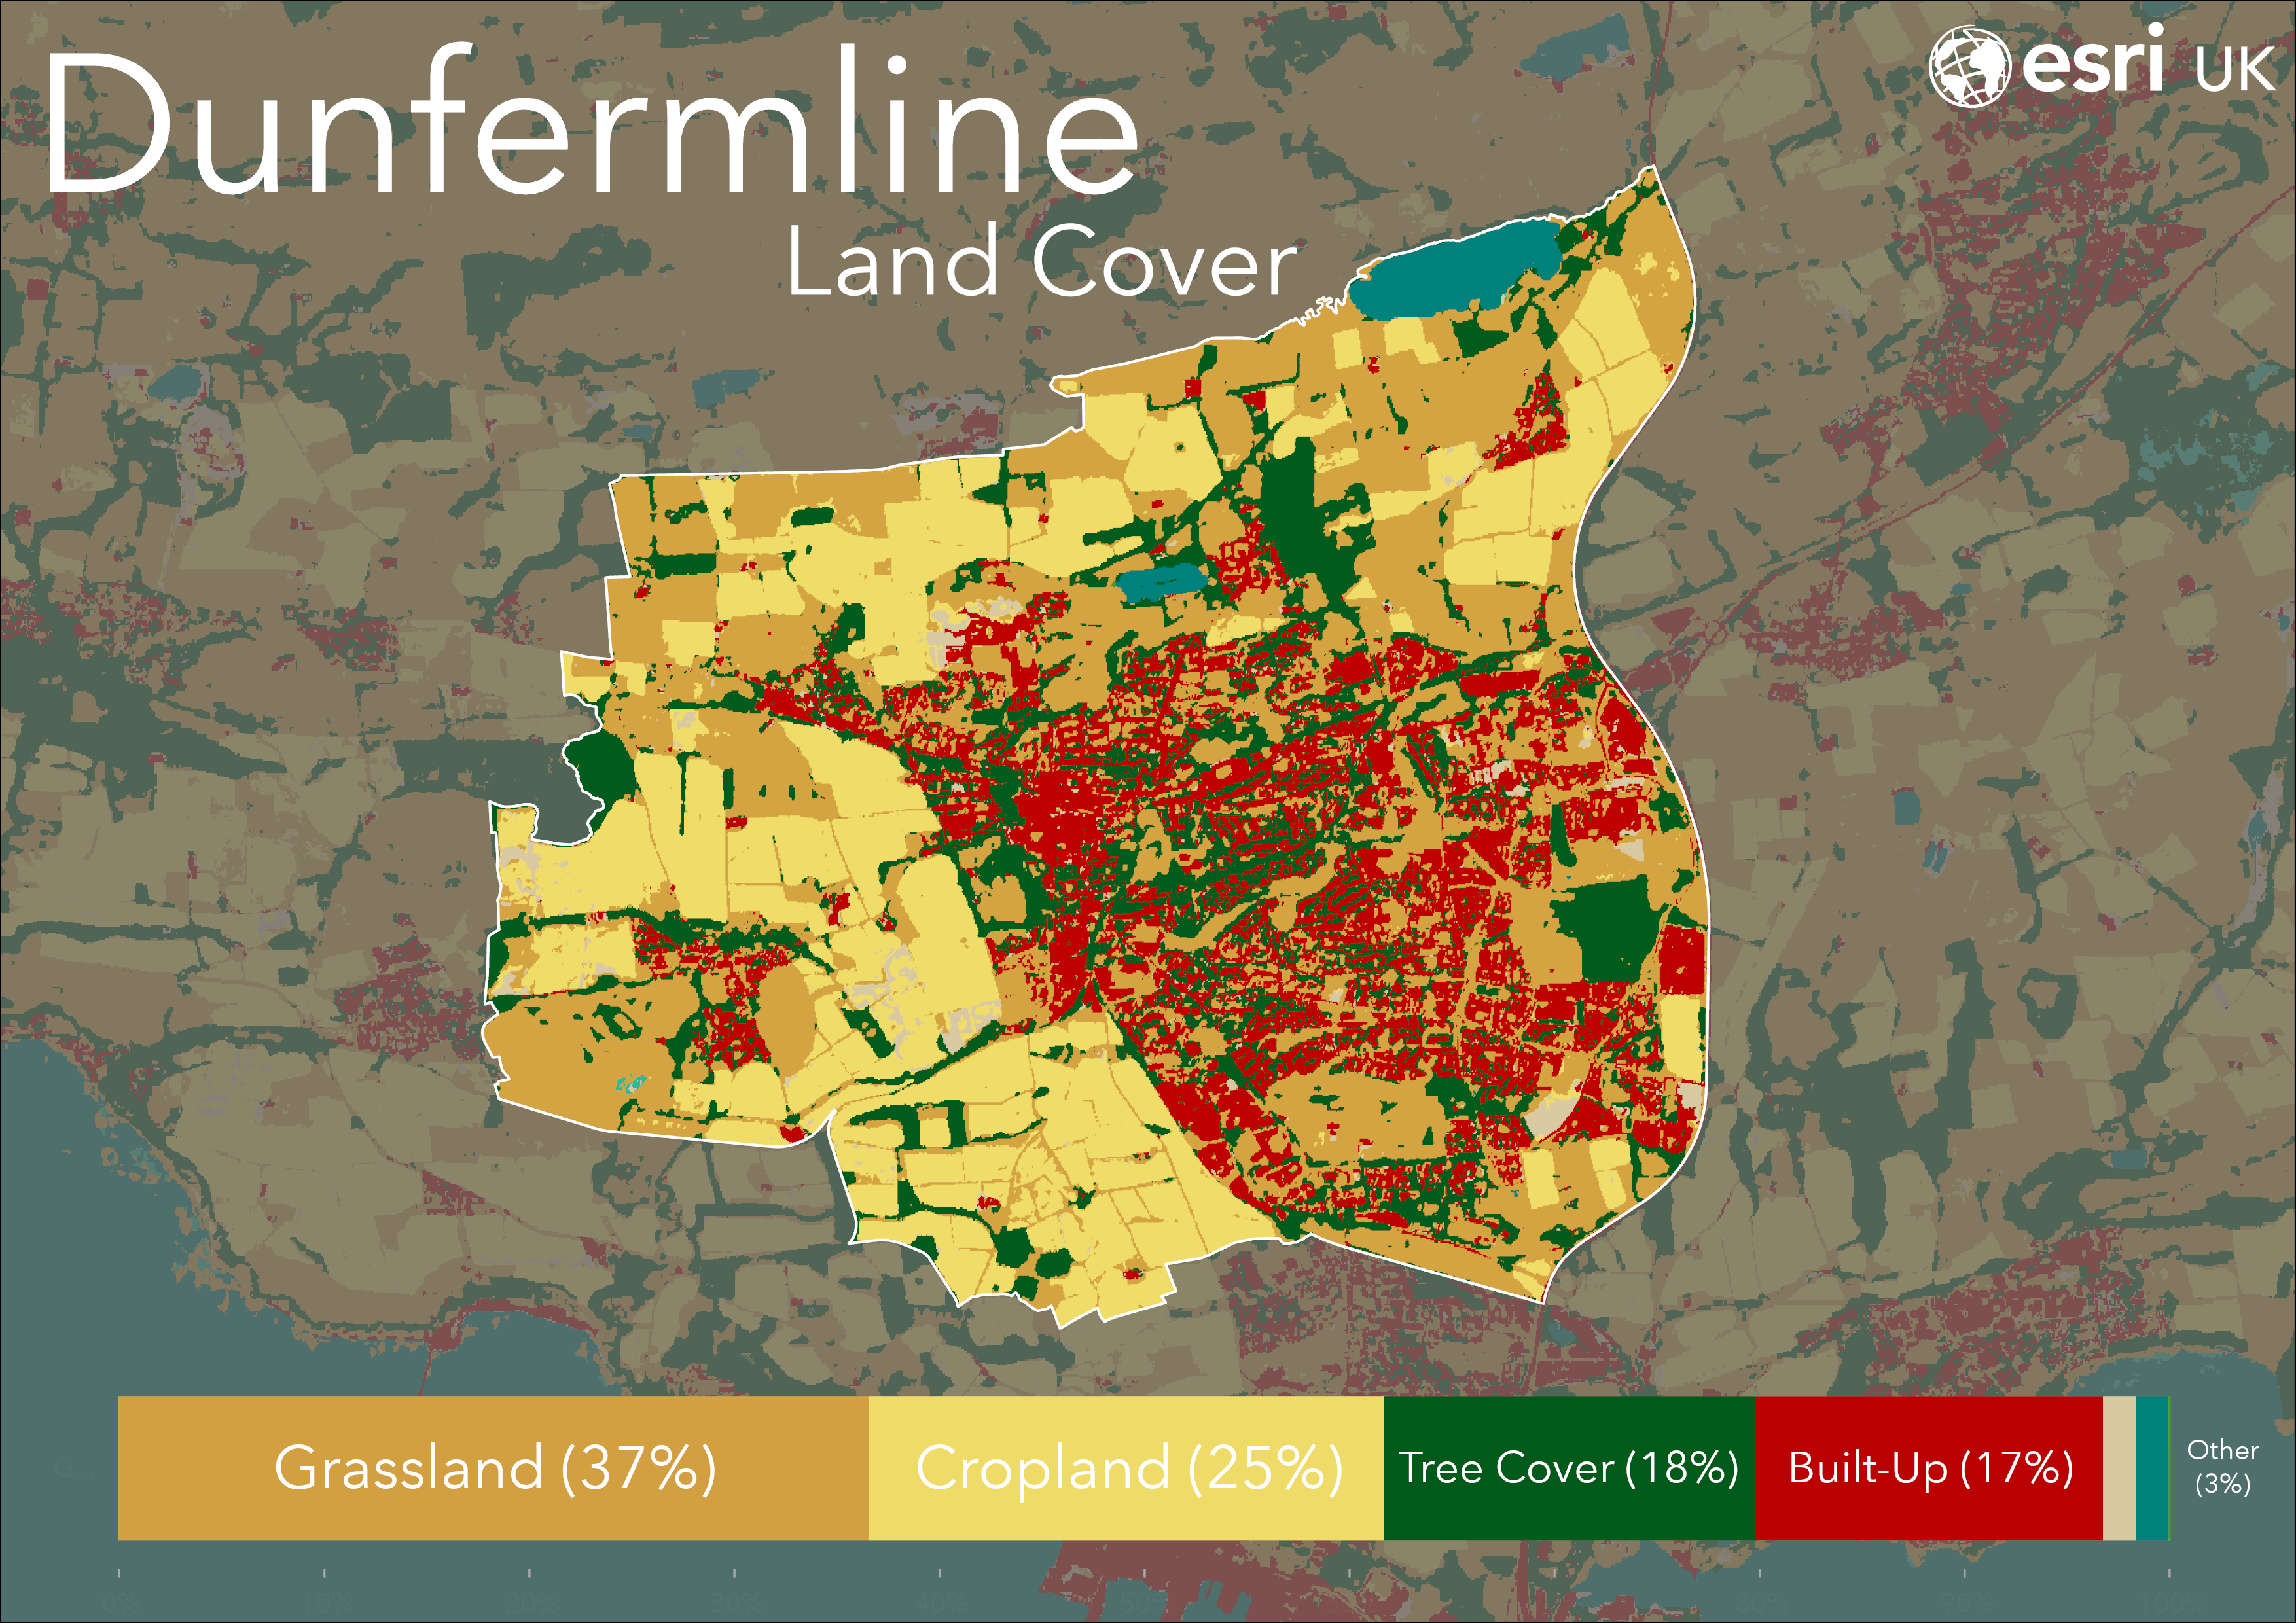
Dunfermline officially becomes Scotland’s eighth city and is known among other things as the resting ground for the former King of Scots, Robert the Bruce. With a population of approximately 60,000 the city and its surrounding is extremely green and rural, with just 17% of land cover being built-up areas. Calais Muir Woods to the East and Townhill Country Park to the North provide the city with big areas of tree cover, but at 37% grassland is the predominant land cover type.
Bangor
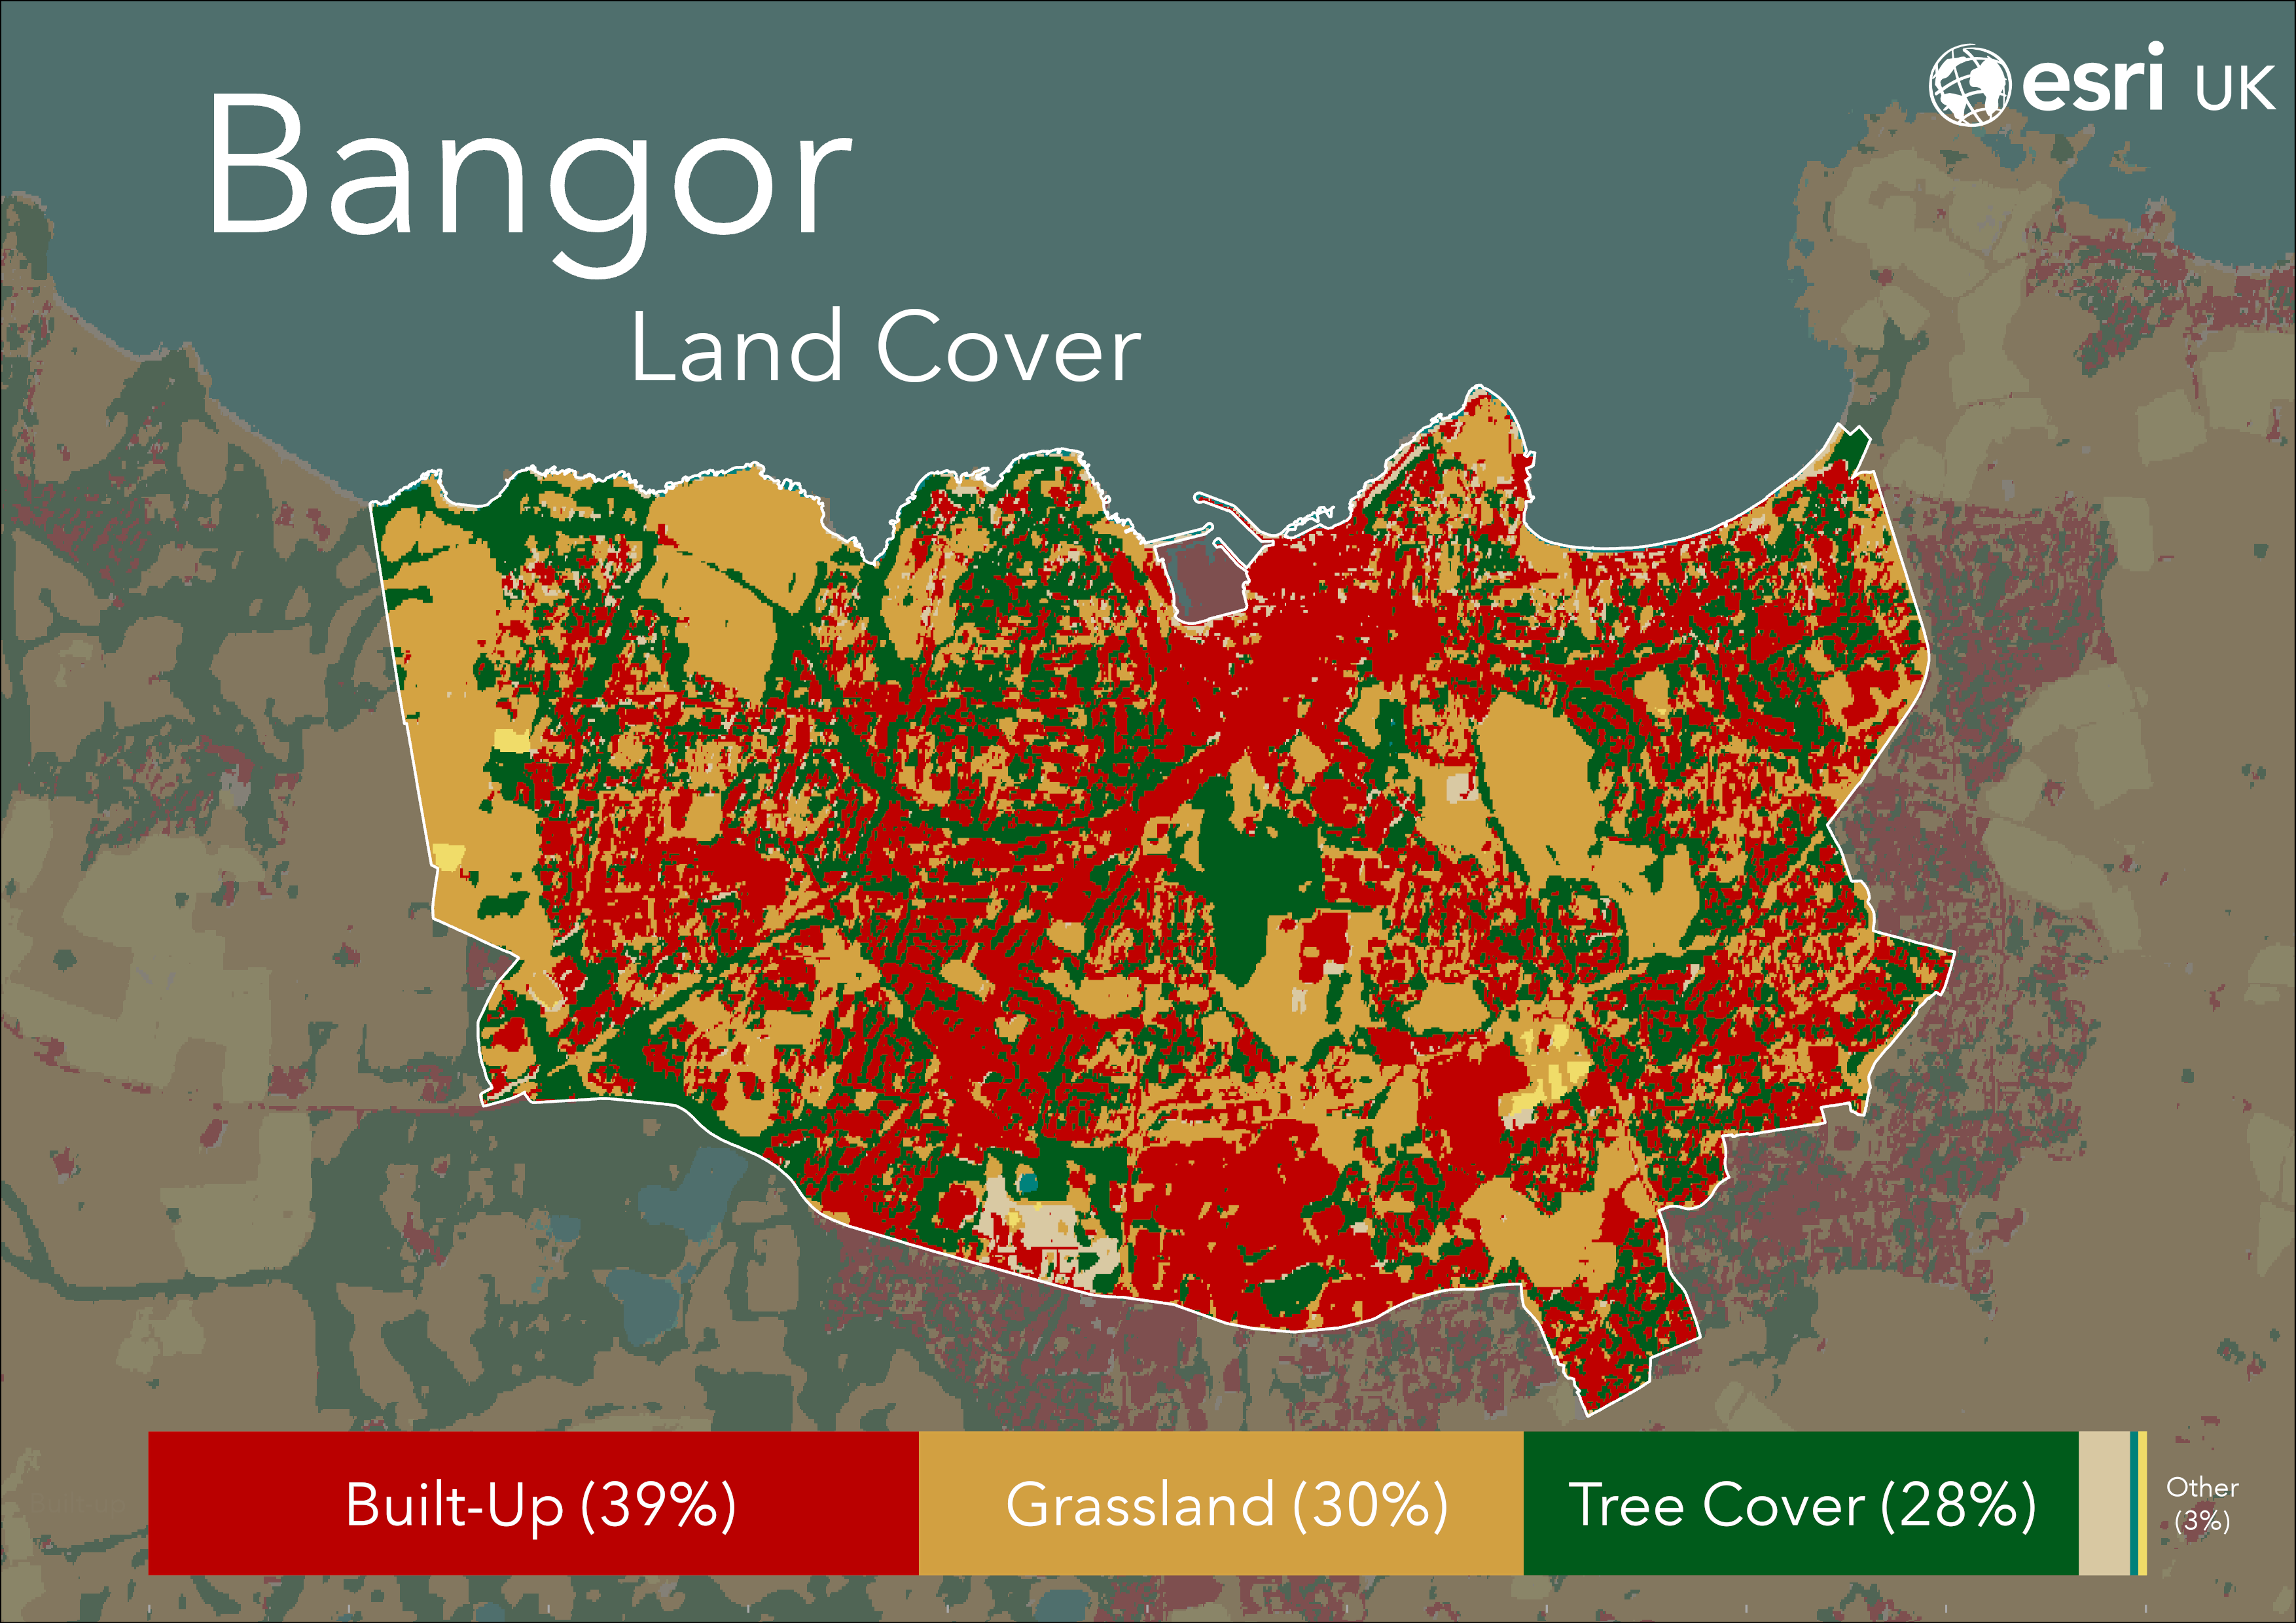
Bangor was a former Victorian seaside town and a key site during the Second World War due to its location at the mouth of the Belfast Lough. Its rich history was a deciding factor in granting it city status. The city is predominantly built-up area (39%), but grassland (30%) and tree cover (28%) are not far behind. Castle Park in the centre of the city is home to Bangor Castle, which was visited by the Queen and Duke of Edinburgh in 1961. The eagle-eyed readers may be wondering what the built-up area outside the city boundary is to the North. This is the award-winning Bangor Marina, and due to its popularity throughout the year it has been classed as a built-up area!
Wrexham
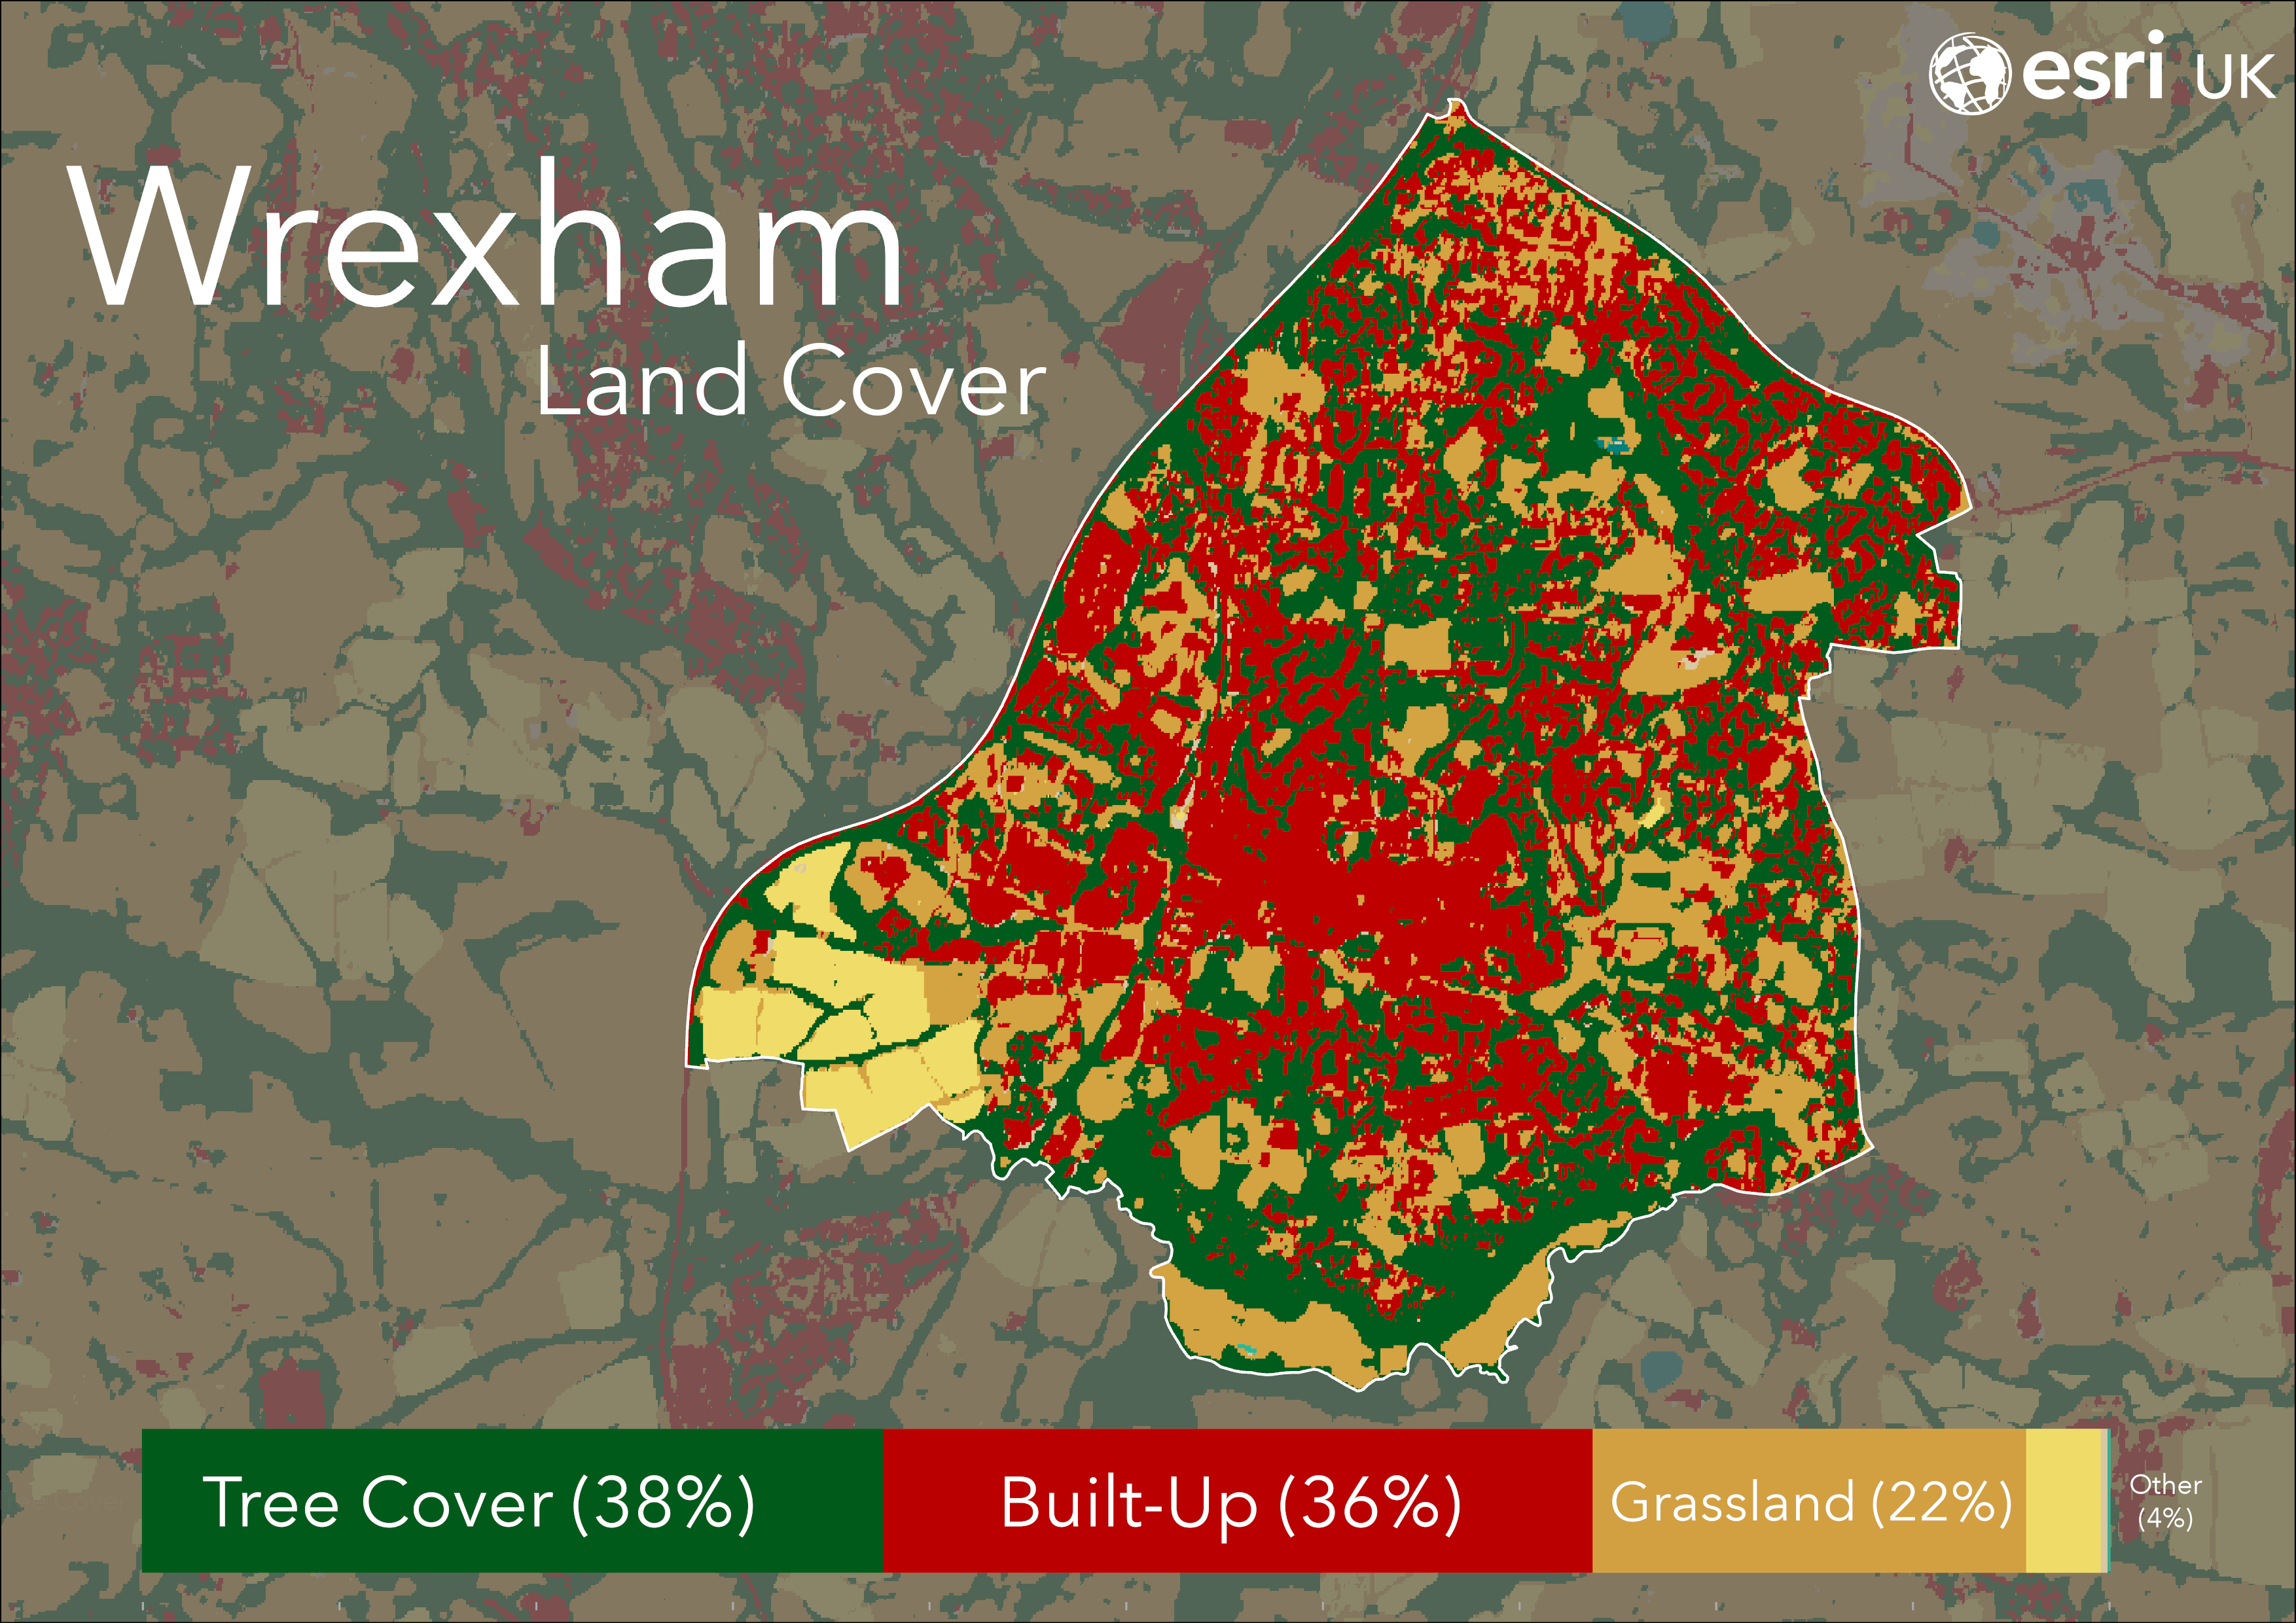
 To North Wales next with the 7th Welsh city! Believed to be founded before the 11th Century, Wrexham played a major role in the Industrial Revolution as well as being home to one of the oldest professional football teams in the world which is over 150 years old. The centre is particularly built up, but it is sandwiched between large areas of tree cover. To better understand the green spaces I used one of the National Trust layers in Living Atlas and discovered that the area to the South includes Erddig Parkland, a National Trust site.
Milton Keynes
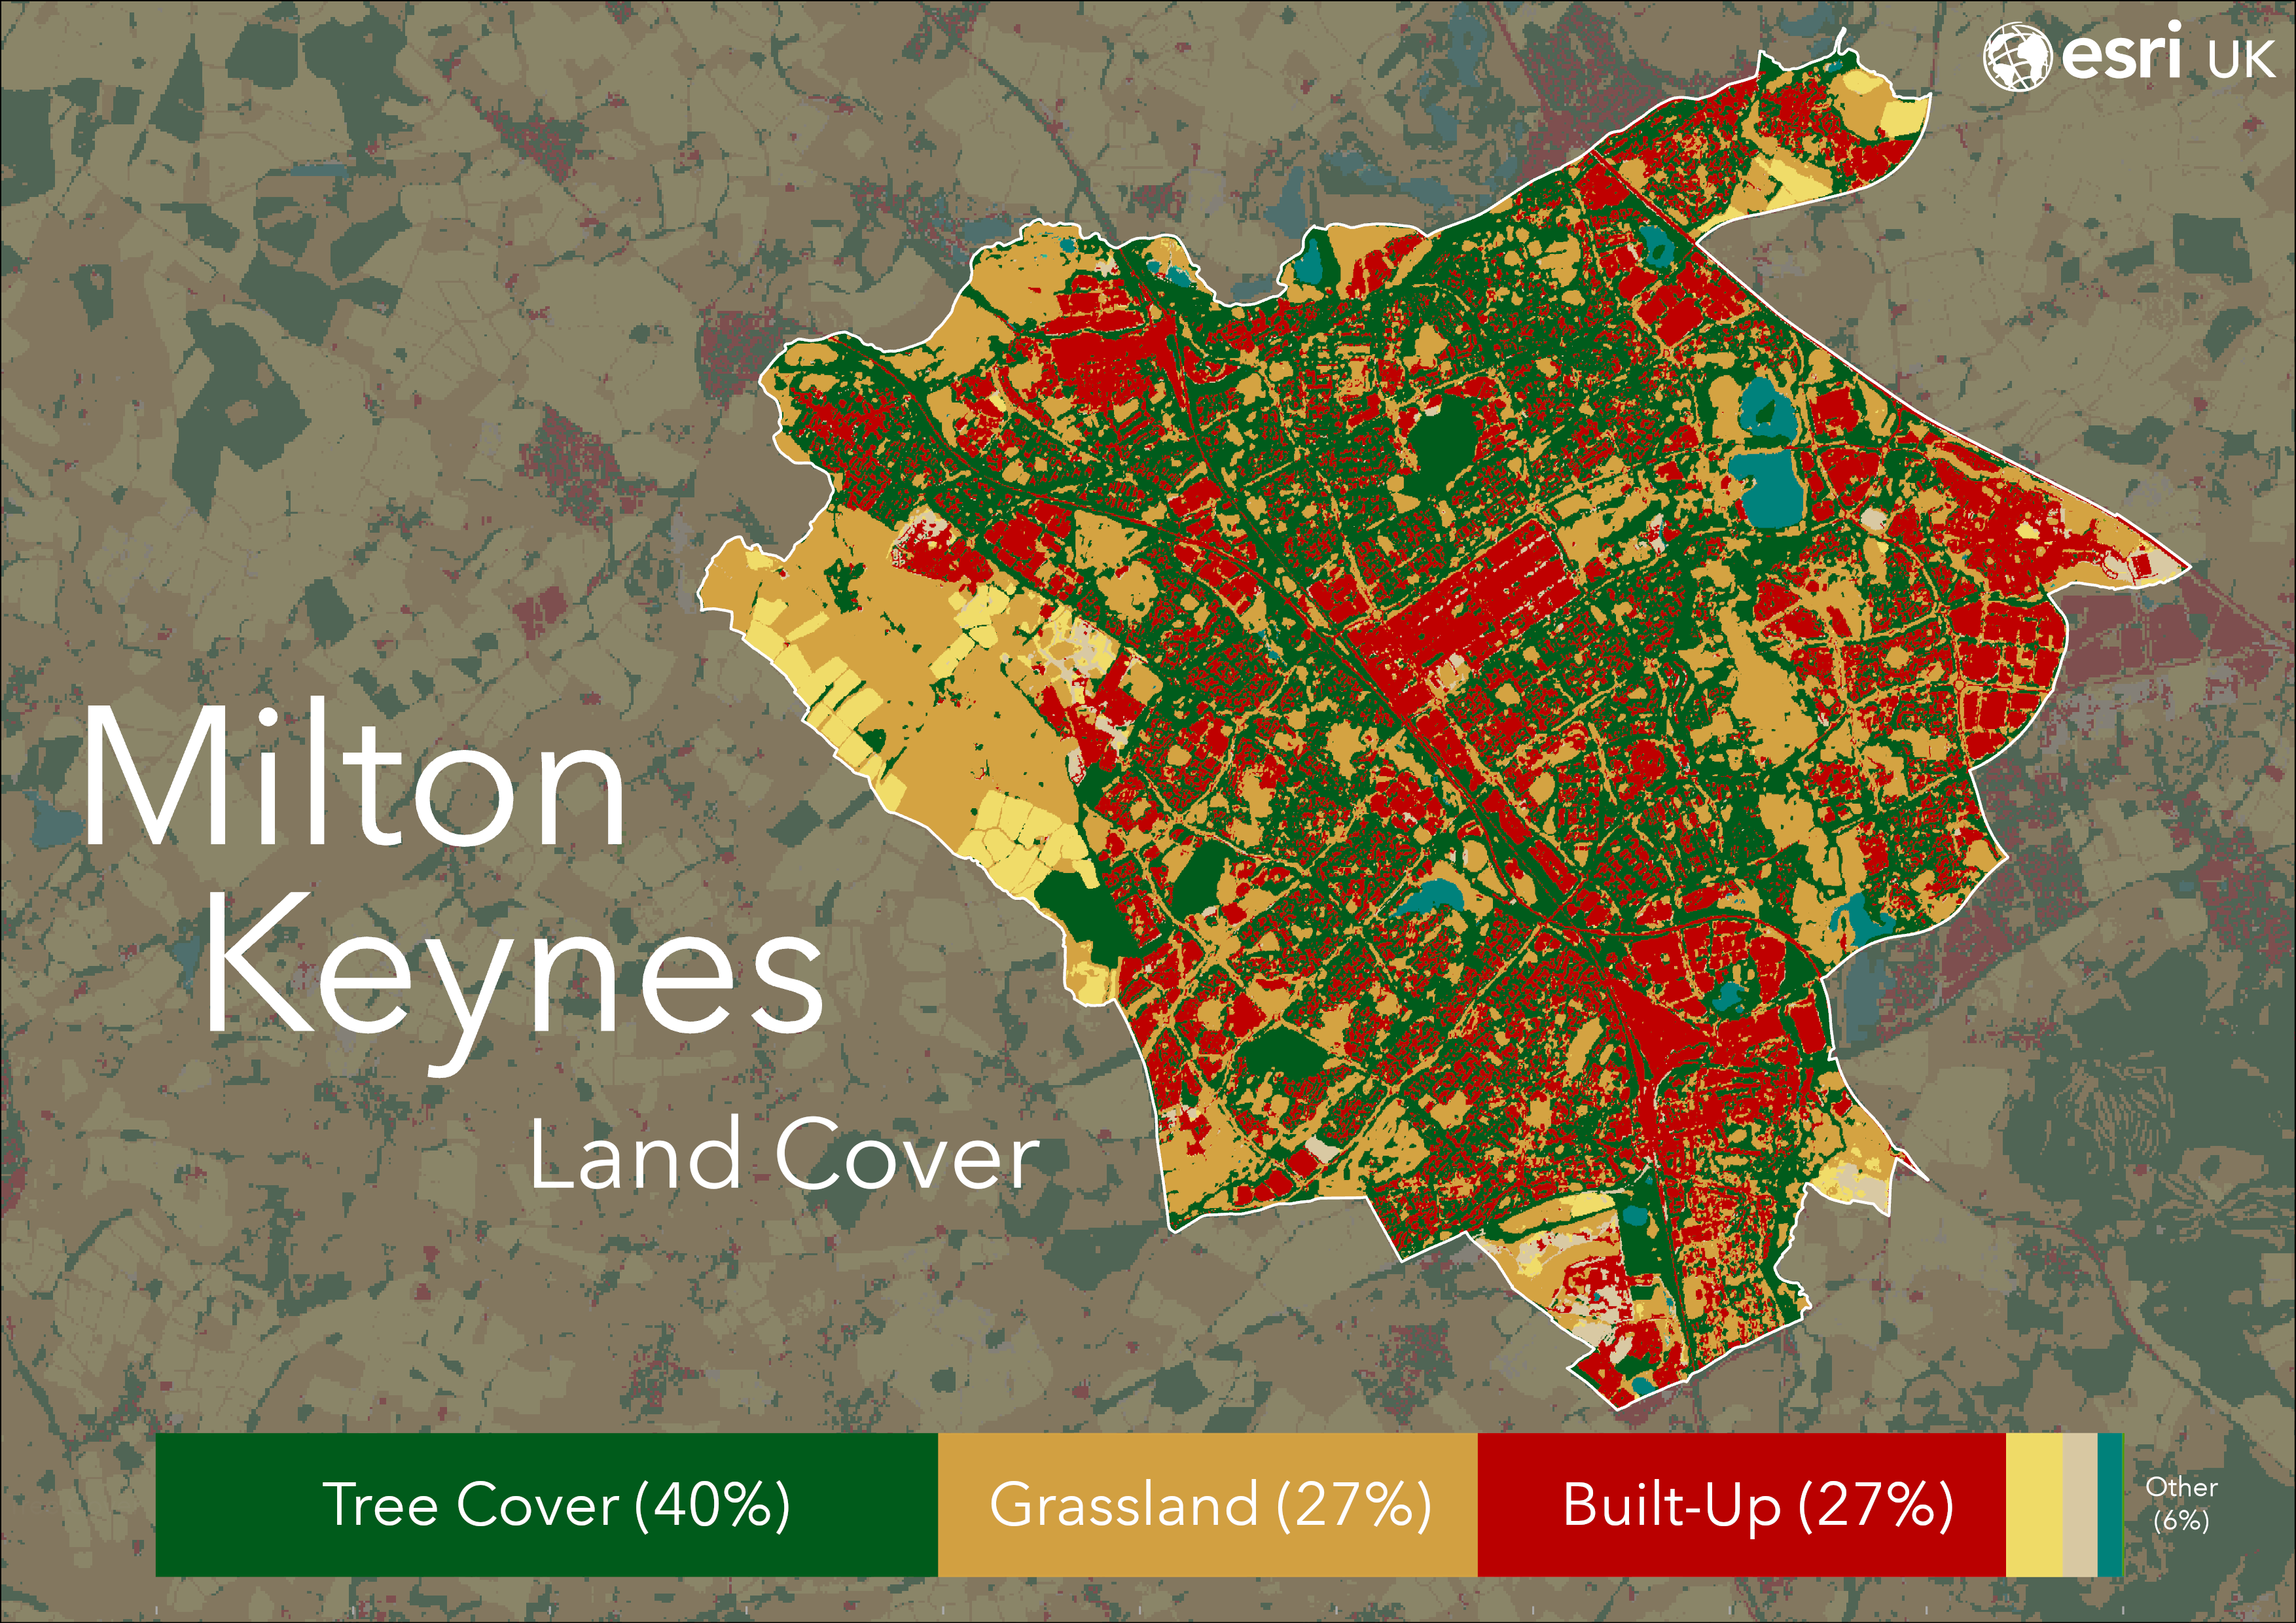
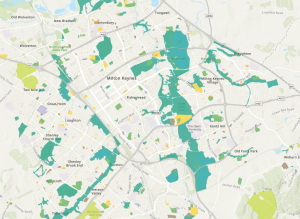
Last but certainly not least we have the newest settlement on the list, Milton Keynes, which was created in 1967 to try and ease the stress on London housing. The planned layout of the city aimed to ease traffic and focus on a forest city, which appears to have worked as tree cover is the largest land type coming out at 40%. By using the OS Open Greenspace layer in Living Atlas I found out that the linear line of tree cover and grassland to the east of the centre is a mixture of lakes and the Ouzel Valley Park.
Sentinel timeseries
So we’ve taken a look at land cover for the new cities but now let’s go local and explore land cover change over time where you live. By using the new Sentinel-2 10-Meter data we can see how an area has changed over 5 years from 2017 to 2021. To create this temporal dataset, Esri partnered with Microsoft and Impact Observatory and utilised the AI for Earth/Planetary Computer to compile over 2 million Earth observations! We have also pre-processed a few layers to show the change in land use over the time period, these are all available here in Living Atlas.
To help you explore this data I have created a web application that lets you find where you live and see how it’s changed over the last 5 years.
I looked to see if there was any change around our head office in Aylesbury and found that there has been a lot of development in recent years. When comparing between 2020 and 2021 I noticed that there was a new built area on the outskirts to the West.
After a bit of research I discovered that this is actually ongoing construction work for the HS2 project that will link London to Birmingham with high speed railway! As time passes and construction continues it will be really interesting to see whether it’s possible to track progress on the project using the Sentinel-2 data.
I really enjoyed exploring these great additions to the Living Atlas and hopefully this has given you some ideas of your own on investigating land use. Now it’s time for you to go and explore and see how your area is evolving!
Want to learn more about ArcGIS Living Atlas of the World?
Why not visit the ArcGIS Living Atlas of the World to explore the thousands of authoritative content at your fingertips?
To keep up to date with other Living Atlas news, check out Esri’s blog and follow our dedicated Twitter account. Join Esri Community to connect with other Living Atlas users and share ideas, solutions and collaborate to solve problems with GIS.
If your organisation has authoritative datasets that would be a valuable addition to the platform, find out how to share them to Living Atlas in this StoryMap.
For any queries, please get in touch with DataCurator@esriuk.com.