Link charts complement the map view of your ArcGIS Pro project with a diagram that breaks down where and how things are related. In the map view, you present phenomena in a geographical display. A link chart, available in ArcGIS Pro 2.7, allows you to observe them relative to their connection to one another. These phenomena can be anything: places, events, people or objects. In link analysis, we refer to them as entities, and in this blog post we cover how to establish the connections between entities through a range of measures. We’ll dive into examples of complex link charts and the use of centrality analysis to interpret patterns in their structure. We will also demonstrate that, by using maps, we can reveal spatial connections that are otherwise invisible in a link chart!
A street gang allegory for link analysis
Imagine the following hypothetical scenario: we are crime investigators and we have a database of people convicted of offenses related to organised crime. We investigate their social networks and short-list the people we have reason to believe are also involved in illegal activities. We do this once more on the shortlisted folks to build up a network of suspects.
We could plot the offenders, their networks and their network’s networks, based on their home addresses. We might be able to identify some physical clusters of this organisation…
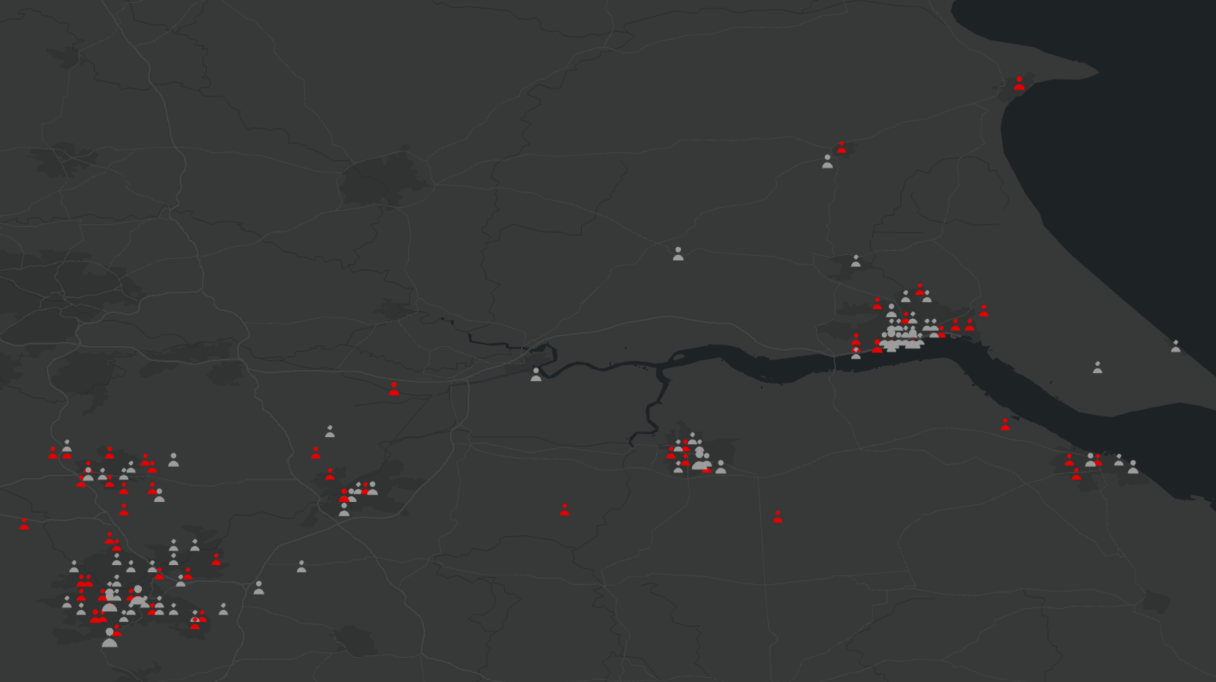
A map displaying members of a fictional criminal organisation, based on their home addresses. The members in red have been convicted for crimes, members in grey are suspects.
Members may be living in close proximity to one another, but that doesn’t necessarily mean that they have the strongest ties. If we plot them as entities in a link chart, we can begin to see the relative connectedness of every individual within the organisation:
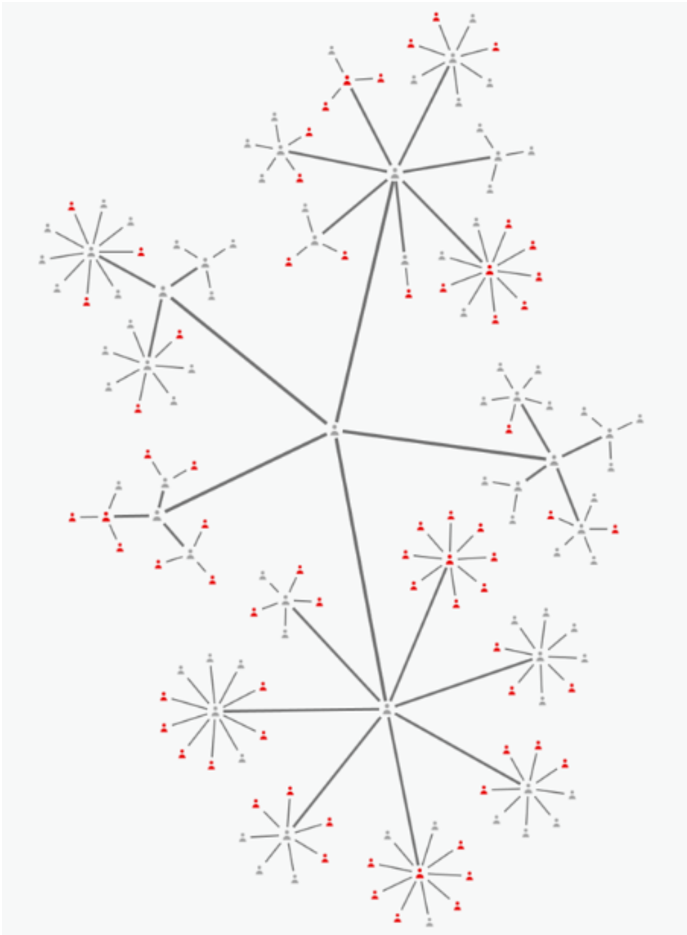
Link chart of members of a fictional criminal organisation.
Using centrality analysis to interpret a link chart
Centrality analysis helps find the most important and influential nodes in our network. Let’s see how a couple of types apply to this criminal organisation.
Degree centrality highlights nodes with the largest number of immediate connections. We can speculate that these are the figures that recruit and instruct the runners, the spotters, the enforcers, and the lowest rank street dealers.
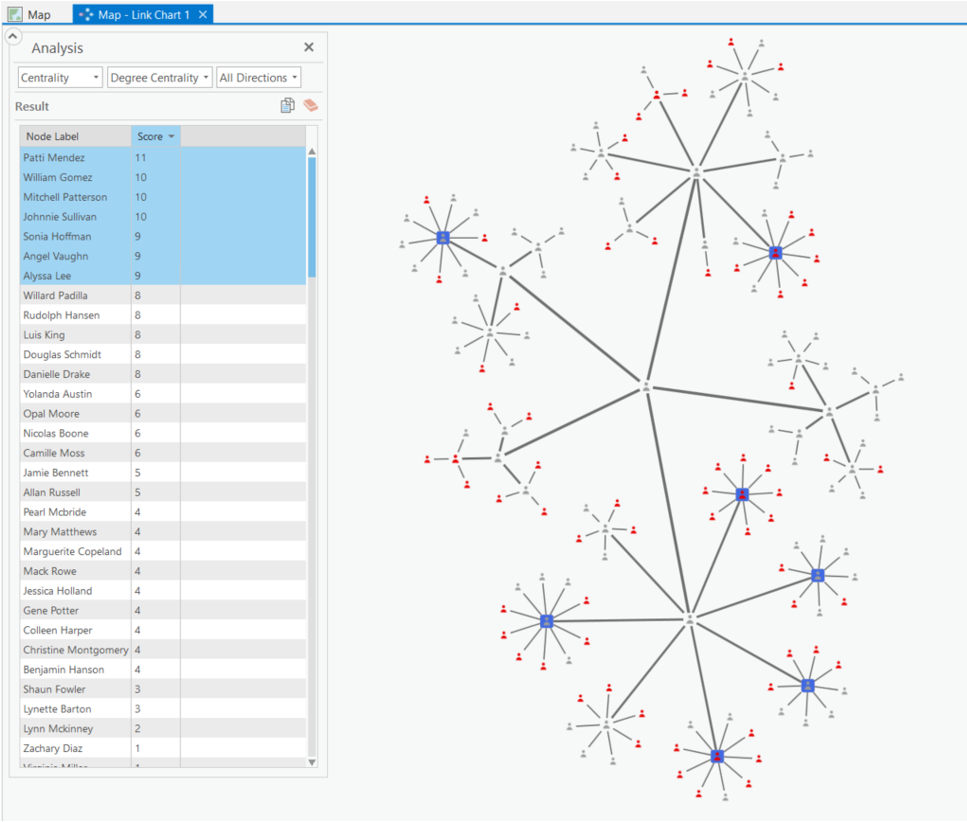
Degree centrality highlighting the nodes with the largest number of immediate connections in blue
With betweenness centrality we can identify people that act as connecting nodes to various cells (sub groups) in the network. These may be the leaders that oversee different departments of the organisation. Perhaps they’re in charge of the drug imports, distribution, finances, or exploitation. And at the top, central within the cluster of people of highest influence, sits our ‘godfather’ Alan pulling all the strings!
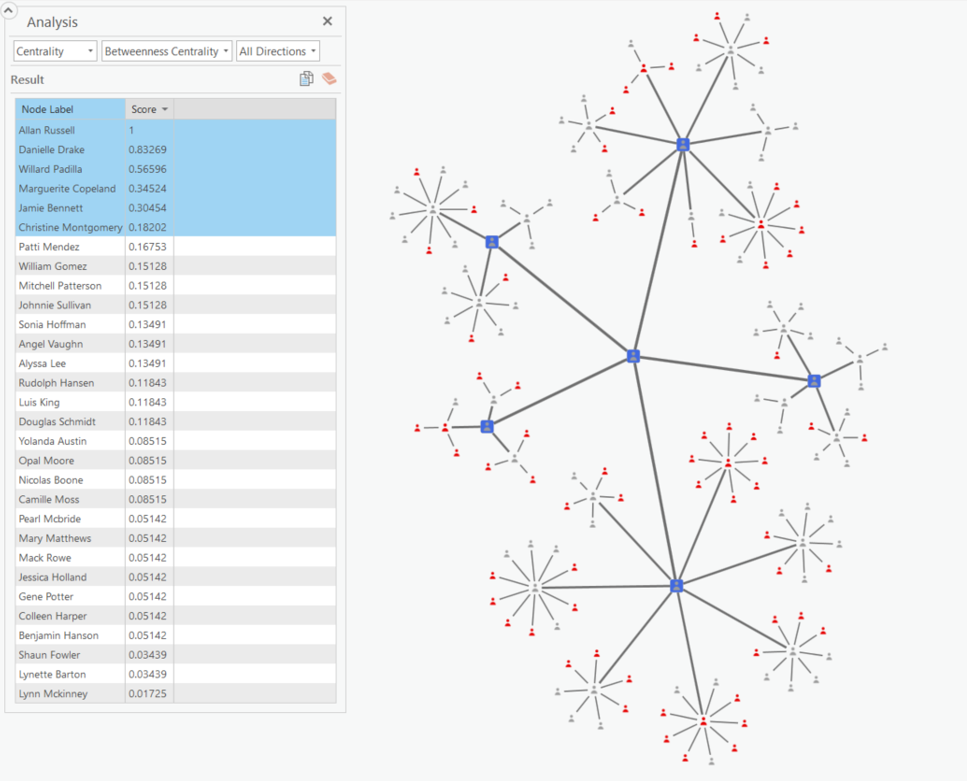
Betweenness centrality highlighting in blue the connecting nodes to various cells
Entities upon entities to capture more complexity
In reality, dismantling the hierarchy of a criminal organisation must require months or years of investigation. However, link analysis would be a wonderful tool to pull together the results – and doing this in ArcGIS Pro provides the benefit of the spatial perspective. Let’s return to that original database of criminal offenders and add the types of crimes they’ve committed as entities to the link chart:
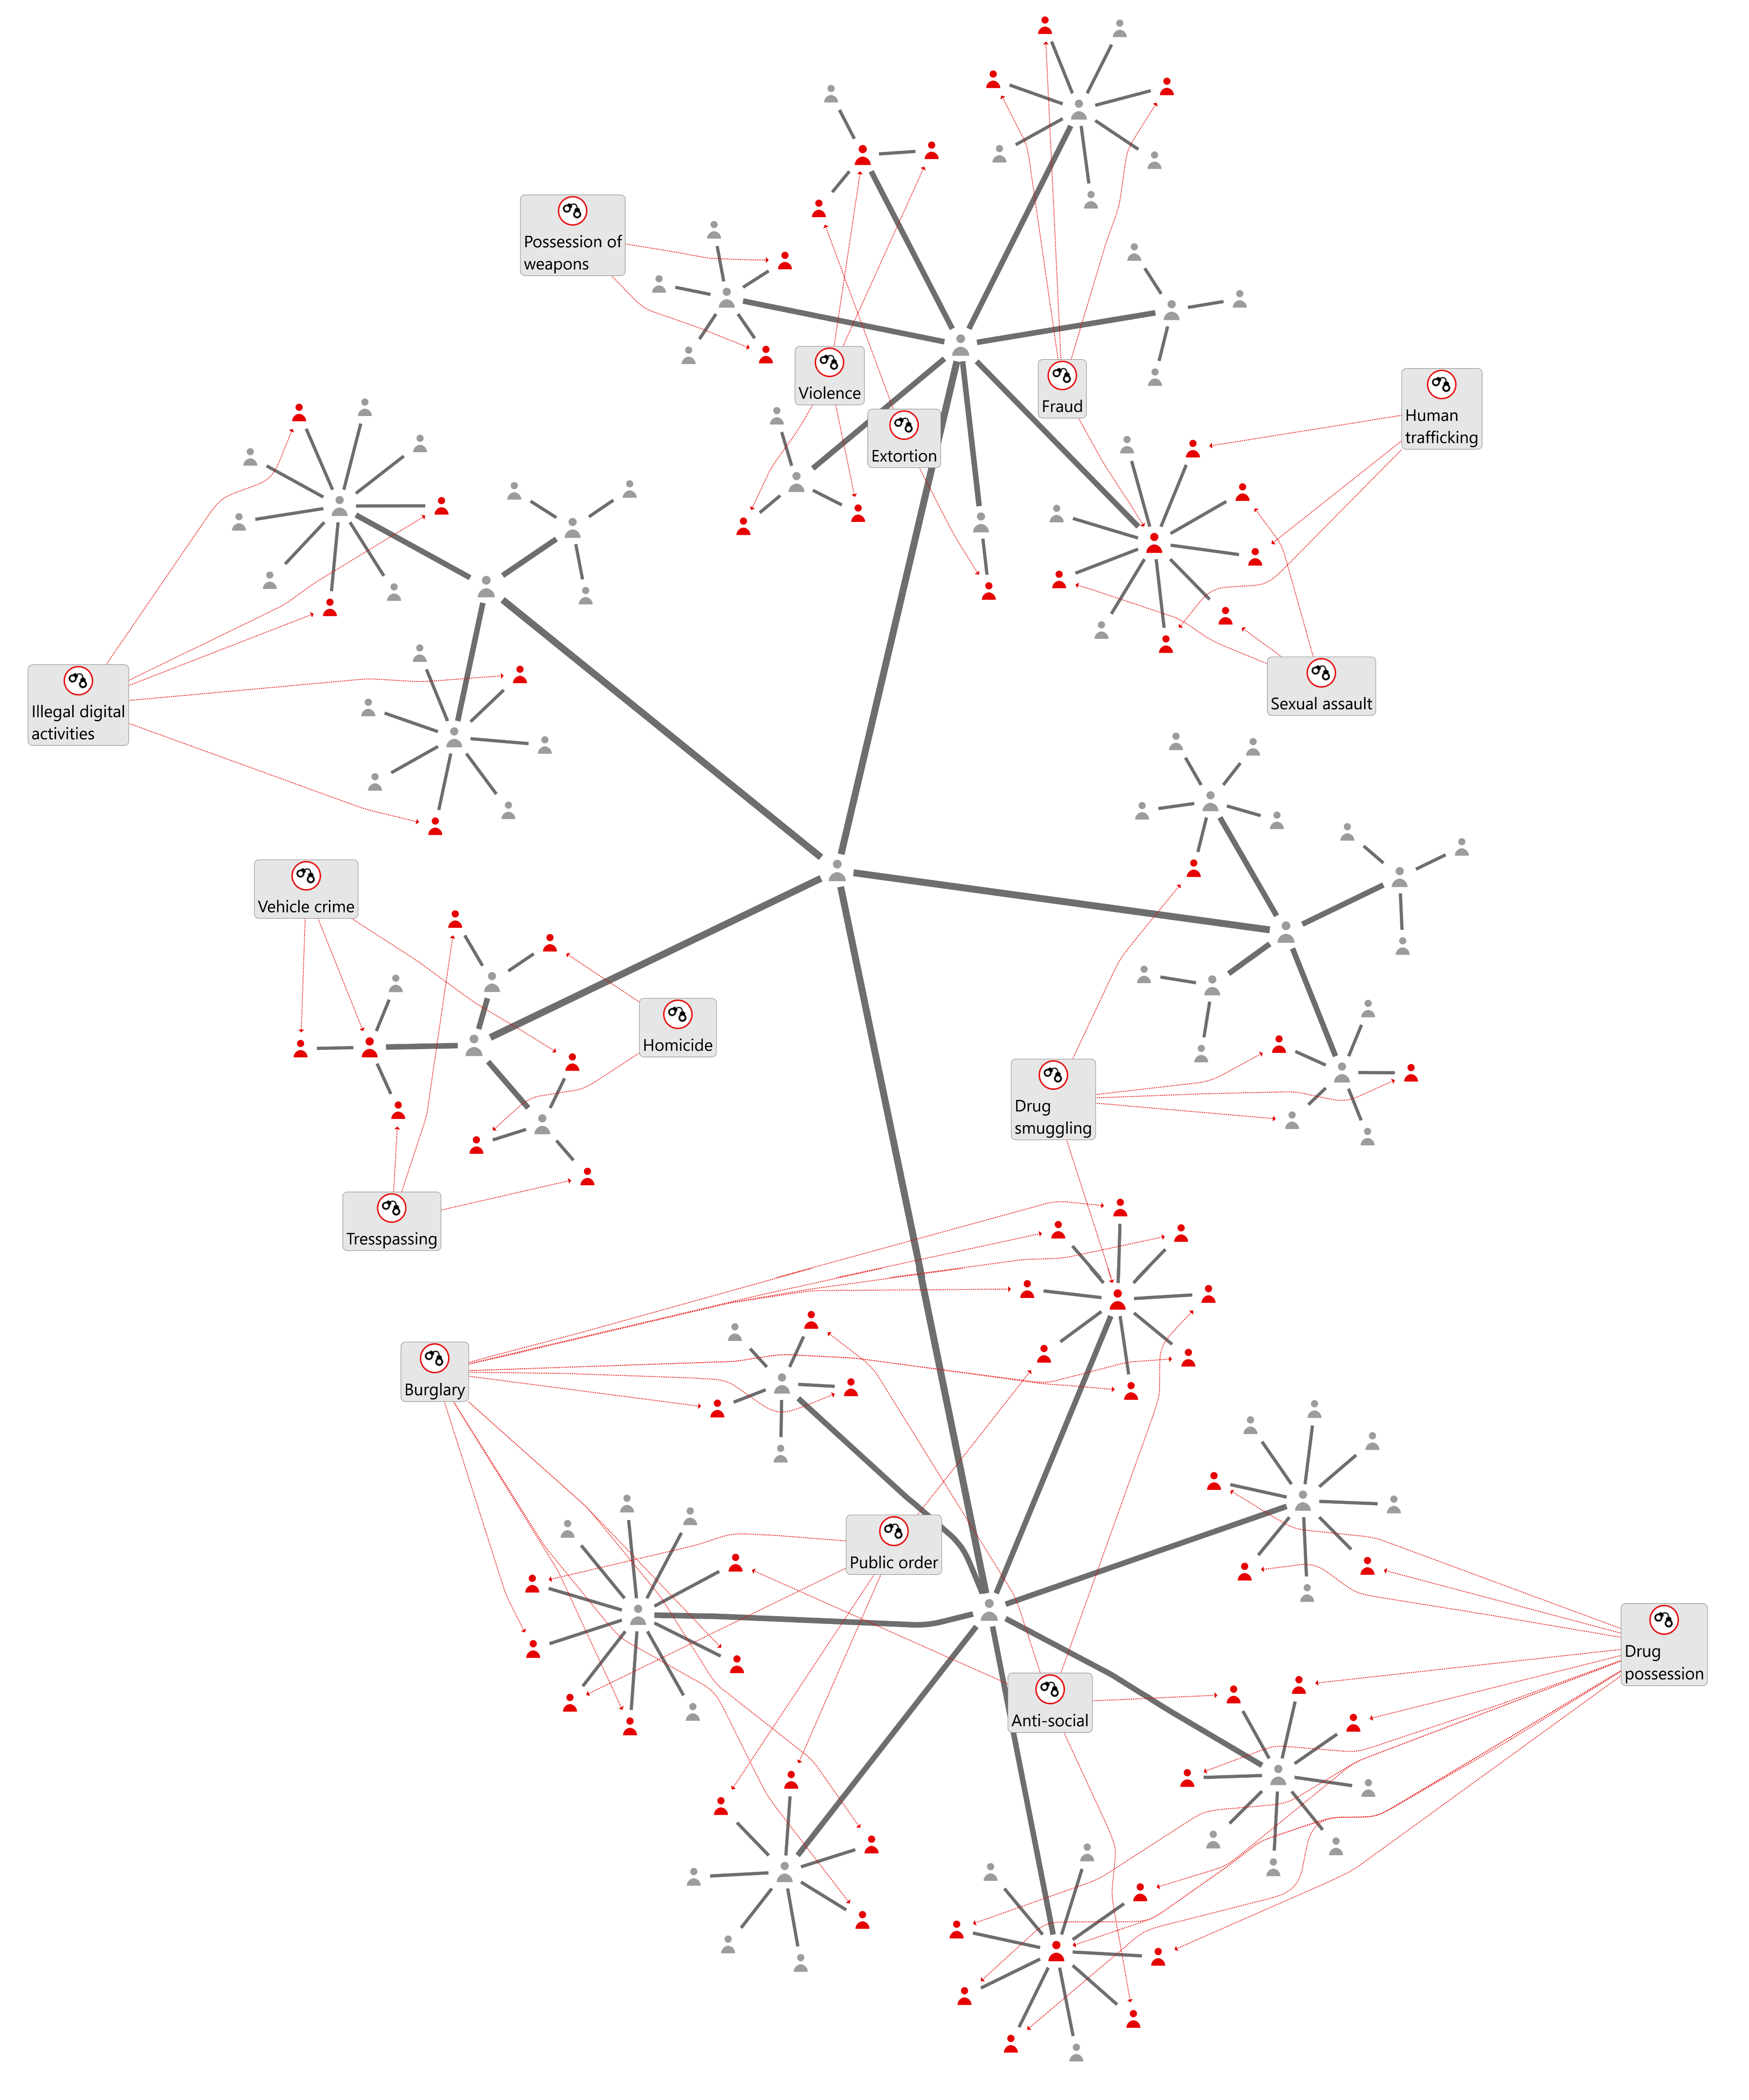
Link chart of a criminal organisation and the types of crimes that members have been associated with (Red = convicted, grey = suspect)
The more entities and relations you add, the more complexity your link chart will encompass. Here, we have aggregated crimes into categories, displayed as boxes with a handcuff symbol and the relevant crime description. ‘Red’ people still represent convicted criminals and the ‘grey’ ones are suspects. The grey links are known connections between people, whereas the dotted red lines indicate an individual’s conviction of a given kind of crime. You could step up your investigation and add every individual incident to your chart, but make sure to use the symbology and layout options to maintain a clear overview.
Let’s see if we can make out some patterns in this spider web… Inspecting the branch of the network with the largest number of people, we see four sub groups that are consistently involved with burglaries and the other three with drug possession. Incidents of anti-social behaviour and public order occur all across this branch. This helps to create a profile of this subgroup and the roles of the members within it.
Animation highlighting the crime patterns across sub groups of the organisation
Another noteworthy social construct seems to surface in a much smaller branch of the organisation:
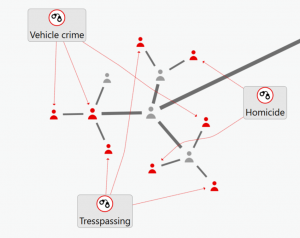
Close up of a smaller sub group in the network
Here we see that individuals prosecuted for homicide are frequently associated to those convicted of smaller crimes like trespassing and vehicle theft. Almost as if they depend on one another…
Mapping to reveal hidden spatial connections
Let’s pretend another homicide occurs and there is reason to believe this is a show of strength between our criminal organisation and a rival gang. If our criminal organisation is indeed guilty, we can quickly narrow down the suspect list to the four members who are within the killer part of the network, but are not currently behind bars (symbolised in grey on the link chart). We start our investigation by gathering all spatial info of the crime scene. We plot it in the map view and generate the link chart:
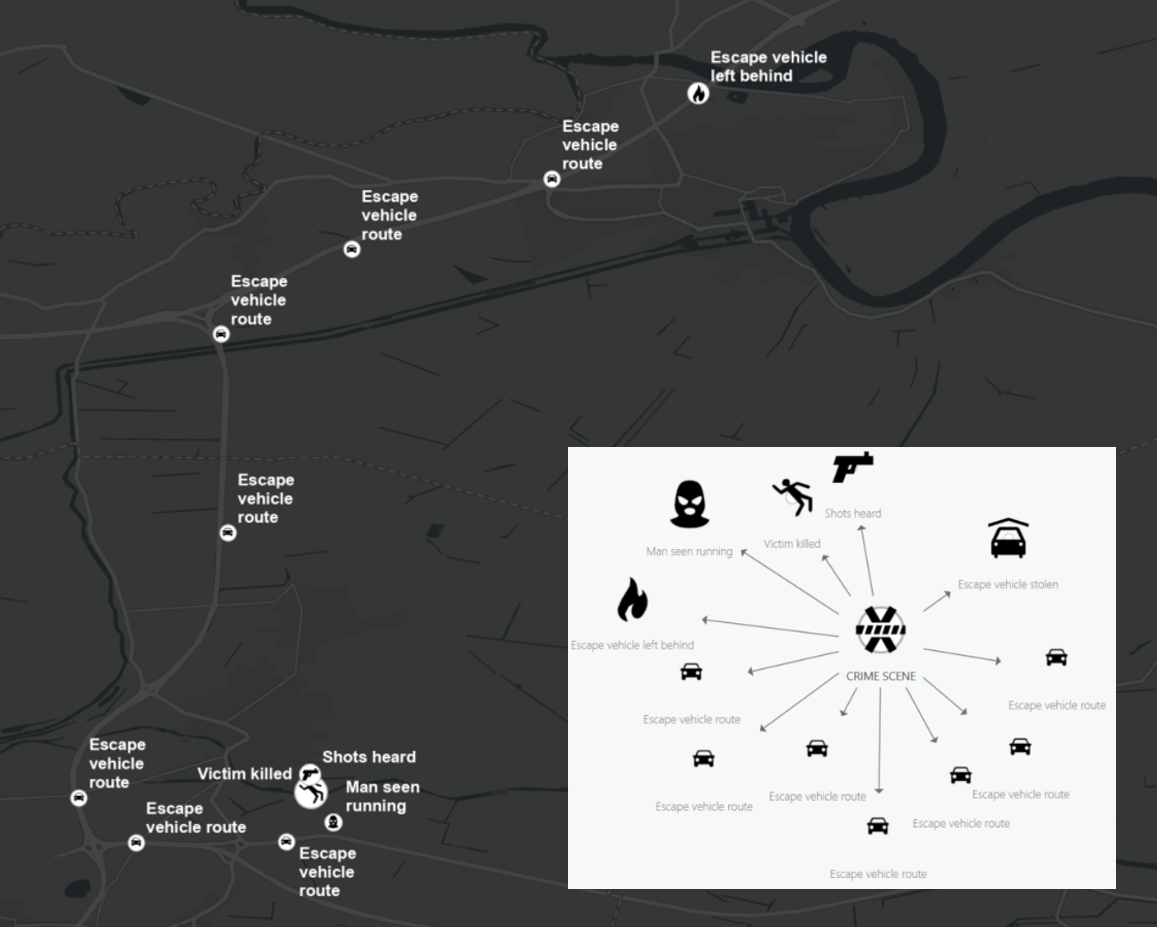
Events related to a homicide mapped out and displayed in a simple link chart
From this display of our data, we can formulate a narrative: a vehicle (stolen from a different area) was driven to a place where someone was shot and later found dead. Registered on Automatic Number Plate Recognition (ANPR), we trace this vehicle’s path to another location where it was set on fire and abandoned. Now we add our four suspects as entities to the same link chart. We hunt through our systems for any info on their whereabouts on the day of the murder: CCTV footage, mobile pings, ANPR sightings of their cars… Here’s what that could look like:
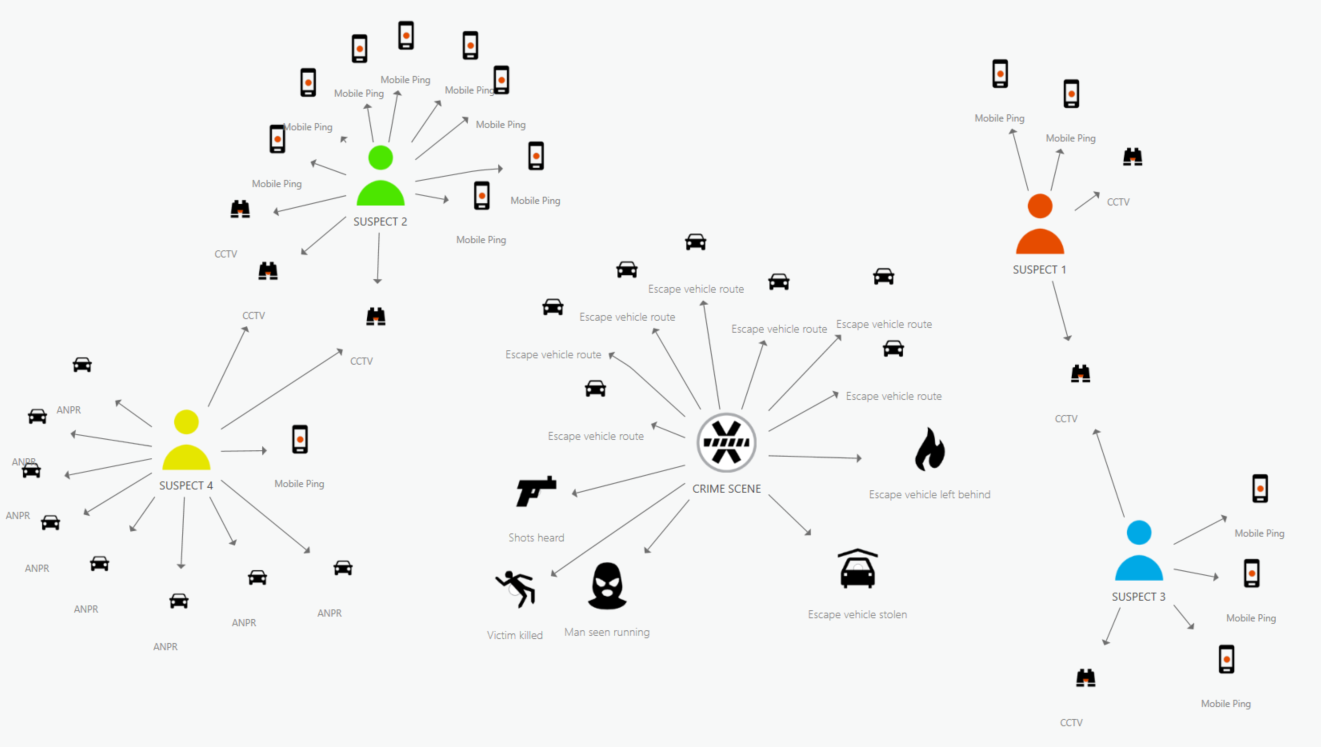
Homicide link chart extended into a criminal investigation chart with the locations of relevant suspects
Whilst there are some overlaps in locations attended by the suspects, none of them directly relate to the crime scene. However, if we display this on a map, a couple of interesting spatial patterns emerge…
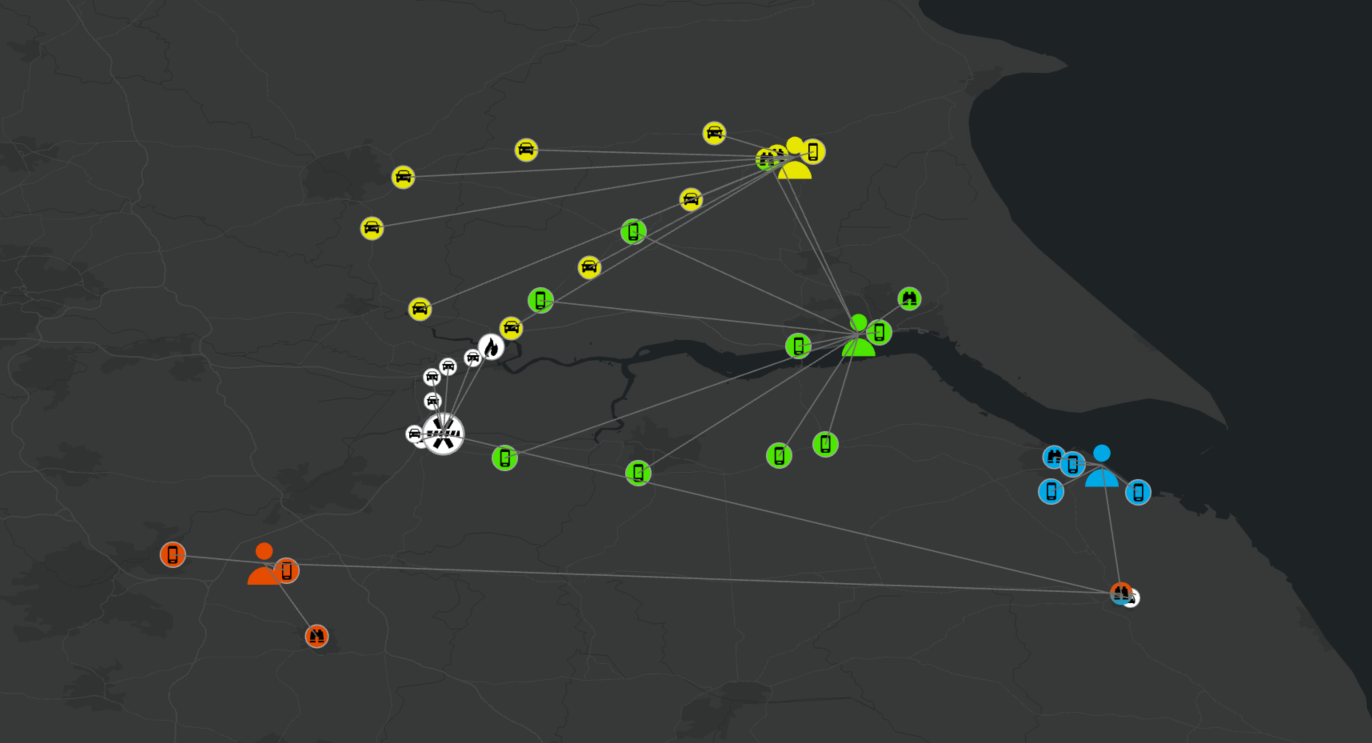
Criminal investigation link chart displayed on a map
Unravelling the story…
Suspect 1 (red) and suspect 3 (blue) were seen together on the day of the murder in the village where the escape vehicle was stolen, a place where neither of them reside… Coincidence? Possibly. Let’s analyse the movements of the other two suspects: one of them (yellow) is detected on ANPR making a loop on the motorway, seemingly brushing past where the escape vehicle was left behind. Just out for an evening drive? Probably not. What is our fourth suspect (green) doing? We trace back his mobile pings and notice him out and about around his home address during the daytime. In the evening he heads far out of town, though his own vehicle does not move according to ANPR. He disappears off the radar but later in the evening his mobile signal is picked up 10km north along the same motorway as our yellow suspect was driving on. CCTV footage confirms their co-presence later that evening near yellow’s home address. Hidden spatial links can be speculatively be added to the chart:
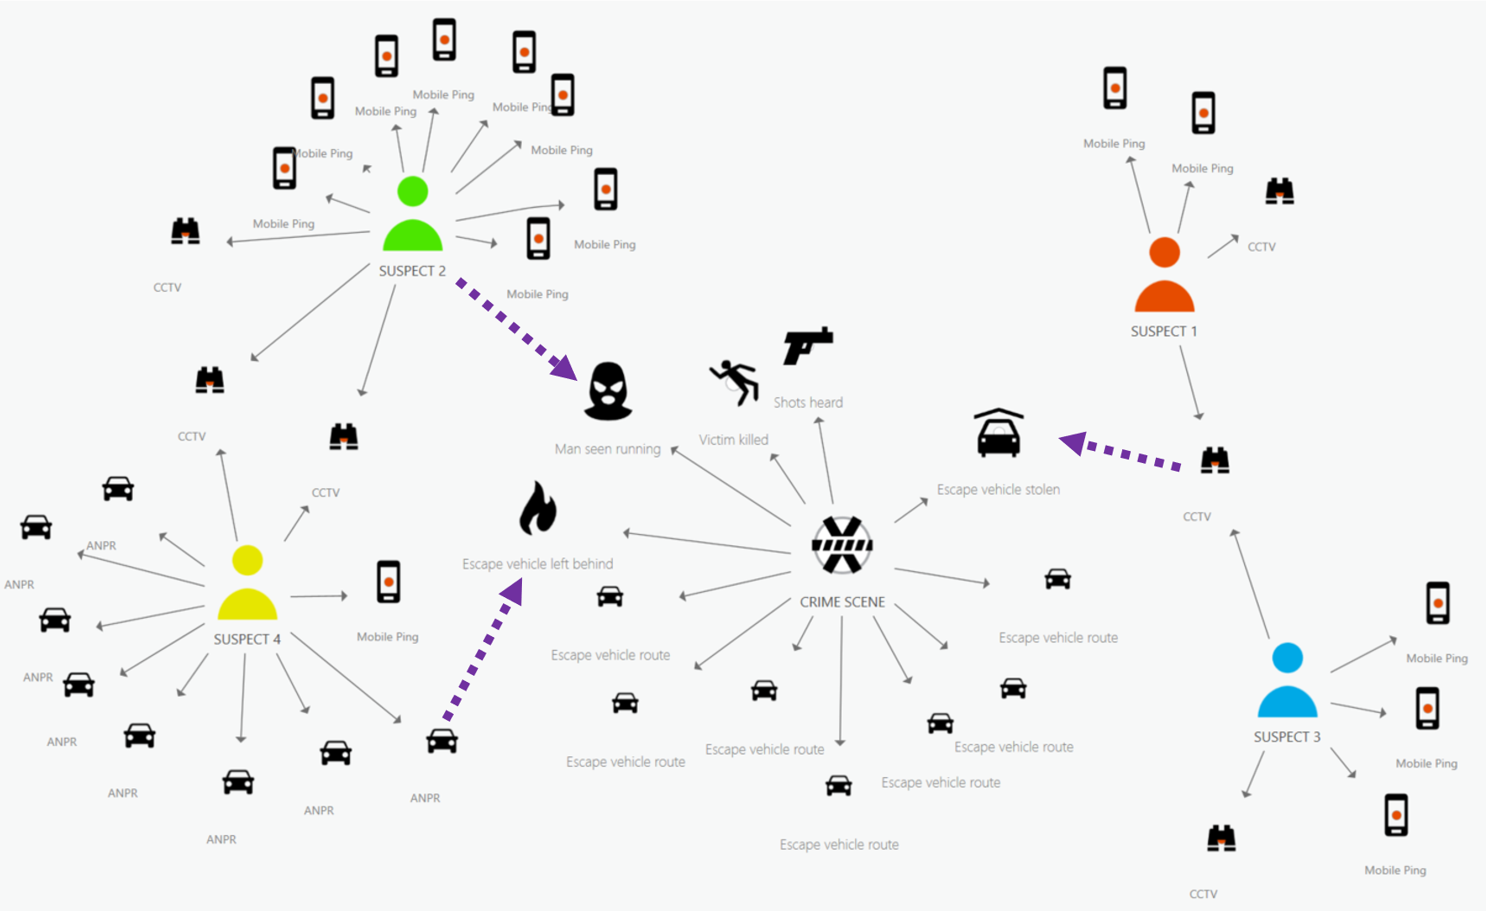
Criminal investigation link charts with the additional hidden spatial links added
Does our understanding of the criminal network help this investigation? If enough entities can be linked together with confidence, then yes. Had we not known the roles of these suspects within their organisation, we might not have focused our investigation efforts in the right direction. Clearly you need more than a link chart to prove anyone guilty of anything. Nevertheless, it can be a good tool to visualise the relationships between people, events and places involved with this incident and the larger criminal operation that it may fall into. This gives us hooks and clues that can lead to the discovery of stronger evidence.
More on link analysis…
We have illustrated the use of link analysis in ArcGIS Pro for a crime investigation, but it can be applied to many domains. For inspiration have a look at these resources:
- Public health case study: a very thorough ArcGIS Pro demo of link and centrality analysis for COVID-19 contact tracing.
- Commercial scenario: blog post on how to get started with making link charts in ArcGIS Pro Intelligence although the instructions are just applicable to link analysis in ArcGIS Pro 2.7.
- Link analysis for the refugee crisis: worth noting that this is a tutorial for ArcGIS Insights, which requires a different workflow and license, but it’s an interesting example of the relevance of link analysis to humanitarian planning.
In this blog, we mapped and charted the coherence of individuals within a criminal network to reveal information about a crime scene. Without connecting the spatial perspective into link analysis, hidden connections may remain under the radar!