Thanks to work behind the scenes, you can now access features from Ordnance Survey’s National Geographic Database (NGD) directly in ArcGIS Online and ArcGIS Enterprise 11.1 onwards. With the OS NGD API – Features, you can access up-to-date, authoritative OS data for buildings, land use, road networks and more. Best of all, by accessing the data through the OS’s API, you can get just the data that you want, where you want, and when you want, without having to maintain or download large datasets.
How to get started:
The first step is to retrieve your API key from the OS Data Hub, and ensure it has access to the OS NGD API – Features API. This is available to organisations that fall under the Public Sector Geospatial Agreement (PSGA) or if you are an OS Partner. Once you’ve got your key, the OS Data Hub will show you the full URL you need to use in ArcGIS, including your API key appended onto the end of the root API Endpoint Address like this:
https:api.os.uk/features/ngd/ofa/v1?key=yourAlphanumericKeyHere
Next, we’ll need to add this service URL into ArcGIS Online. If we open up the Map Viewer, in ArcGIS Online or ArcGIS Enterprise, we can add in the service using the Add layer from URL option. After pasting in our URL, we want to select OGC Feature Layer as our data type. Here’s the great part: we can now select just the thematic data that we need, rather than loading all of the NGD data or appending queries into our requests to the API. After clicking next, the Map Viewer will provide a list of available features that you can add to your map.
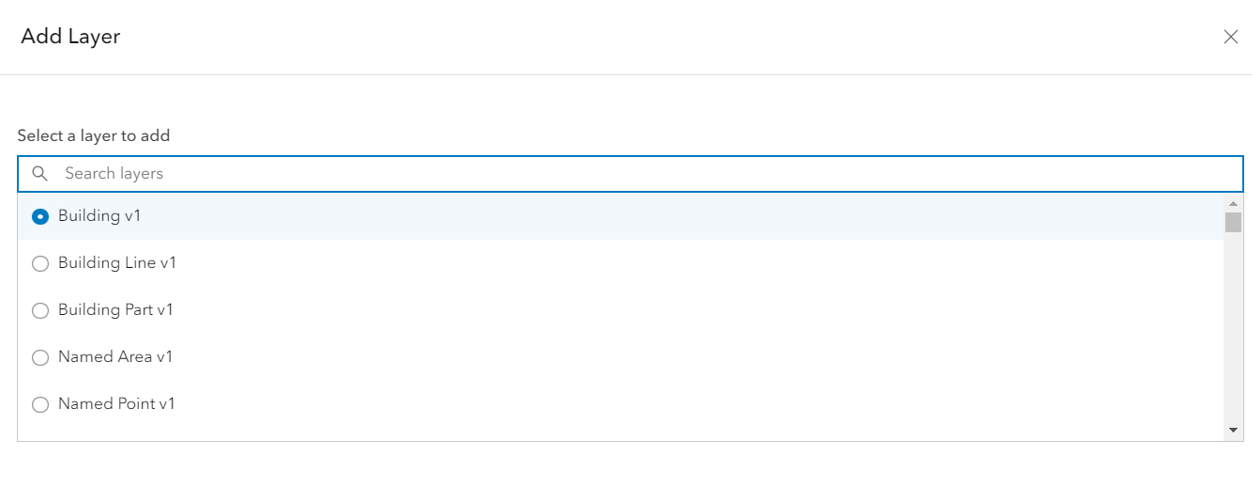
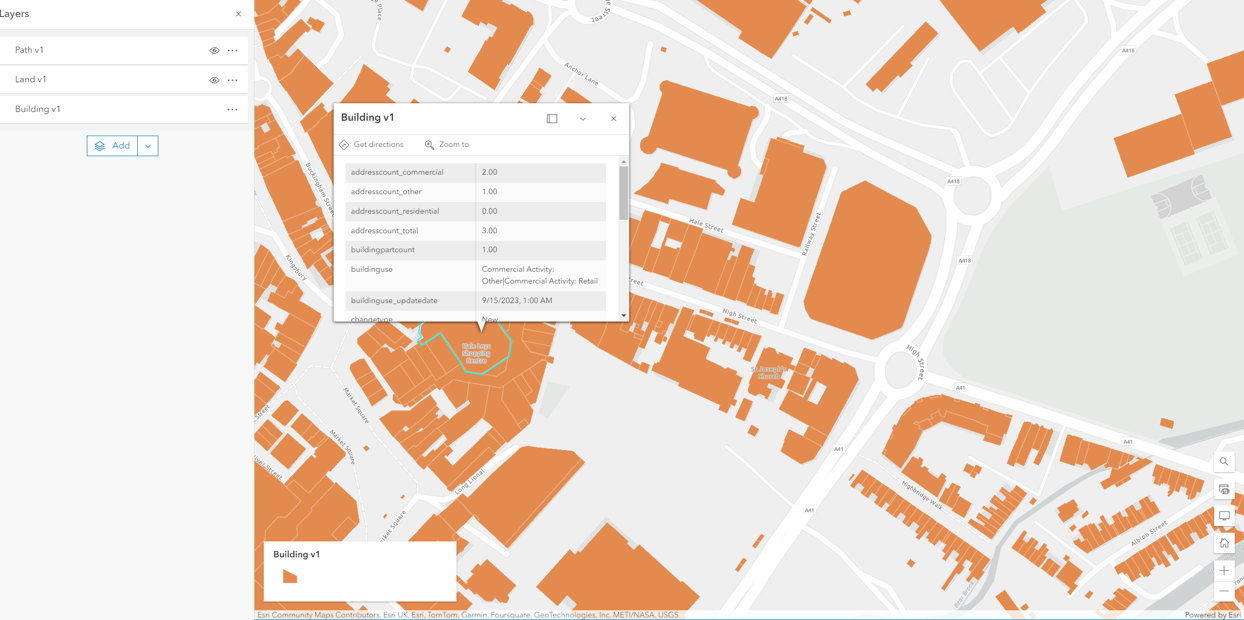
Let’s say that we want to identify and explore the residential buildings in our town. We can add in just the buildings layer onto our map:
Ordnance Survey: © Crown copyright and database rights 2024 OS AC0000823798
We now have an accurate view of the buildings around the town centre, and we can interrogate the features to understand what each building is used for alongside its footprint in square metres.
What can we do with the data?
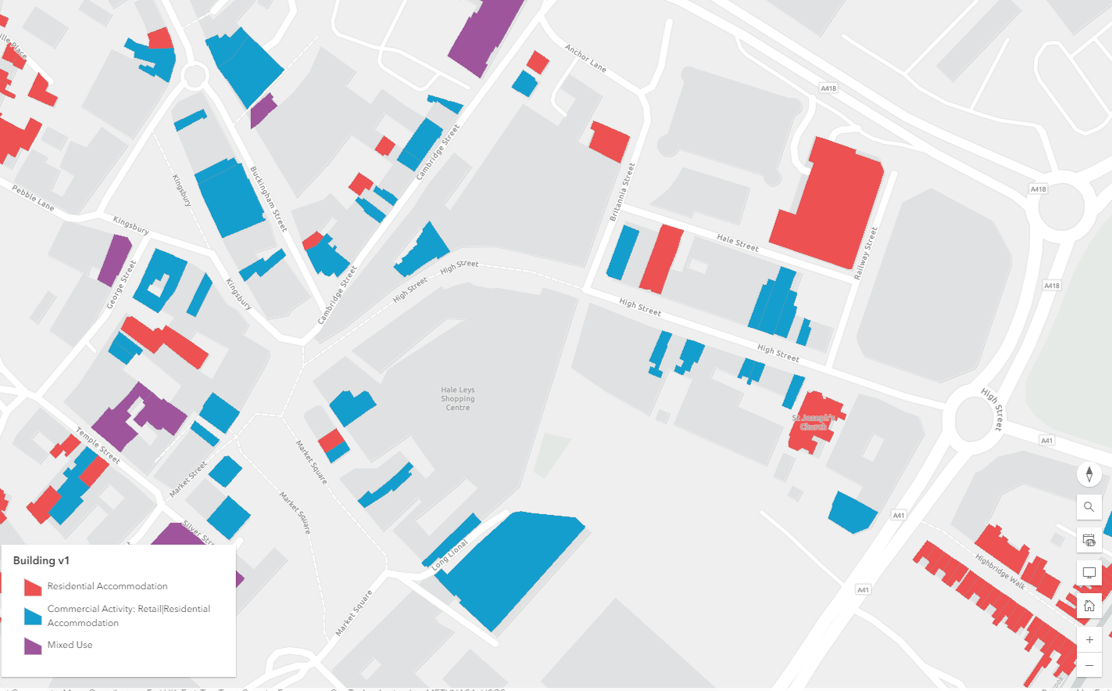
But we don’t have to stop there. Although our buildings have appeared in a delightful burnt orange hue, we can symbolise the data to fit our needs. We can use any of the attributes that come with the data, such as the buildinguse field, to categorise the buildings on the map. I’ve grouped the residential and mixed-use buildings together in the Styles pane, and then switched off the visibility for non-residential buildings. This gives us a simpler view of our residential buildings:
Ordnance Survey: © Crown copyright and database rights 2024 OS AC0000823798
If we pan around the map, Map Viewer adds in new features from the service to match our map extent. If I veer away from the city centre, I can see a rapid increase in residential buildings (red) and a drop in mixed-use buildings (blue and purple):
Ordnance Survey: © Crown copyright and database rights 2024 OS AC0000823798
What’s great about using the API is that we’re only adding in the data we need for our current map extent. And if we want to add in more layers, we can do so easily.
It looks like I’ve drifted into a residential part of town and there might be a park nearby. To see if there is a park—and how I might get there—I’ve added in the Site, Site Access Location, and Road or Track layers from the NGD API:
Ordnance Survey: © Crown copyright and database rights 2024 OS AC0000823798
As I can confirm from the data, there’s a large park nearby, and I can access it from a few locations, including the footpath off Palmer Avenue. I’ve now incidentally created a map of residences and green spaces around my town, which I can share with my organisation or incorporate into a web application through ArcGIS Instant Apps or ArcGIS Experience Builder for example. When users from my organisation use my app, they’ll be accessing the latest data from the same API endpoint that we added into Map Viewer.
Try it out yourself!
The OS NGD APIs are currently available to customers under the Public Sector Geospatial Agreement (PSGA) and OS Partners so whether you need to visualise building data for planning; review a detailed transport network for routing; or rely upon having the most up-to-date, authoritative data to inform your decision-making; using the NGD API within ArcGIS Online makes it easy to access and share the data you need.
So go and explore the possibilities for your organisation, and let us know if you have any questions about building maps and applications from the NGD data.
Happy mapping!