This month, we are excited to bring OS OpenMap – Local Buildings, Important Buildings and Functional Sites to the Living Atlas! Ordnance Survey® describe OS OpenMap – Local as the most detailed ‘street level’ mapping product available within the open data field, so we wanted to make it even easier to consume this data within the ArcGIS system.
What is the Living Atlas? The ArcGIS Living Atlas is a collection of geospatial information from around the globe and it includes content contributions from some of the UK’s most recognisable organisations. Its aim is to support your work with accessible and authoritative maps, apps and data layers from a leading collection of spatial data.
So why are we so excited about these new services? Let’s explore the data and look at some potential use cases, including situational awareness, proximity to facilities and maximising coverage.
Exploring the Data
OS OpenMap – Local’s primary focus is to allow you to better map, visualise and truly understand your data at street level. This isn’t just pinpointing schools, hospitals or other major facilities, but mapping the grounds they occupy too. This allows you to gain a greater insight into your environment – for instance looking at land use for local planning. I have zoomed in on Coventry City Centre, below, to give you a closer look at the Buildings and Functional Sites services.
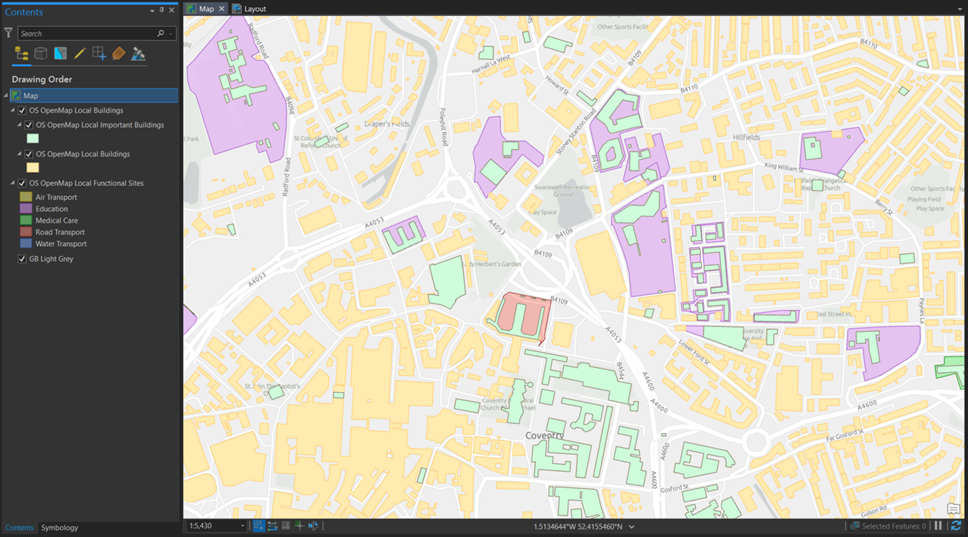
Buildings & Functional Sites in ArcGIS Pro
Even without any powerful analysis tools you can start to dive more deeply into the data, understand the local area and gain insight into the distribution of important facilities. For instance, there may be one building type or functional site theme that sparks an interest or relates to your problem. Below I have queried the Important Buildings layer to display the distribution of religious buildings within the inner-city area of Coventry.
Note: Use definition queries or filtering within the layer settings to pick out the assets that are relevant for you.
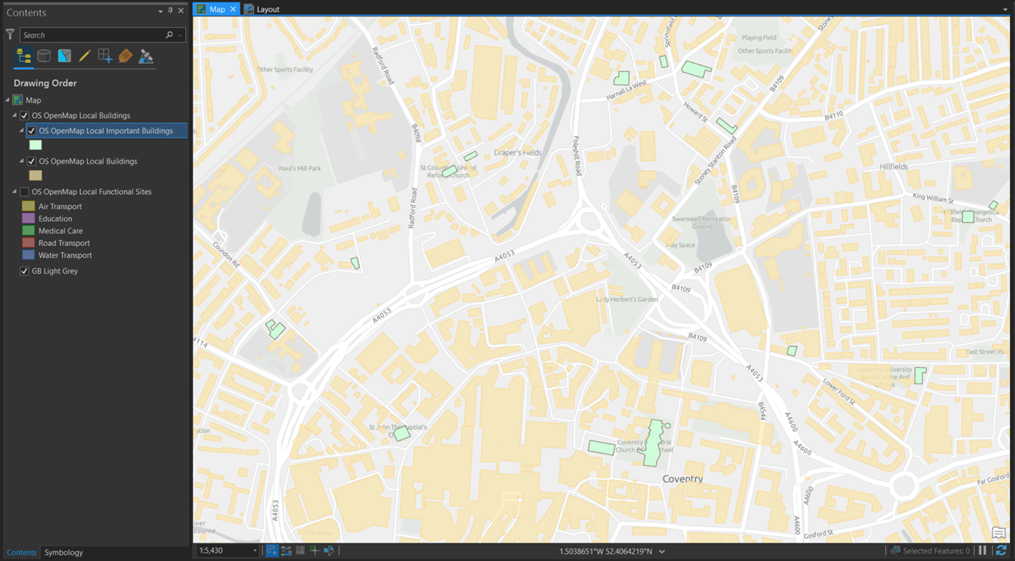
Querying Religious Buildings
- OS VectorMap Local® for a highly-detailed, customisable, street-level map, showing fences, building outlines, paths and street names, for the accurate lie of the land; and
- OS MasterMap Topography Layer® for, as described by the Ordnance Survey, the most detailed and accurate view of Great Britain’s landscape, including roads, fields, buildings, trees, fences, paths and more.
For more information about these please contact us at content@esriuk.com.
Gaining Insight
So why would you want to use this data and how might it help you? I’ll barely scratch the surface of the huge number of possible use cases, but I’ve picked out a few which may hopefully inspire you to make the most out of these datasets and the Living Atlas.
Situational Awareness
Assessing site and building uses for proposed developments or current assets is valuable in land use planning, site management, insurance and more! By combining the OS OpenMap – Local Buildings and Functional Sites with the Environment Agency’s Flood Alert Areas you can identify functional sites which are at risk of flooding. In the example below, I have focused on an educational facility, which would often be displayed as a singular point feature according to its address. By displaying both the buildings and the functional site extent as separate polygon features (example A), you discover that the school’s buildings do not fall within the flood alert areas (well… mostly), yet the rest of the site such as the playing fields, and car park, do. Ultimately, the building flood risk is much lower than other (arguably less important) areas of the site.
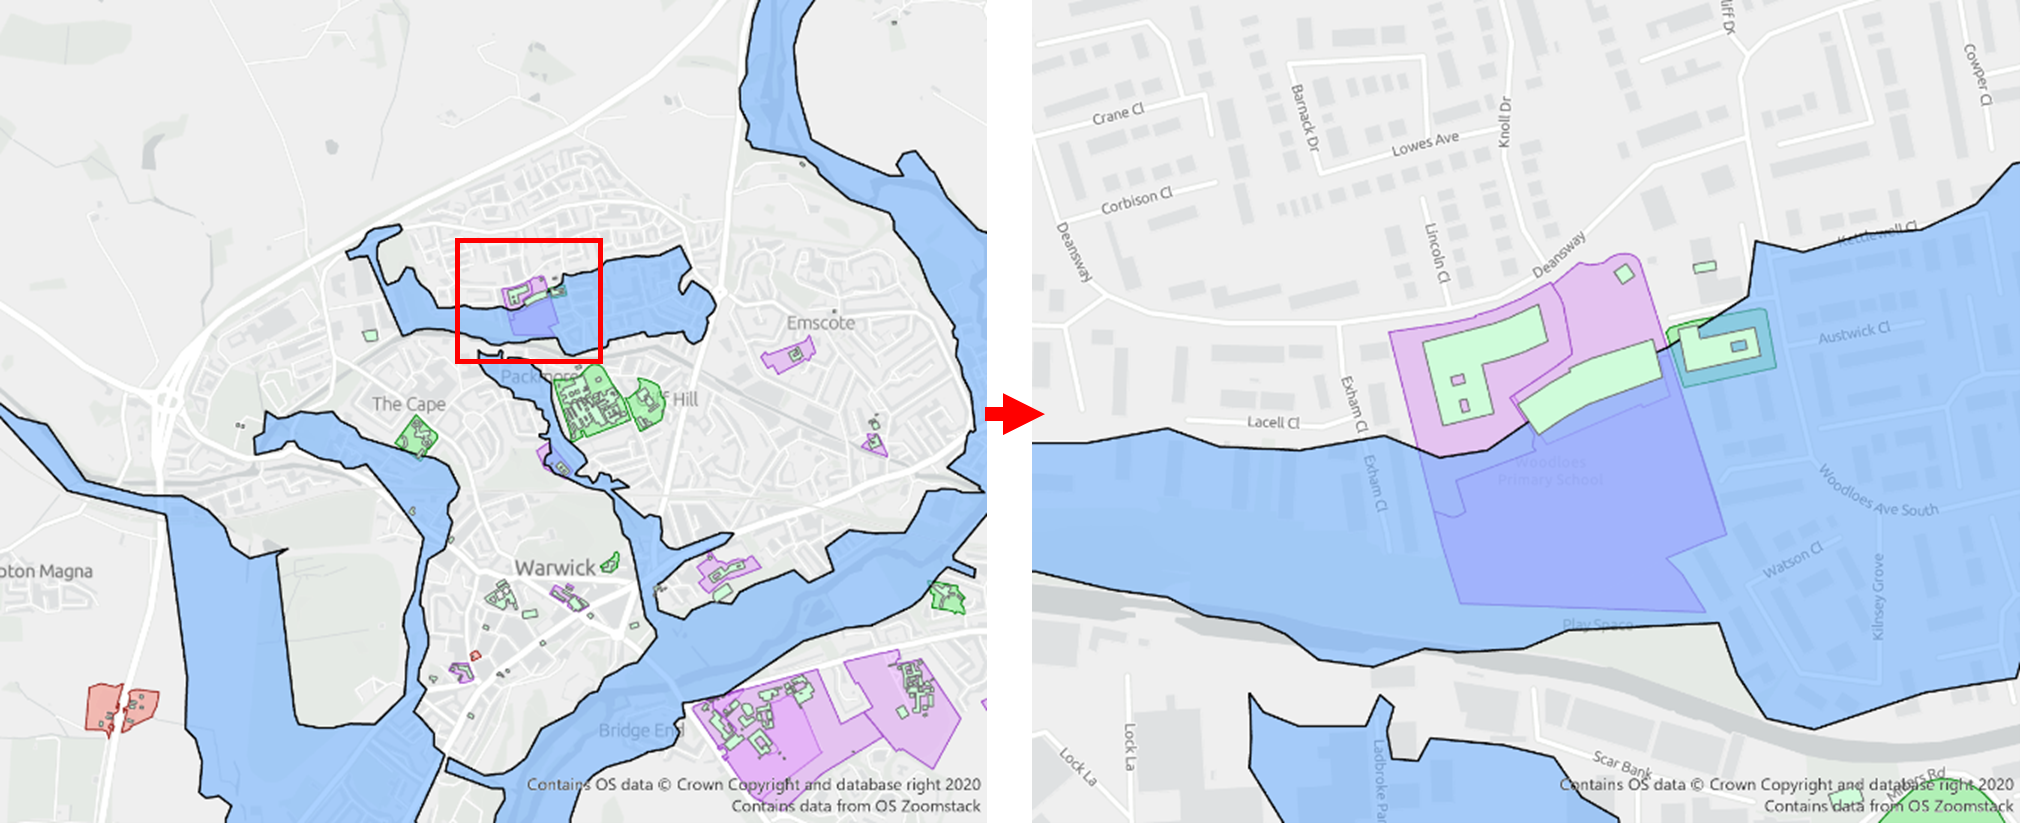
Risk of Flooding (Example A)
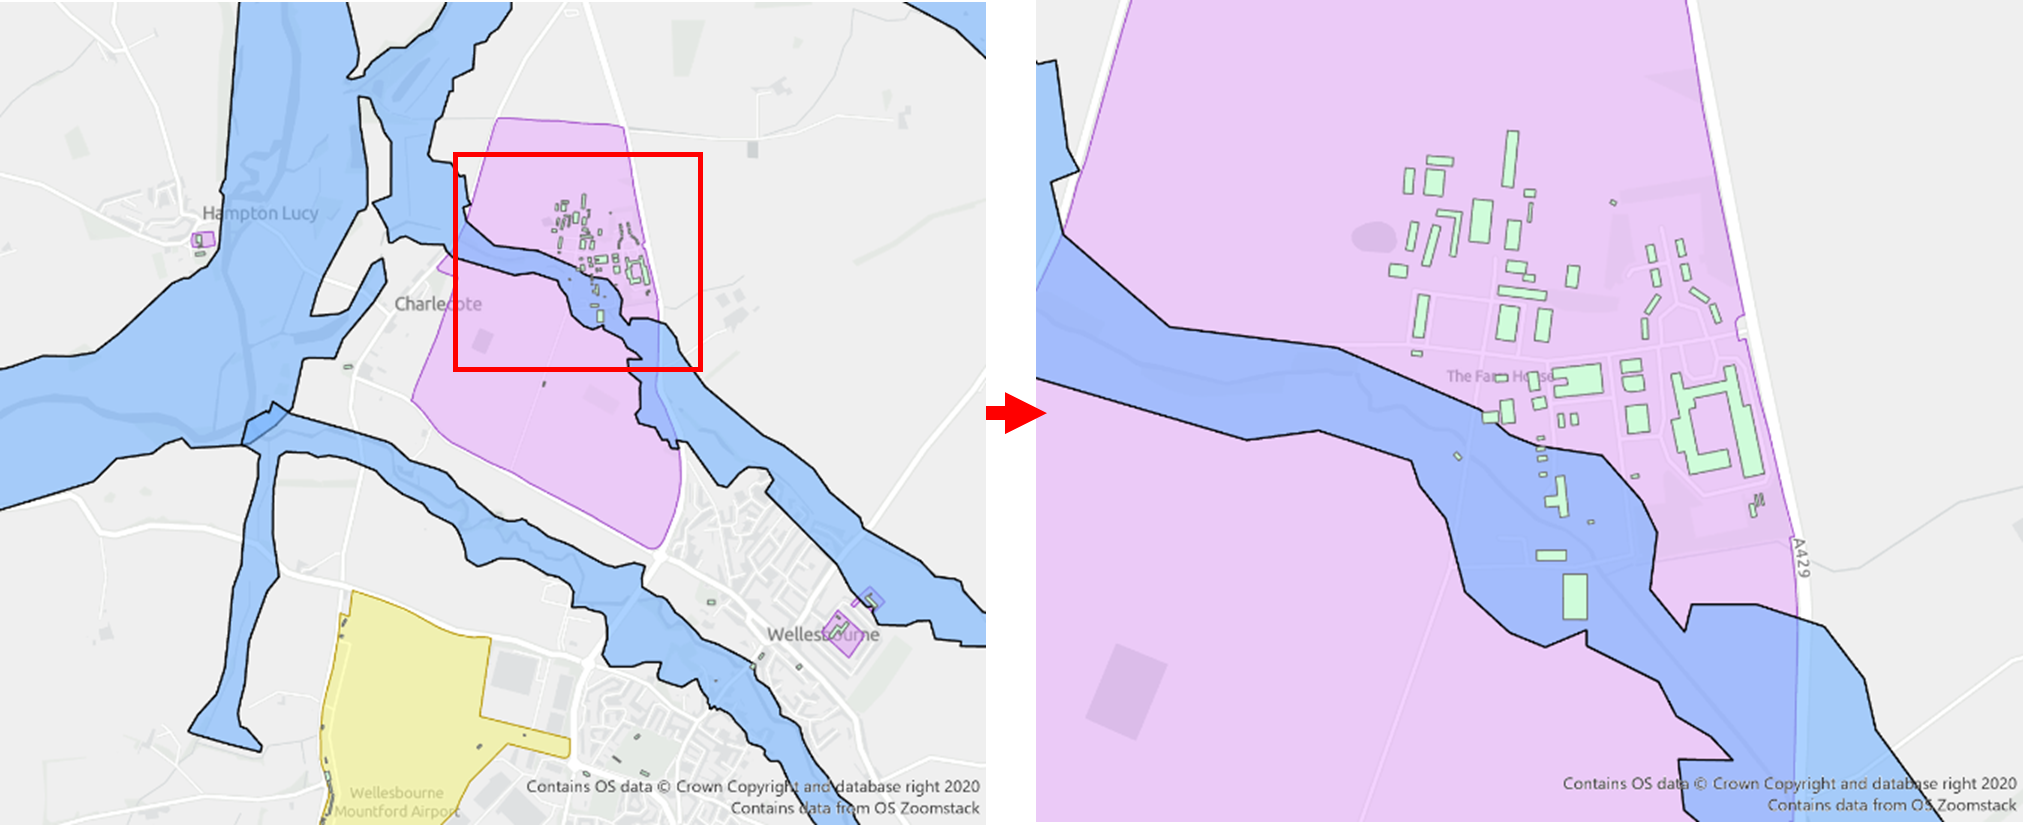
Risk of Flooding (Example B)
Another scenario where you could use OS OpenMap-Local Buildings and Functional Sites is to monitor access to facilities. By recognising the spatial challenges that communities face, you can better plan for the future.
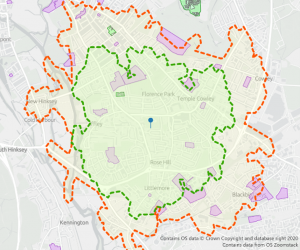
Access to Medical Centres within a 20-minute (green) and 30-minute (orange) walk of a residential property in Oxford.
For instance, answering the question: am I within a reasonable walking distance from my local medical centre? I calculated twenty-minute and thirty-minute walk-times from a residential property in Oxford (see on the left) identifying one medical centre within each of these walking zones.
Analysis like this can help you, the local decision-makers, to prioritise investment and make informed choices about the local amenities. You can apply the same techniques to your study!
Maximising Coverage
This brings me onto my final example, a telecommunication organisation providing the optimum cell coverage across an area. It could also be emergency services needing to better understand their operational area to ensure they can reach popular destinations in time. Below I looked at dropped calls within a local borough and analysed this dataset to identify eleven key call dropping clusters (see below). By layering these clusters over the OS OpenMap – Local Buildings layer I started to identify key, well-developed areas which have unexpected clusters of dropped calls. A key benefit to using the OS OpenMap – Local Buildings instead of a point dataset is that the more detailed building footprints provide further insight on where could be a suitable to place to locate the network infrastructure going forwards. You could replicate the same type of analysis and it may be the perfect opportunity to couple it with some suitability analysis too?
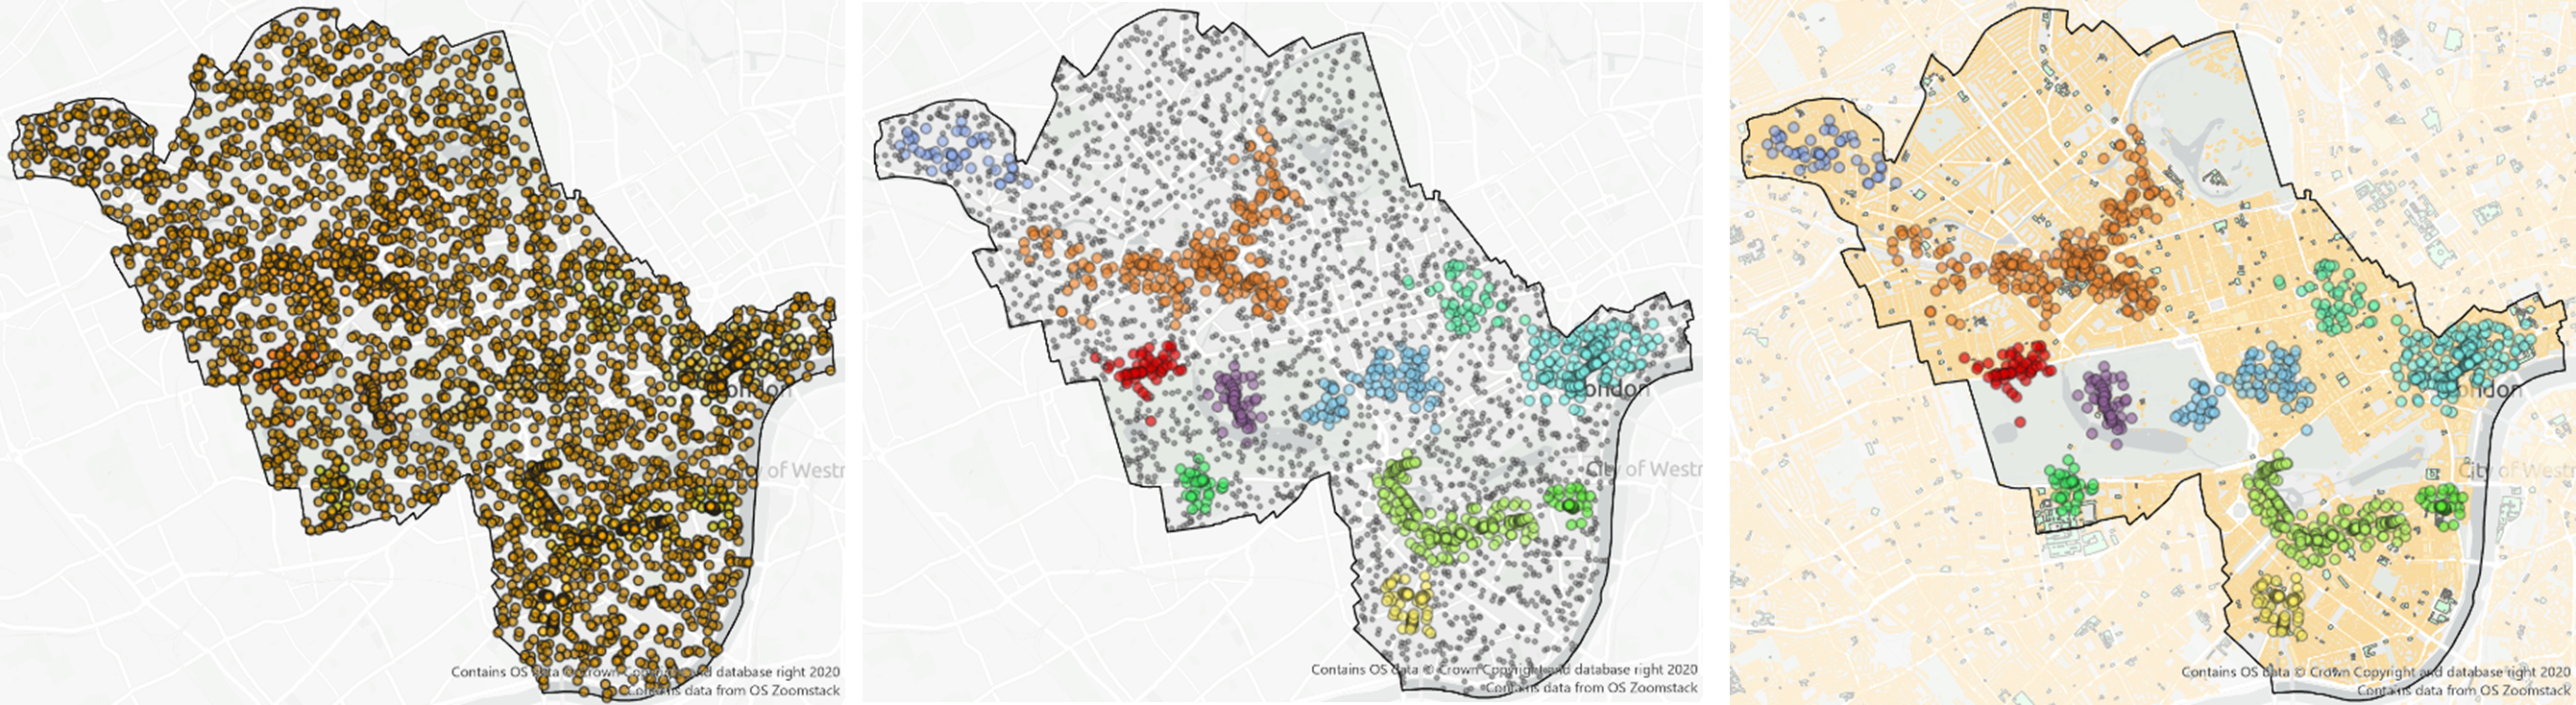
a) Dropped Calls b) Dropped Call Clusters c) Dropped Call clusters overlaid onto OS OpenMap – Local Buildings