Report Builder for ArcGIS is a web-based application dedicated to designing and publishing virtually any type of report for data within ArcGIS Online. That could be your own ArcGIS data, your organisation’s data or even datasets readily available in the Living Atlas. From single page factsheets to complex, multipage statistical profiles, Report Builder offers a simple design interface to create a report that suits your data and your needs. New to Report Builder myself, its intuitive interface meant I could create a basic report in just a few minutes for one of our past webinars, check out the report here.
But what really sold me on the power of Report Builder for ArcGIS is that it follows a design once, run many times principle. Using your designed report, the app can automatically build a report for every single feature within your source layer, that could be hundreds, thousands, or even tens of thousands of features, saving you time to focus on decision making. Ultimately, Report Builder is doing all the hard work for you, creating dynamic reports for all features within your specified data layer that can be shared with colleagues, teams or even publicly.
So let’s dive straight in and explore the components of this app for building your very own report.
Creating a report
When creating a report in Report Builder for ArcGIS, you have three options – to create a new report from an existing web map, from a feature layer or from a data catalog (which is a way to organise large attribute datasets in ArcGIS).
Once you’ve chosen your source, you can specify the fields that will identify features within that layer. This will allow you to take advantage of Report Builder’s dynamic content capabilities. Once you’ve specified your source and its fields, a blank report page will automatically be created for you.
Designing a report
Report Builder has a simple design interface for you to create a report. Let’s walk through some of the key components of the Report Builder interface:
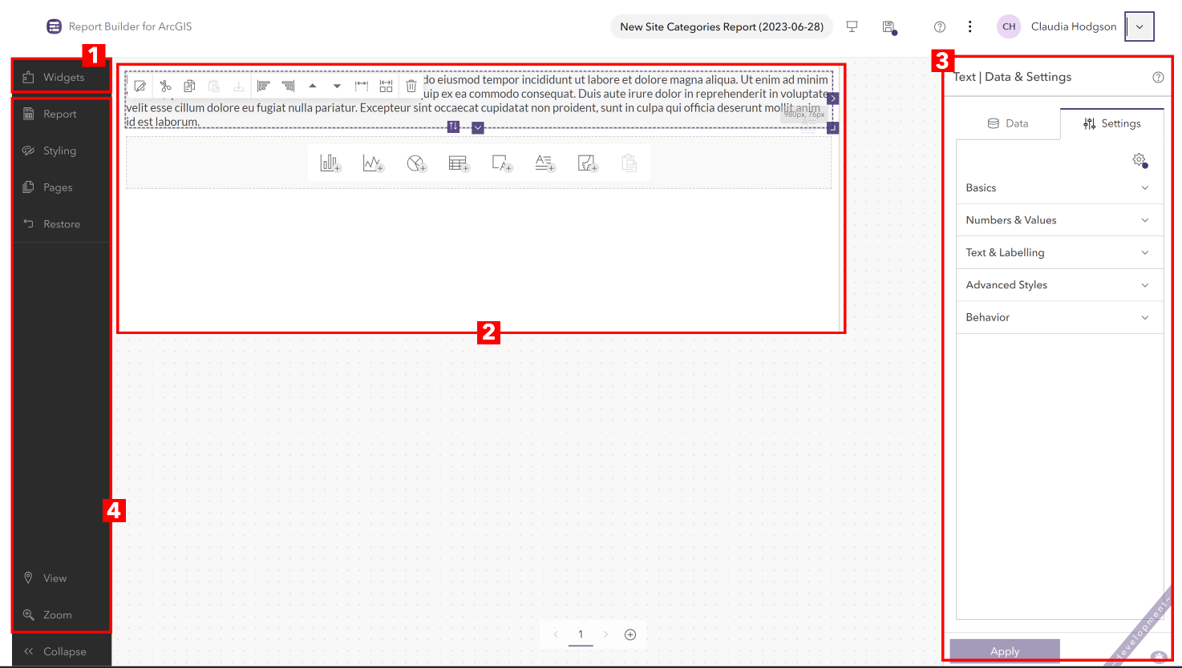
1. Widgets tab
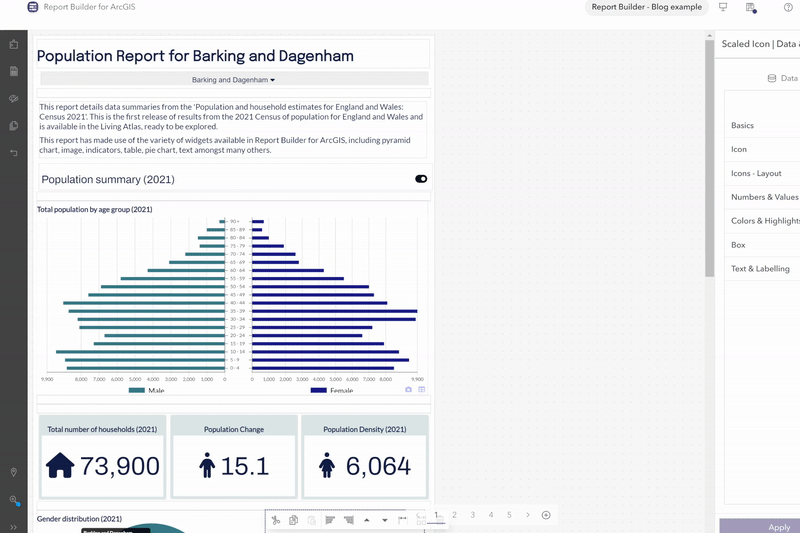
Report Builder for ArcGIS has over 20 widgets meaning you have a wide variety of tools for displaying, analysing and reporting on your chosen data. All widgets are available on the left pane of the design interface and are categorised into widget groups: Charts, Controls, Infographics, Maps++, Other, Tables, Text and Web. Learn more about widgets in the documentation.
2. Report page
The centre of your design interface shows the page (or pages) of your report. Here is where you can drag and drop in widgets and bring your report design to life. As you begin to build your report, editing and structuring options become available for each widget.
Adding structure to your report can help make its contents clearer for the user. One of the easiest ways to do this is to make use of the Break Line widget found in the Text group to add spacing between your widgets. Alternatively, you can also add margins to individual widgets. Other widgets such as the Toggler widget (which allows the user to collapse/expand sections of the report) is another easy way to structure your report.
The positioning of your widgets can also help to add clear structure and level of organisation to your report. You can position widgets in a list format, or even position them side-by-side by using the Anchor feature. You can find Anchor under the widget Settings > Basics.
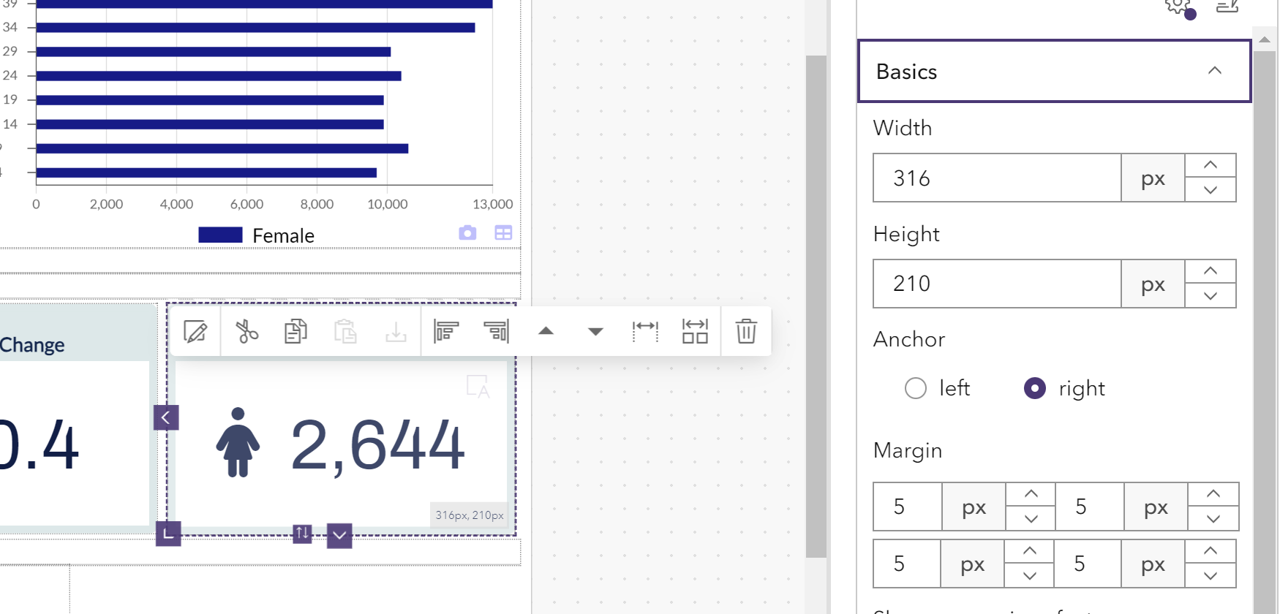
The Anchor feature found under widget settings allows you to display widgets side-by-side, letting you to make full use of your report page.
3. Data & settings pane
This pane appears once you select a widget added to your report template and is divided into two tabs, Data and Settings. The Data tab is simply that, where you specify what data field(s) you want to display in the selected widget and should be the first step for your widget configuration. The Settings tab is the home of customisation, it’s where you can dig into as much of the design, behaviour and sizing of your widget as you’d like. Get creative with colours, labelling and styles, or simply just add a title.
Explore how customisable Report Builder for ArcGIS is by checking out the variety of reports in our gallery or check out this otterly brilliant example in this blog.
4. Side panel
Now we’ve already walked through the widgets tab, but what else is included in the side panel. Report is where you can specify the settings, import and export designs and manage data sources. Styling does exactly what it says on the tin, allowing you to specify font, colours and even set up mobile views.
It is also home to View, which allows you to view the report populated with the data for the feature you have selected. This ties back to the greatest capability of Report Builder – to allow a user to view the report for any of the features in the base layer.
The View button on the left side panel allows you to preview all reports automatically created for every single feature within your source layer.
Sharing a report
Creating and designing a report is only the start of the story, it’s critical to be able to share your reports with your intended audience, and there are a variety of options for this. As Report Builder for ArcGIS is integrated into the ArcGIS System, you can embed your reports into other web applications and share your collection of apps together. If you’re looking for a way to bring your report out of the ArcGIS System, you can print or even save your report as a PDF. You’ll see these options appear when you view your live report.
You’re ready to build a report
And that’s it! Knowing the basics to the Report Builder interface means you can kick start your smart reporting and begin creating your very own report. Here are my final top tips to really get the most out of Report Builder for ArcGIS:
- Why not turn your average text box into an indicator like you might see on a dashboard? Make use of icons and dynamic indicator values to effectively display your data.
- Make sure to use dynamic text in your titles and other widgets so that the design suits all reports built for individual features. Simply use Insert Feature Value found under the tab of each selected widget.
- Get creative! Don’t be restricted to just a few widgets. To really show off your data, use a variety of charts, infographics and even maps.
Now you’ve got everything you need to start creating beautiful, powerful reports with Report Builder for ArcGIS. But don’t just take my word for it, the best way to get to know the product is to get hands on yourself! Why not take out a 30-day trial or get in touch with us at sales@esriuk.com.