ArcGIS Business Analyst Web is a spatial intelligence solution that helps organisations in their strategic decision-making. It combines demographic, business, lifestyle, spending, and census data with map-based analytics. Business Analyst is suitable for planning, site selection and audience segmentation, making it a great analytics tool for organisations in both the public and private sector. In this blog post I’ll give you a quick overview of five of its most valuable features.
The range sliders!
Create a customised index of demographic profiles
The Smart Map Search tool allows to you to filter your map for areas based on multiple criteria at once. There’s choice of 130 built-in demographic variables for the UK, which fall into categories such as unemployment, educational attainment, marital status and household by income and composition. These can be filtered on-the-fly by adjusting range sliders that let you set thresholds for each individual variable and automatically displaying the areas that correspond to those criteria.
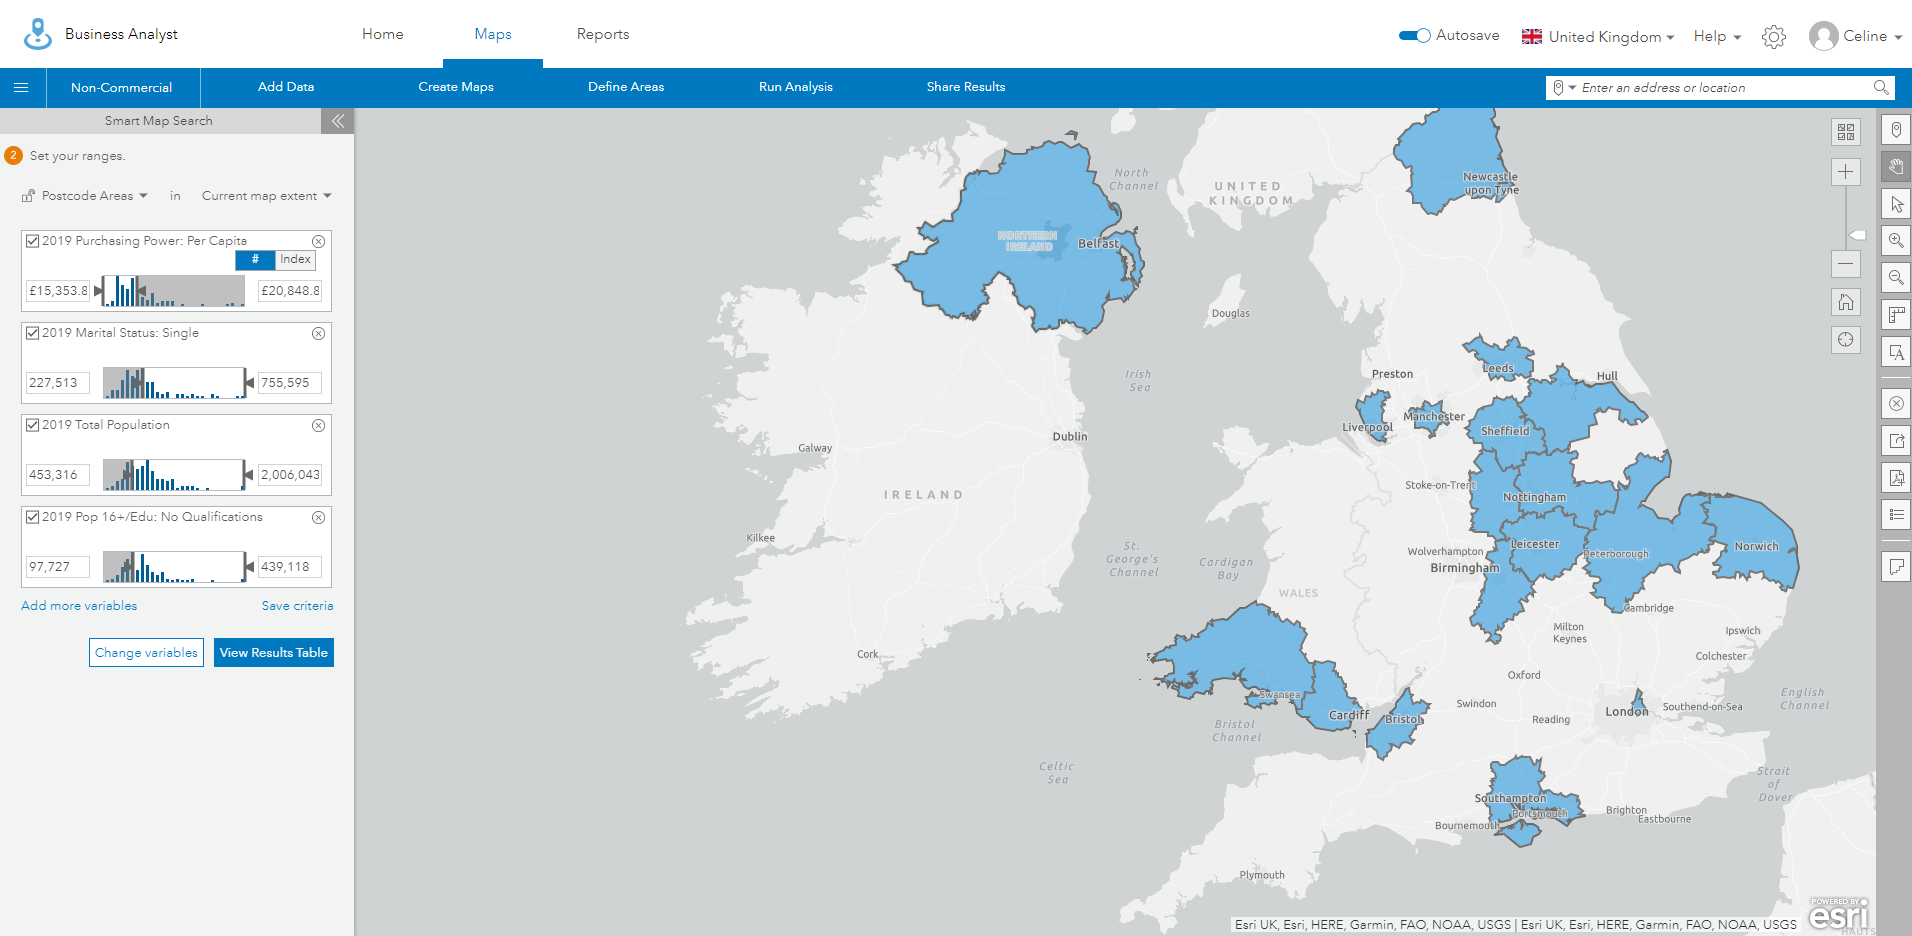
The Business Analyst Web interface displaying the Smart Map Search tool.
Analysts working for regional health care, emergency services or social support initiatives use this tool to better understand the spatial spread of demographics of a specific character: for example, vulnerable communities with a low purchasing power and education attainment rate. Businesses, such as car dealerships use this to locate where the market segment of their target customers is physically clustered and focus their marketing campaigns on regions that meet these demographic criteria.
The data integration!
Combine Esri demographics, Living Atlas layers, your own data and more.
Besides the built-in Esri Demographics it is possible to analyse external data products. You can add web maps and layers from ArcGIS Online: including publicly shared community layers or content from the Living Atlas which is verified by our Data Curators.
For example, If you want to investigate how different areas score on the number of Amenities, Medical Facilities or Tourist Attractions located within them, you can use various OpenStreetMap layers accessible through the Living Atlas!
You can also configure your organisation’s own data to be included as variables through the Custom Data Setup tool. A supermarket chain, for instance, might have data on where their suppliers, distribution centres and customers are located. Alternatively, if the focus of your analysis is on detecting socio-economic patterns, you might want to add open source Census data on crime and drug incident rates through the data setup tool.
The site comparison!
Identify gaps in resource coverage.
The Void Analysis tool can be used to calculate the sum of a specific type of site located within two areas that you’re interested in comparing. You can set one area as the target and the other as the reference layer and the Void Analysis tool calculates whether there is a relative surplus or deficit in the target area compared to the reference area. It’s a quick way to validate the appropriate distribution of resources, store locations for example, or health care clinics.
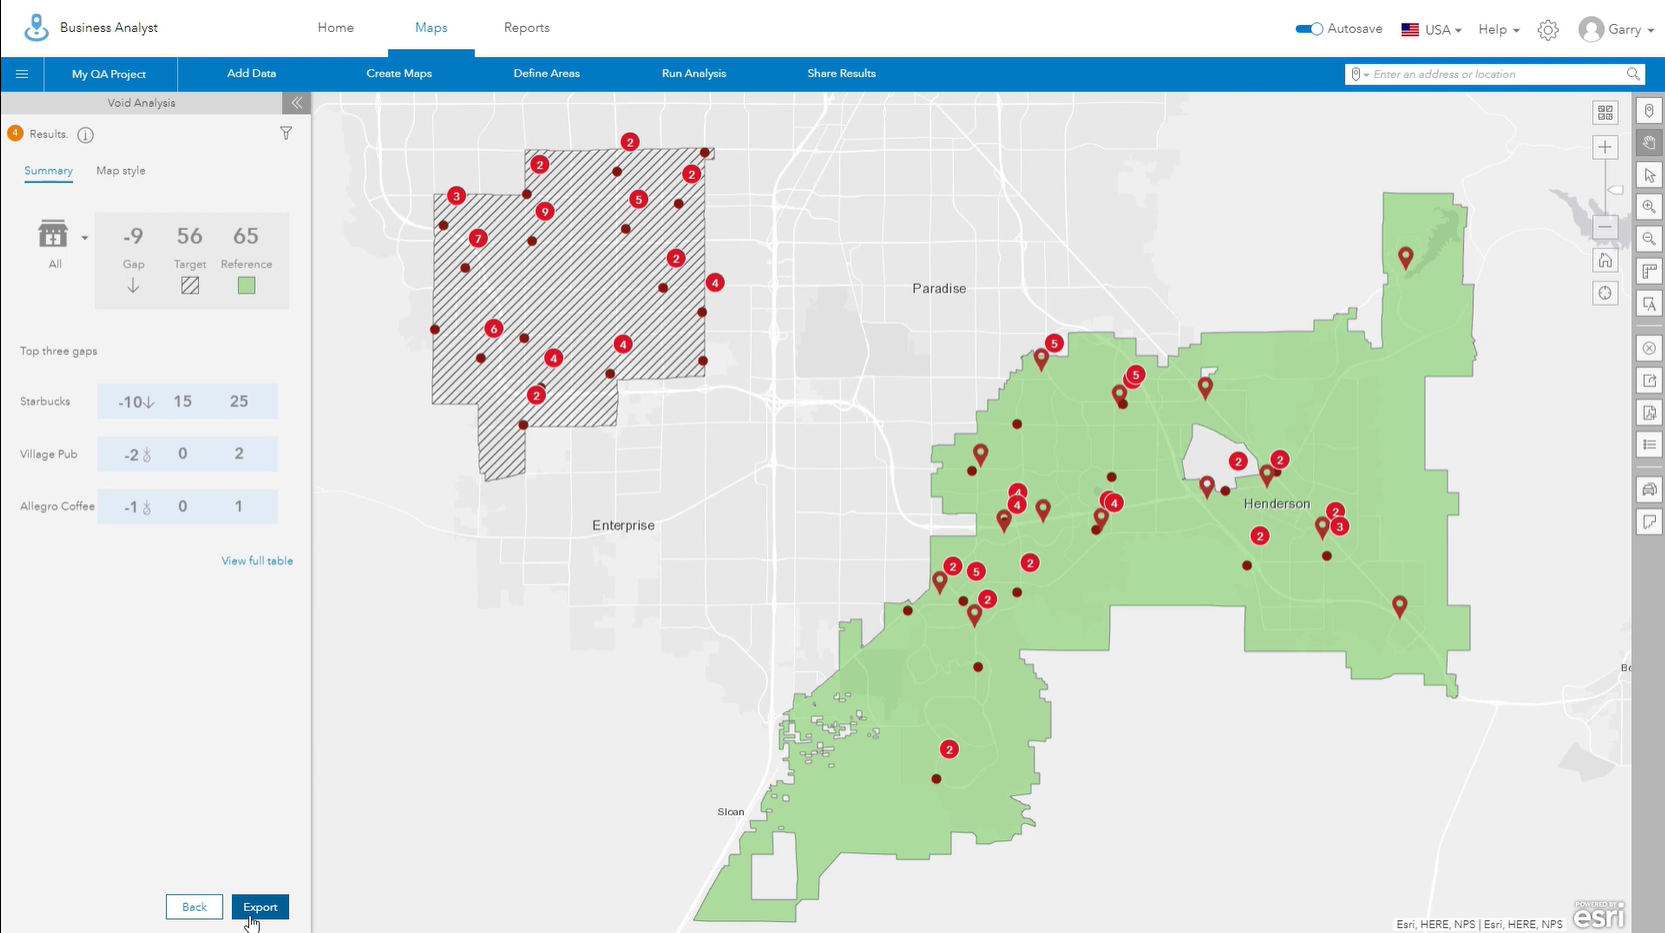
The Business Analyst Web interface displaying the Void Analysis tool.
There is a spatial inequality in the type of shops that are present in the one area compared to the other. This tool it pinpoints on what criteria (type of shop in this example) there are gaps so you resolve them.
The suitability analysis!
Generate a weighted ranking to aid the search for optimal sites.
The Suitability Analysis tool allows you to identify the optimal locations, for offices or factories for example, from a set of candidates, by applying multiple weighted criteria.
If you plot addresses of potential sites onto your Business Analyst map interface, you can rank them based on one of the built-in demographic criteria such as total population, or spending patterns of the area that each candidate site is located in. Additionally, you can select fields from the site’s attribute table as criteria: the monthly rent or size of the site for example.
By default, all the criteria are weighted equally, but you can increase the weight of one of the criteria to elevate its importance in the final ranking.
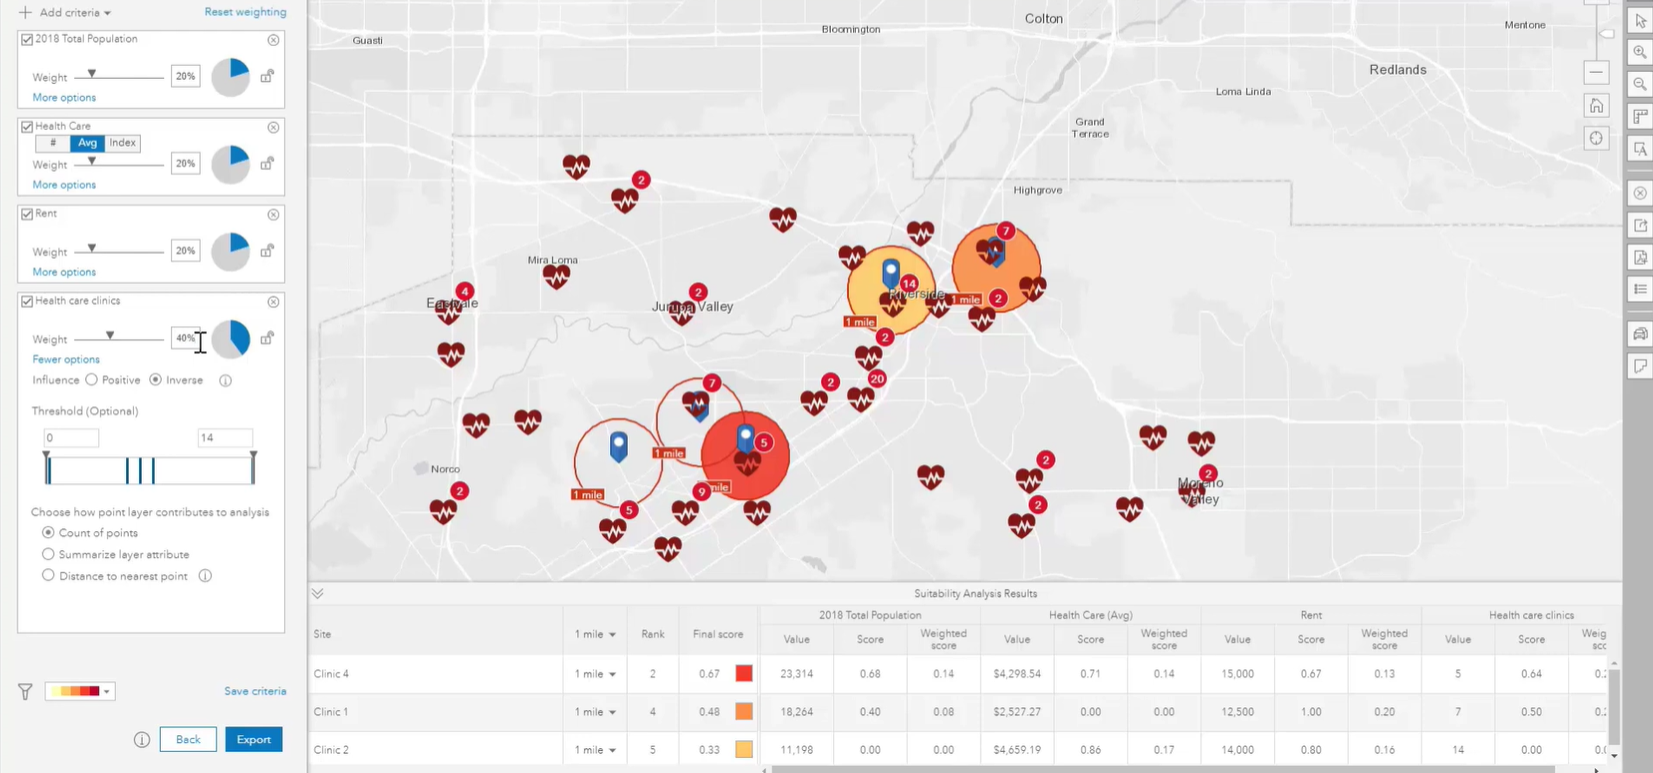
The Business Analyst Web interface displaying the Suitability Analysis tool.
As can be seen, higher rent is less desirable, so an inverse influence can be selected to give greater preference to locations that will cost less. It is also possible to eliminate locations that have too high a rent by setting a maximum threshold.
The visual analytics!
Produce high quality collateral for report-backs and stakeholder engagement.
As a spatial planner, it’s often important to present clear and appealing figures of the analysis you have conducted. Business Analyst has many built in tools to help you produce compelling materials, such as reports and beautiful interactive infographics.
You can also choose to share your analysis with the wider community or stakeholders of your organisation through a Business Analyst Story Map or by exporting your project as a web map to ArcGIS Online.
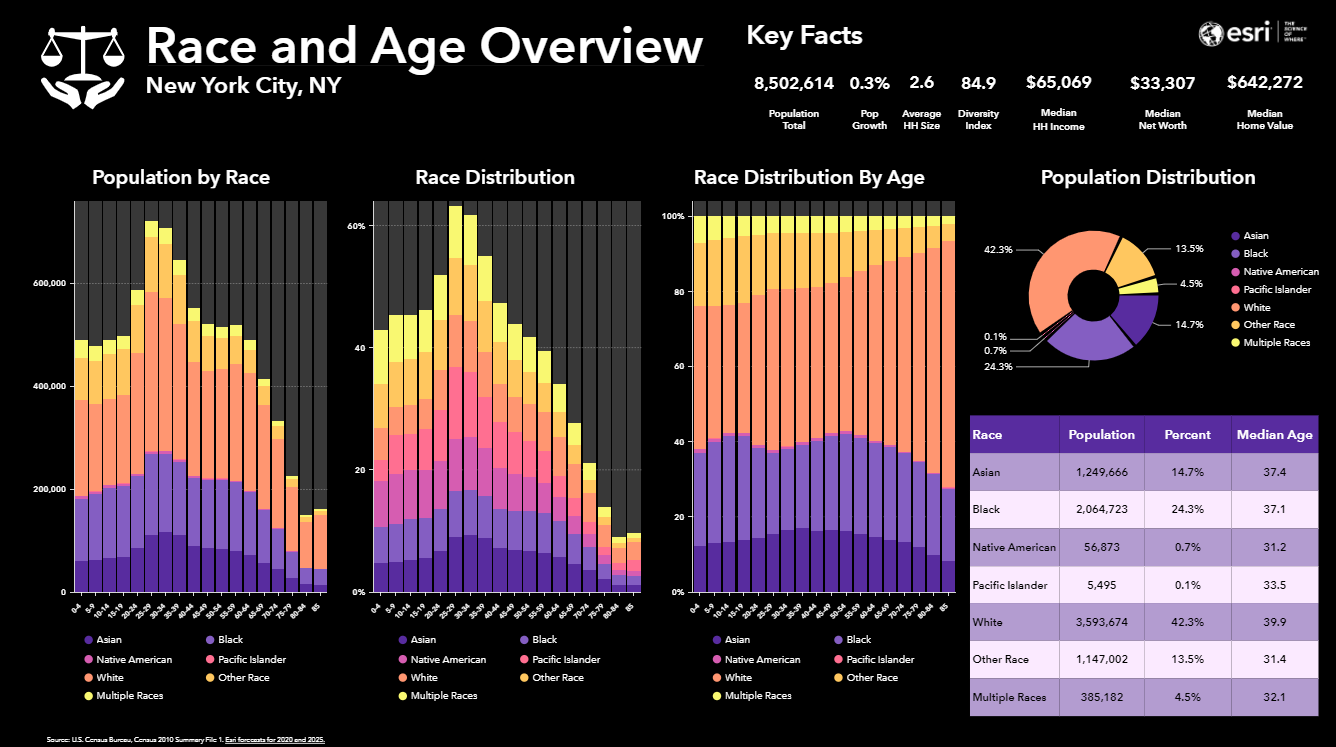
These visually compelling infographics can contain charts, graphics, tables, images and text that can be styled to make them more engaging! Find the dynamic version of this infographic here.
There you have it: range sliders, data integration, site comparison, suitability analysis and visual analytics. Our top five reasons to choose Business Analyst Web as a spatial planner, strategist or analyst!
Or maybe I should swop one of those for one of the features in the newest version? But then I’d have to decide between exporting data from infographics or the integration with ArcGIS Dashboards. So I’ll leave you to look into the recent changes for yourself.
For more information on Business Analyst Web, please have a look at the following resources: