Over the last 10 years or so, imagery has been more widely adopted as part of an organisation’s set of core datasets. This is due partly to the decreasing costs of sourcing the imagery and the increasing availability of imagery, for example through the Living Atlas of the World. Added to this are cheaper methods of image management and storage with a Software as a Service Solution through ArcGIS Image for ArcGIS Online, and the ease of access of functions and tools to perform the actual processing.
In this article I would like to introduce you to some of the image analysis, management and processing tools which are available in ArcGIS Pro as Raster Functions and Spectral Indices.
So what is a Raster Function?
A raster function is an operation that can be applied directly to the pixels of an image or raster dataset. You can use raster functions for radiometric and geometric correction, data management, visualisation and analysis.
Raster functions are fast! This is because the processing operation is only applied to the pixels in the current map view. Calculations are applied to the pixels on-the-fly as you pan and zoom around the map.
You can access the raster functions via the Raster Functions pane, which can be found on either the Imagery or the Analysis tab in ArcGIS Pro.
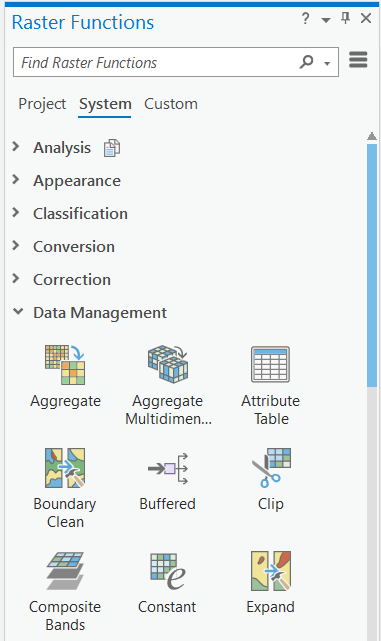
The functions are organised into categories. If you don’t want to trawl through all of the various categories then you can search for the function of your choice.
Let’s look at a really quick example of using functions. In the picture below I have taken some Environment Agency lidar data and created a raster mosaic dataset for an area of the Isle of Wight. You can see that lidar returns have been captured in areas in the sea.
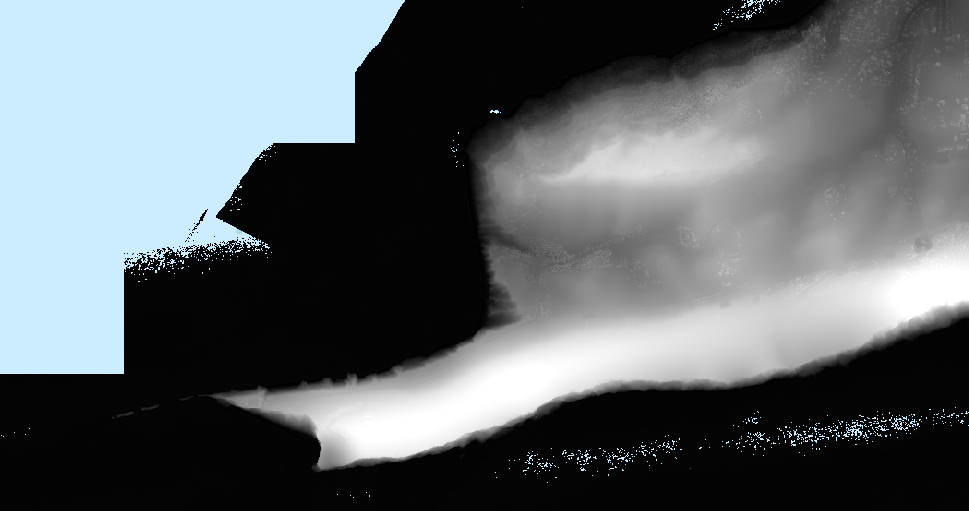
Ideally, I would like to remove those unwanted returns before performing some processing on the remaining pixels.
By using a combination of the Set Null, Mask and Shaded Relief functions the following output can be generated:
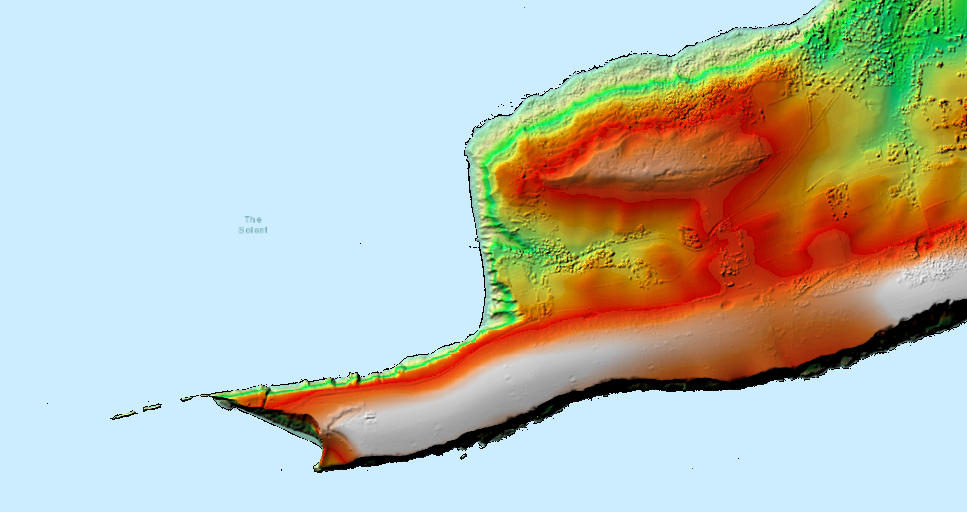
It looks really good in a 3D scene… If you don’t believe me then have a look at the banner picture for this blog.
A list of all of the functions and licensing requirements can be found here.
Functions can be chained together
Functions can be chained together to create a raster function template. Think of it as the raster equivalent of a geoprocessing model.
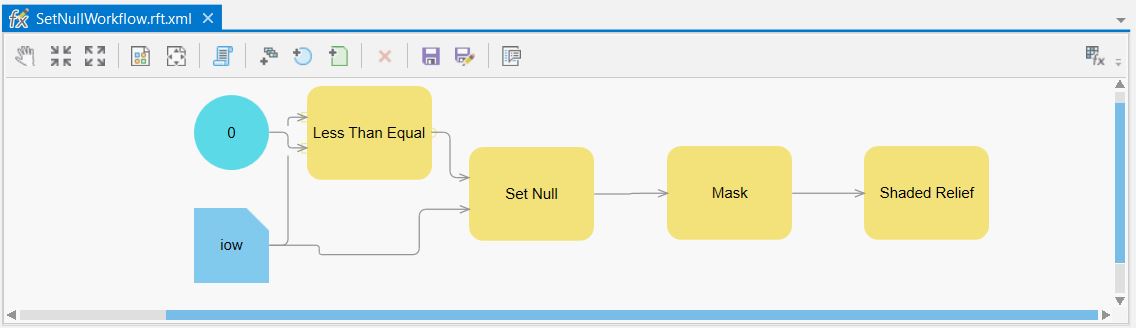
A raster function template is built by using the tools on the Function Editor window and by choosing the functions from the Functions Pane. You create the function template in pretty much the same way as you would create a traditional geoprocessing model by dragging and dropping tools from the Geoprocessing pane in ArcGIS Pro
Function templates can be shared between different ArcGIS Pro projects and can be applied to mosaic datasets or any supported raster dataset, including multidimensional data, allowing you to display your imagery as information layers.
But what about these things called Spectral Indices?
ArcGIS Pro also provides a streamlined option for visualising and processing imagery in the form of spectral indices. The indices provide you with the ability to combine pixel values from 2 or more spectral bands in a multispectral image to produce new insights of a particular phenomena which may be hidden inside of the image. They are usually associated with land cover studies.
The indices are available on the Imagery tab via the Indices button:
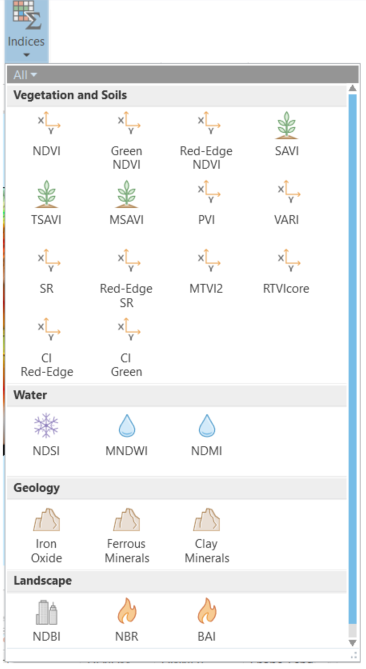
If there is an index you wish to use that isn’t available as a pre-defined index then you can use either the Calculator or the Band Arithmetic functions.
The indices are also available as raster functions.
What’s the difference between ArcGIS raster functions and geoprocessing tools?
Characteristics of Raster Functions:
- Rapid processing.
- Result is held in memory.
- Functions can be collated into a function chain and shared within imagery as a processing template.
Characteristics of geoprocessing tools:
- They are slow to execute.
- Permanent data is created.
- Used in ModelBuilder with non-imagery based tools.
How can I learn more?
So now that your appetite has been whetted do you want to try some of these functions out yourself?
If the answer is “YES!” then there is a fantastic step-by-step guide which is available on the Learn ArcGIS website. The 30 minute guide is called “Assess hail damage in cornfields with satellite imagery” and is available for ArcGIS Pro, ArcGIS Online and ArcGIS Enterprise. In the guided lesson you will use an existing index called the Soil-Adjusted Vegetation Index (SAVI).
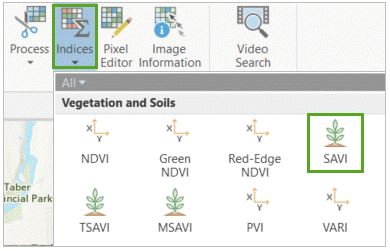
SAVI is an improvement on the classic NDVI as it seeks to minimise the influence of soil brightness.
If you fancy having a go then you can access the lesson from here. And don’t worry, all the data is wrapped up in the exercise – all you have to do is download the corresponding zip file.
If you want some dedicated time to explore these concepts in more detail then we have a great new course called “Imagery Analysis in ArcGIS Pro”. Just search for the term “image” in the Learning Services Catalogue.
And there you have it!
Imagery in ArcGIS is more than just basemaps. You now have the ability to view, process, share and use imagery in all aspects of the ArcGIS system. I think you can see that ArcGIS is fast becoming a pretty handy image processing system.