Update
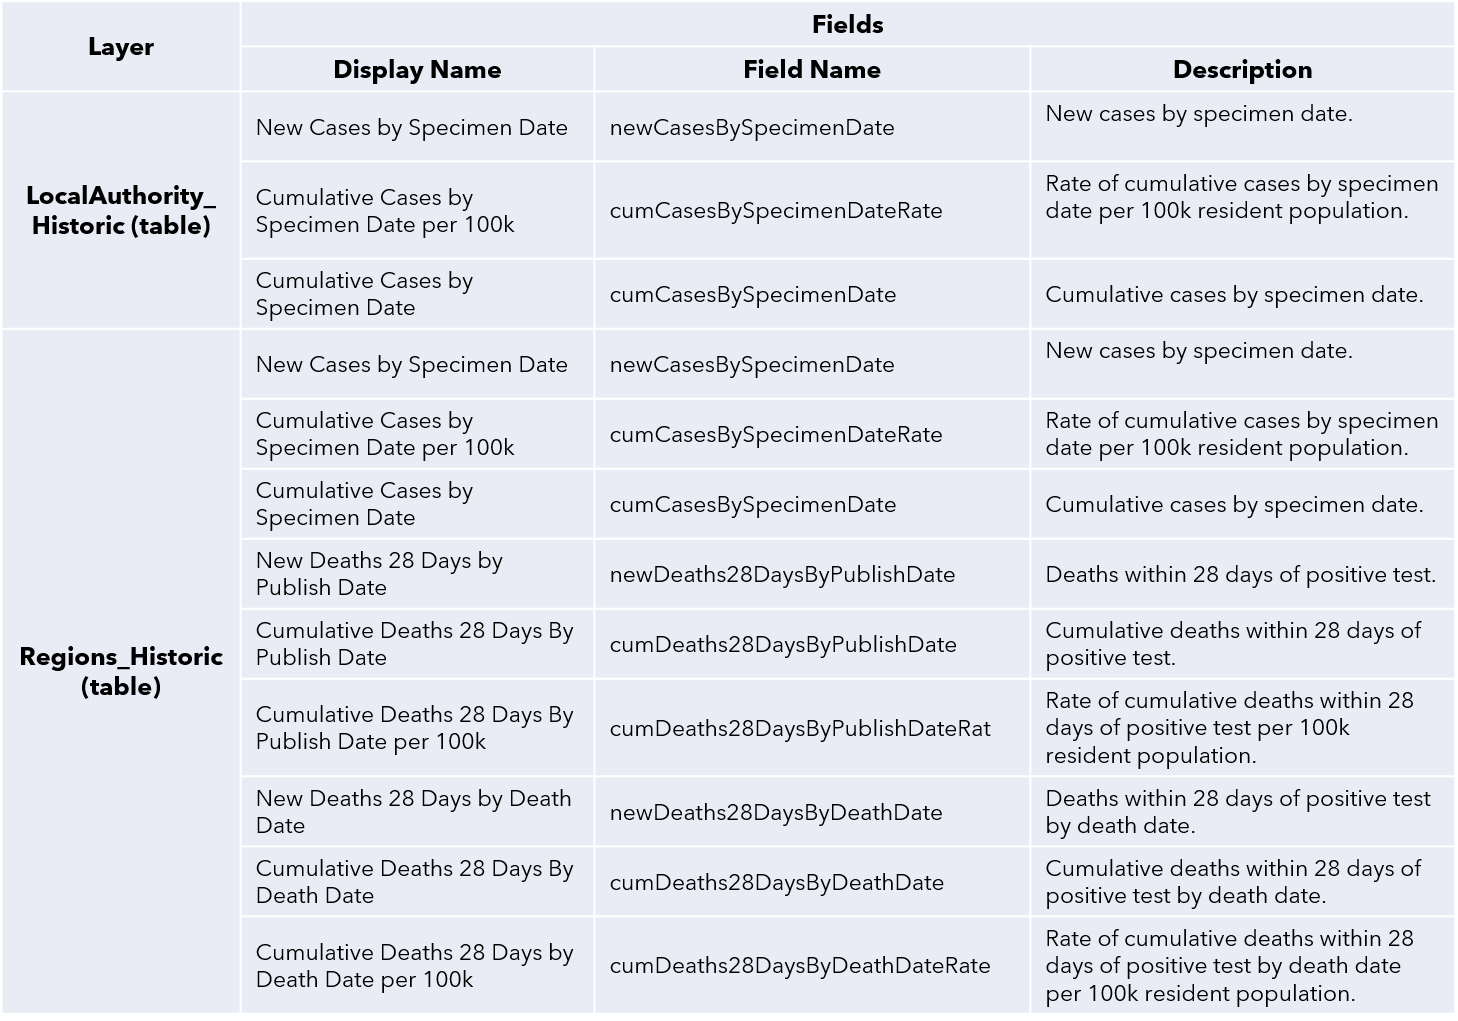
Since the blog was originally posted the historic data tables have been added to the service. The field details are below
The service
Esri UK’s “UK COVID-19 Data” is a feature service containing coronavirus (COVID-19) data automatically updated from the Public Health England (PHE) API, on a daily basis. It is open to anyone with an ArcGIS Online subscription, hosted in the ArcGIS Living Atlas of the World.
This service has been created so that users can seamlessly access this authoritative data within ArcGIS. Users can create maps and carry out analysis to help public understanding and response planning for decision-makers in a rapidly changing environment.
Please be aware that, although the service is updated daily, the delay between PHE’s specimen and reporting dates means there is a 2-day offset in the service data. Specimen date refers to the date the specimen was collected from the patient and Reporting date comes from the date the laboratory submits the report to PHE. Using the PHE API, our service takes the current day request minus two days to account for the offset. Anyone pulling the service into a live map or dashboard can rely upon the latest available information as it will be updated every day.
The service currently contains three polygon layers of spatial data, providing information on the latest cumulative figures at Local Authority, Regional and National levels. The tables in the service contain historic case data at the same three geographies. You can create time-enabled visuals using the service, by using the Join tool with the polygon layers and tables and view spatial patterns over time.
A full breakdown of the layers and their fields that make up the service can be seen at the end of this blog.
Usage
From the item details page, you can choose to open the service within the ArcGIS Online Map Viewer (and Map Viewer Beta), ArcGIS Desktop (Pro and ArcMap), or export the data to a number of different formats.
Below we’ve added the service directly to a new map in ArcGIS Online. Default symbology shows location only. We chose this single symbology renderer due to the continuously unpredictable nature of COVID-19 statistics, whereby classification in the legend needs to be monitored to reflect the latest data. A static classification may become ineffective as the data ranges change.
This means users have full control over their own data classification method, but also need to ensure they can update the ranges themselves if their chosen symbology no longer accurately reflects the data.
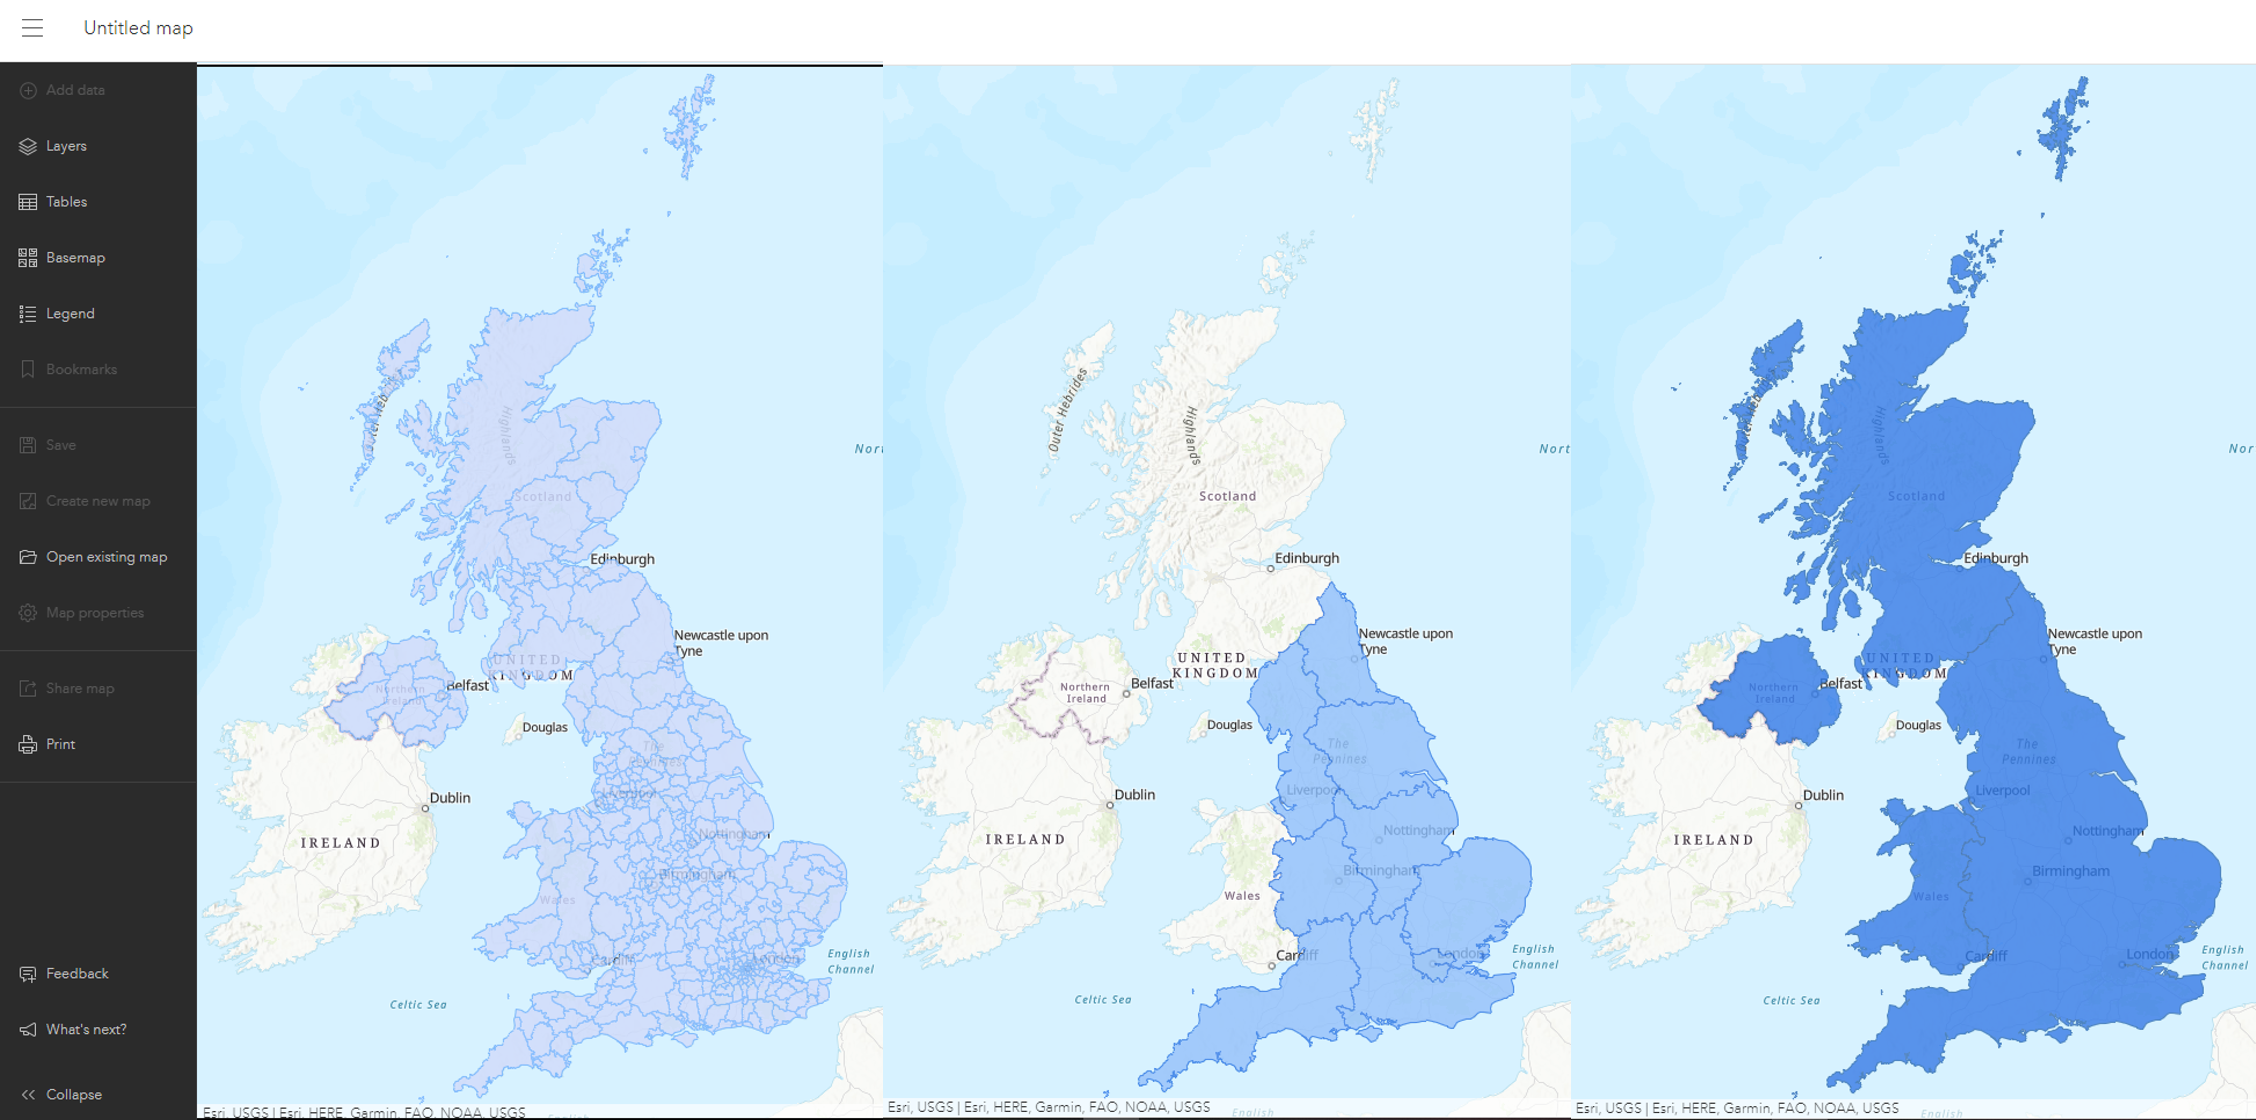
UK COVID-19 Data service opened within Map Viewer Beta with default symbology. Local Authority layer (left), Regions Layer (centre) and Nations layer (right) all have a single symbology renderer displaying location when added to a map.
Pop-ups have been pre-configured for the service, giving some key attribute information and COVID-19 statistics for each geography. You can author new attribute expressions to extend your pop-ups, by using HTML in the Map Viewer and Arcade in the Map Viewer Beta.
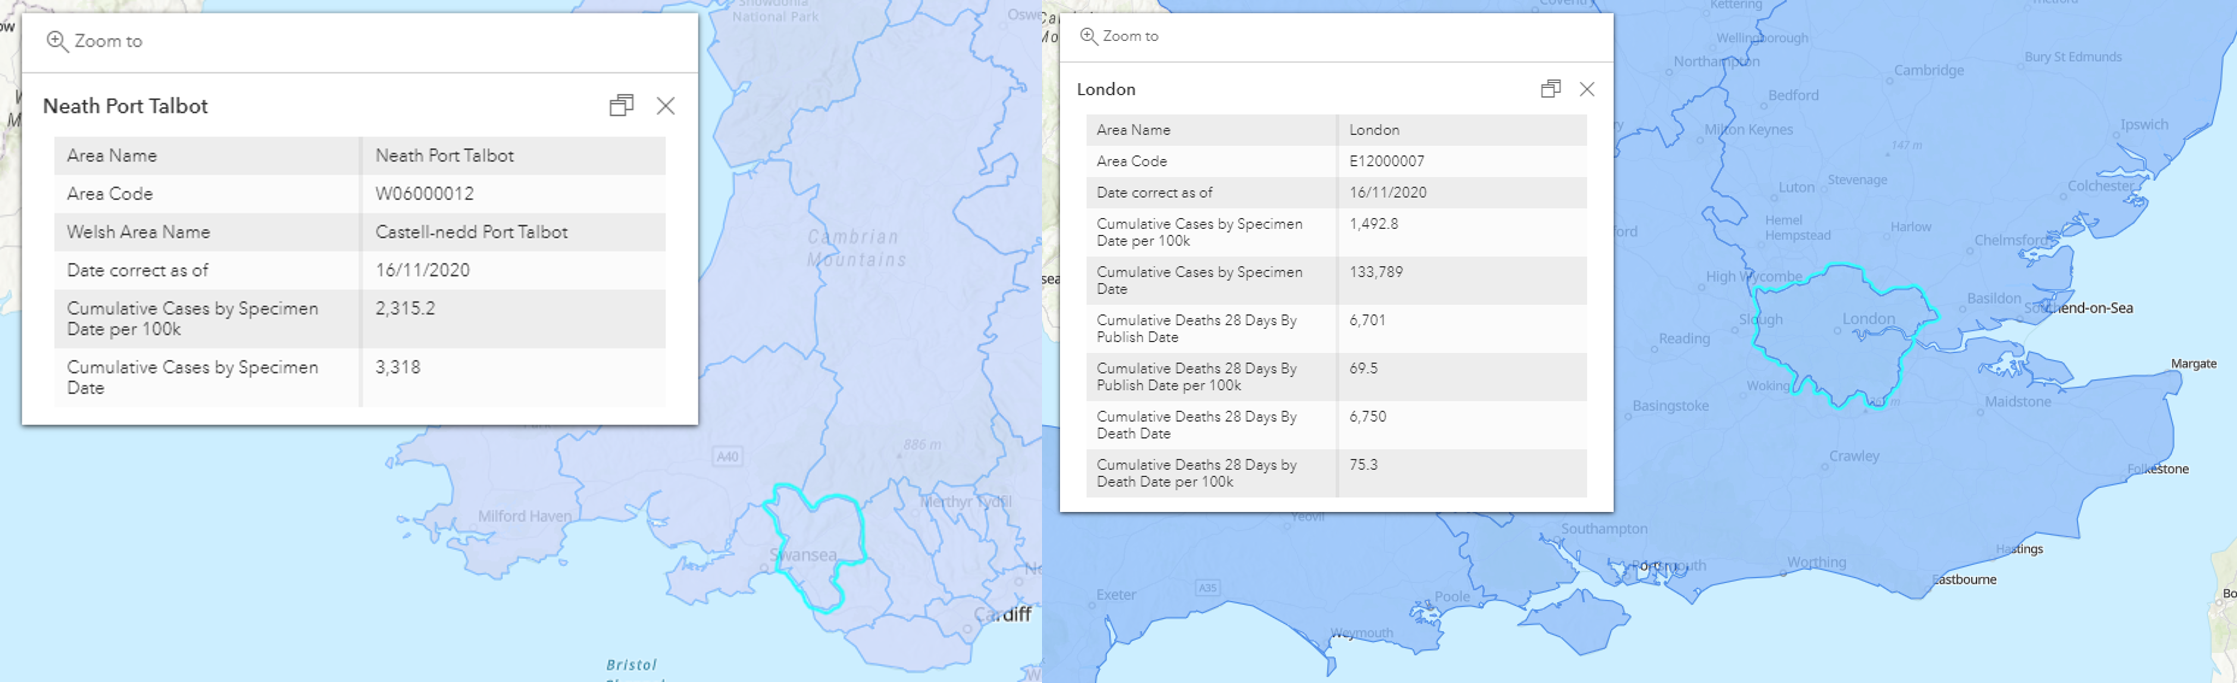
Pop-ups are pre-configured for each layer within the service. Attribute information is shown for Neath Port Talbot from the Local Authority layer (left) and London from the Regions layer (right).
Below are a few options for displaying the service using ArcGIS Online’s Map Viewer Beta, showing the range of visuals users can produce with little configuration.
The dot density style in the map viewer lends itself to displaying cumulative case count by effectively visualizing density differences in geographic distributions across large areas. Here we chose the Dark Gray Canvas basemap and a neutral background symbol, showing cumulative cases within each local authority boundary across the UK.
A dot-density map showing cumulative COVID-19 cases across the UK. Slide the dot value to explore various dot density strengths and immediately view the changes on the map.
Next, we chose to display the rate of cumulative cases in the Local Authority layer using a graduated symbology and some data classification. Below, you can see 5 classes of Natural Breaks. With natural breaks, or ‘Jenks’, the classes are based on groupings inherent in the data.
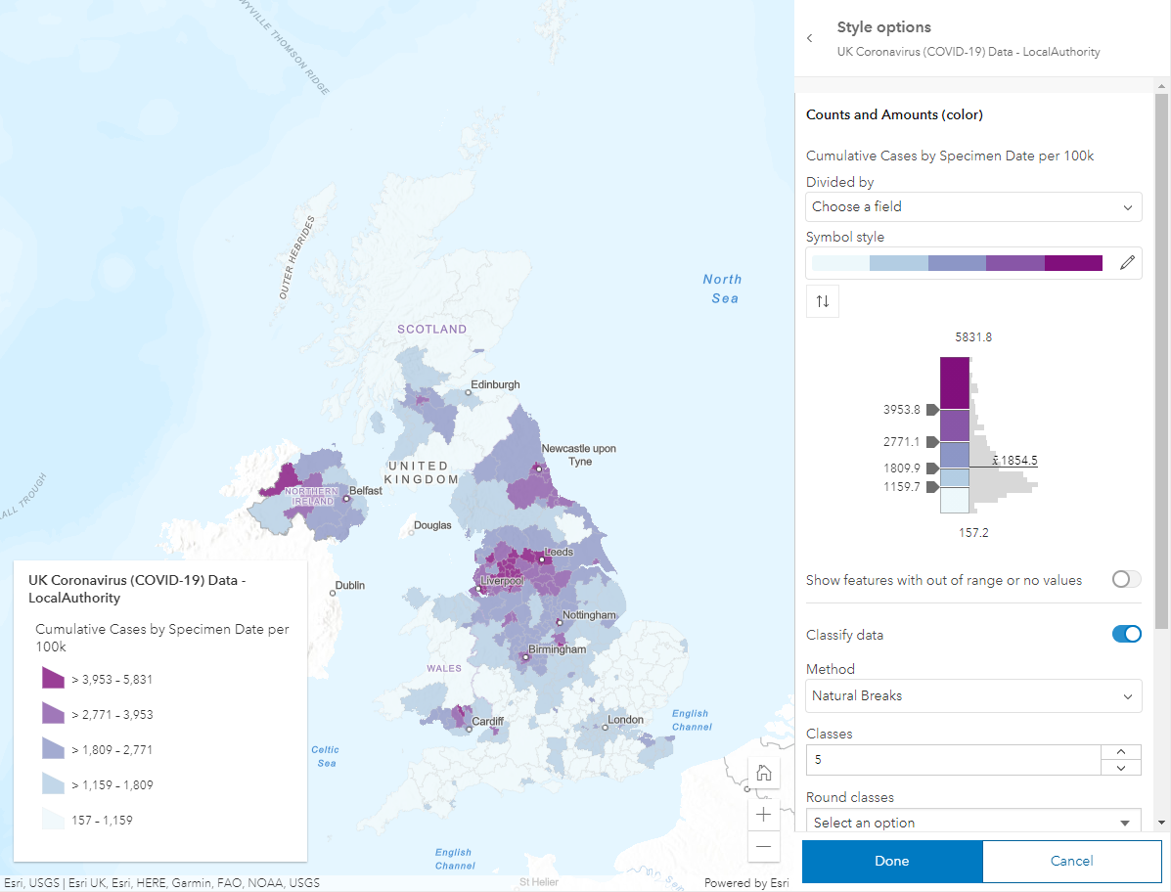
A graduated symbology map showing the rate of COVID-19 cases per 100k resident population across the UK. Natural break classes have been used to highlight the areas where the rate of cases is the highest, namely the North West and North East of England, Glasgow city and Derry City and Strabane, Northern Ireland.
Finally, by joining up with the tables of historic case data in the service you can create time-enabled visualisations. Here’s an example showing the spread of COVID-19 cases across the UK from the start of this year until Nov 23rd:
We hope you find this service useful. We’re looking forward to seeing what users are able to create with this latest addition to the Living Atlas.
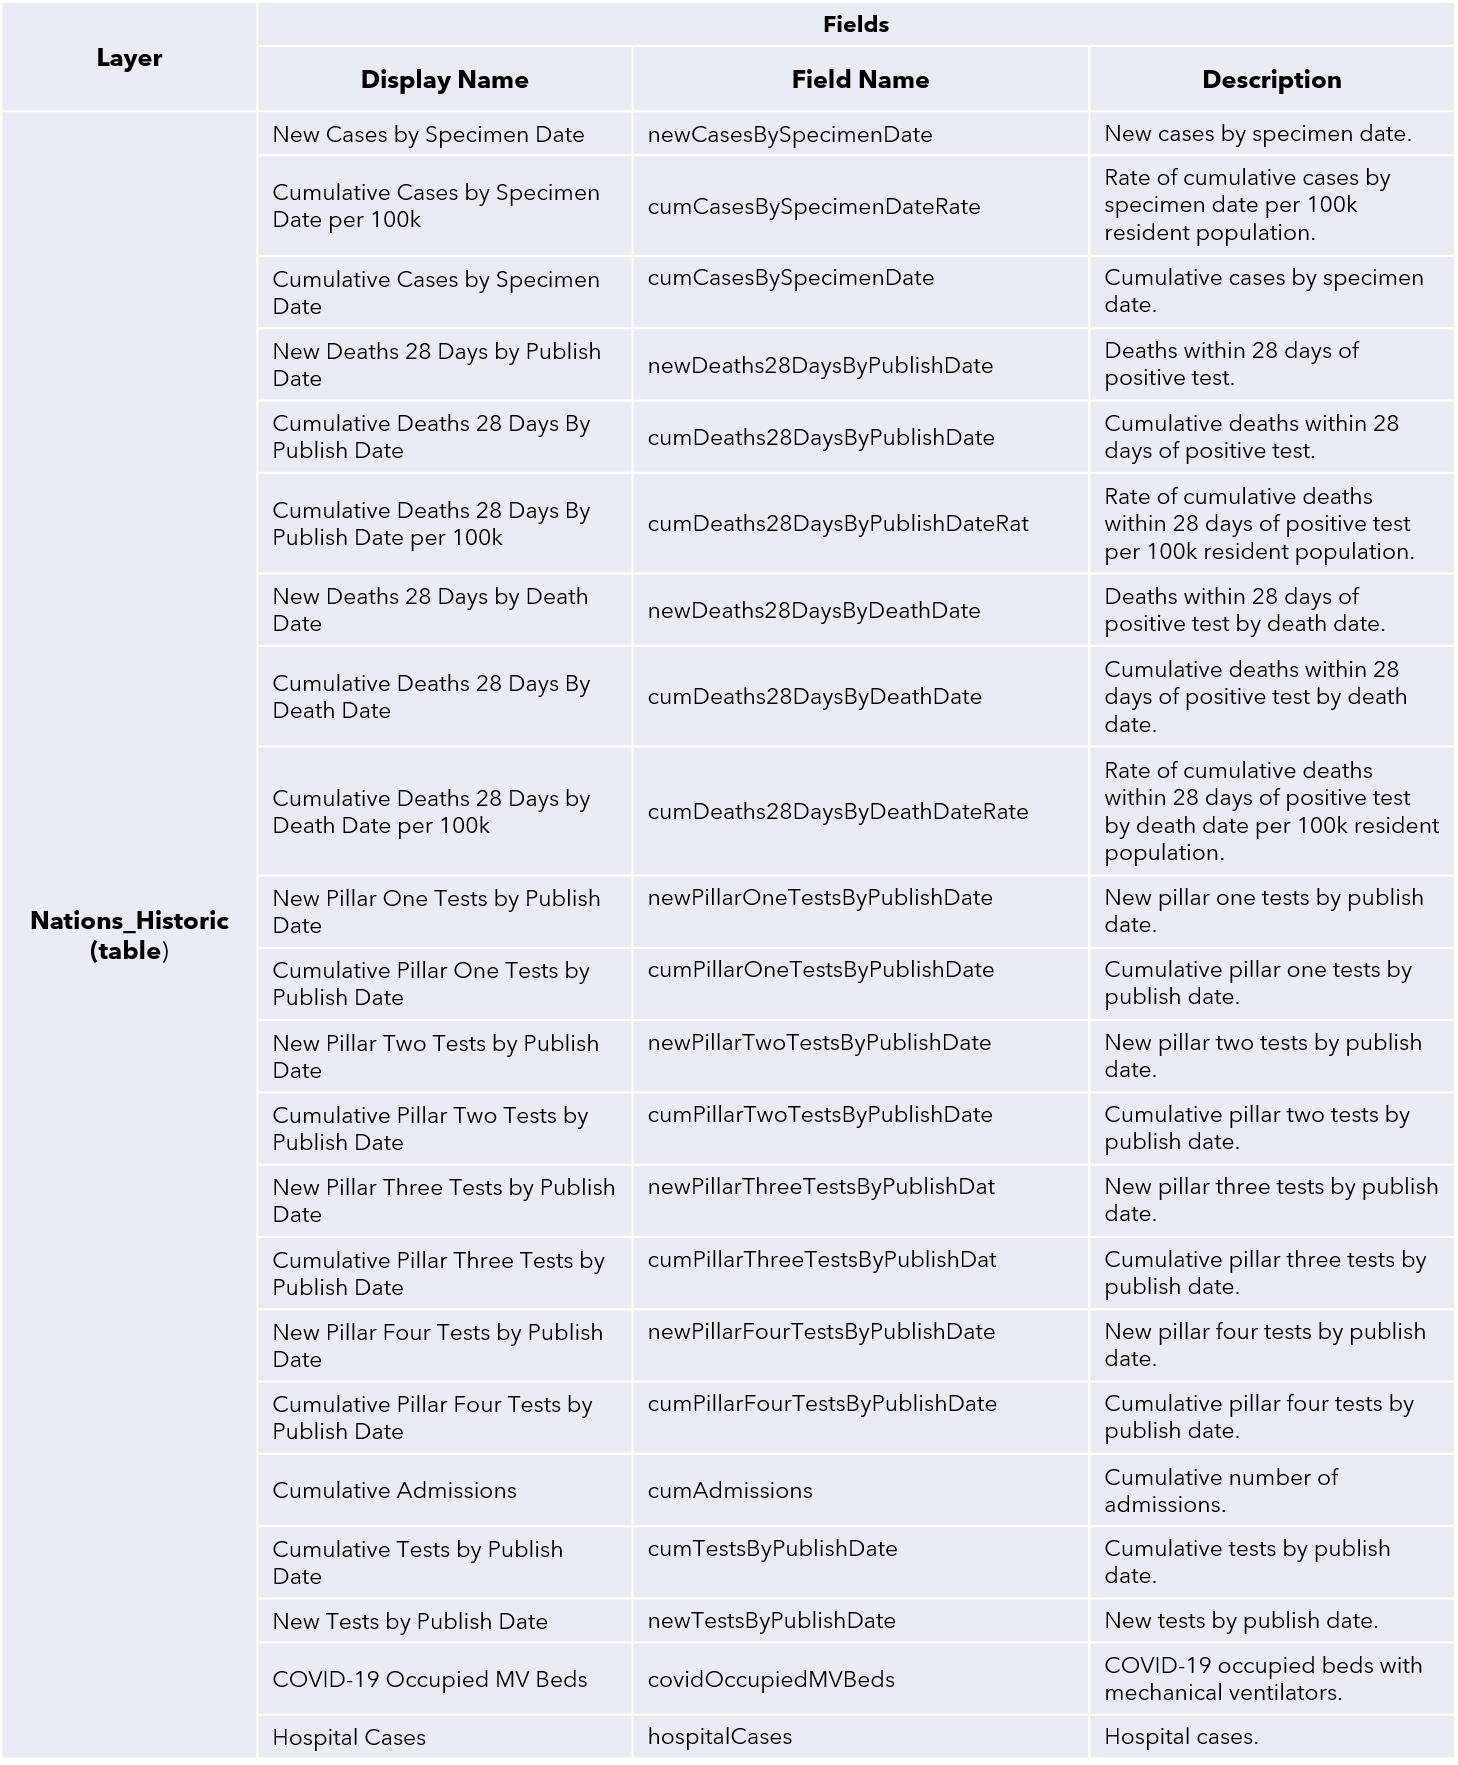
Field Details
Below is a full list of the fields currently available in each layer of the service. For clarity, each field was given a more descriptive Display Name, along with a Description following the naming convention and descriptions given in PHE’s API documentation.
You can also access the field details on the item details data tab here.
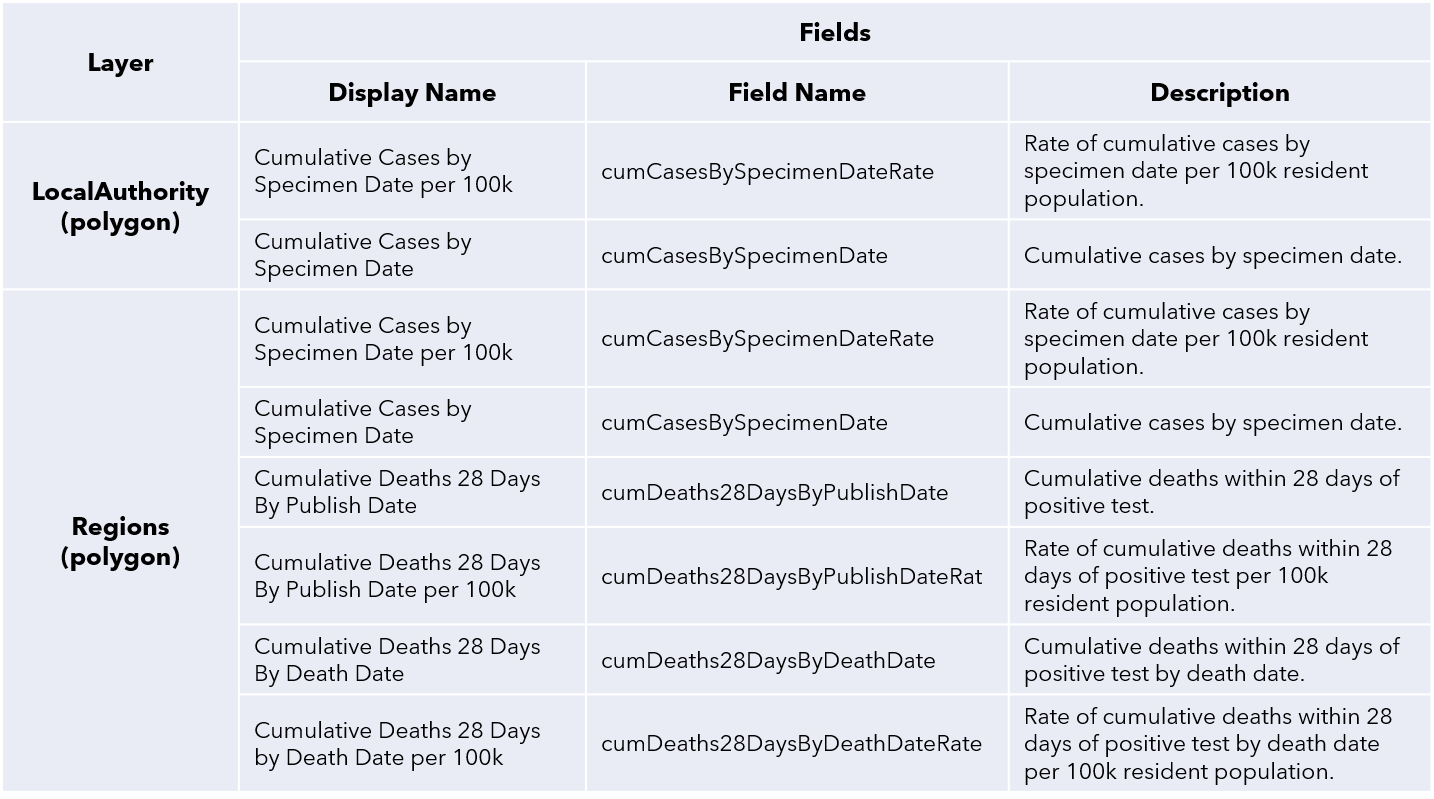
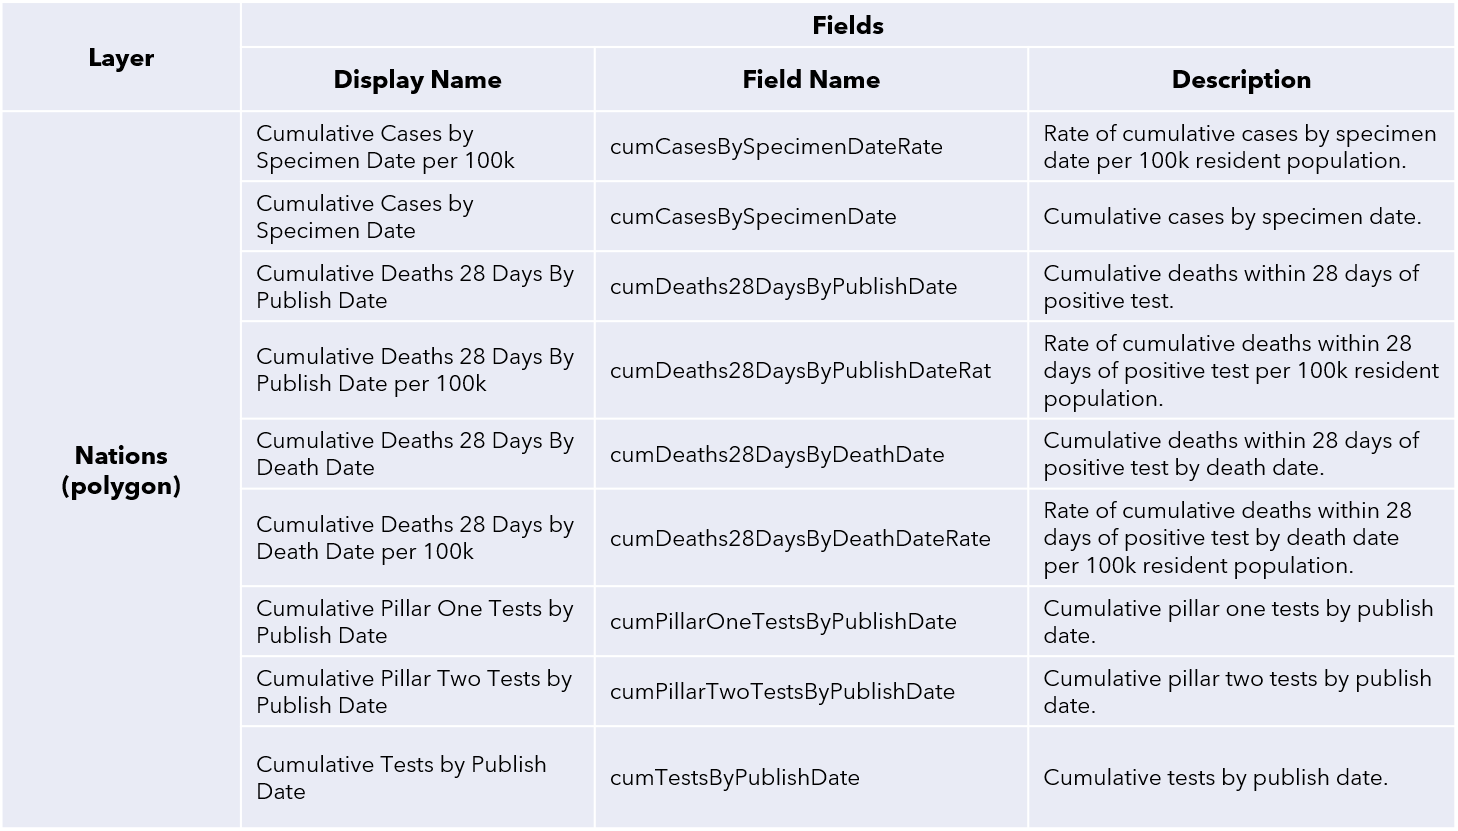
Historic fields