The landscape of charitable causes is a broad one. Think of the big or small charity organisations that strive to make the world a better place by supporting causes such as: animals, arts and culture, community development, education, environmental, health, human and international relief. There are over 180,000 charities in England and Wales alone and whilst causes vary, the core of the mission is largely the same; to understand a situation, to act, to measure and monitor your impact and communicate your work to the public and/or various stakeholders, grant funders and donors.
So, whether it’s encouraging the use of greener transport to improve local air quality, educating youth groups about the benefits of planting trees, or shedding light on the increased demand for food banks or homeless shelters – these challenges are inherently spatial, so a geographic approach with good spatial data helps to solve them.
So how can you start making sense of your organisation’s data to make better decisions?
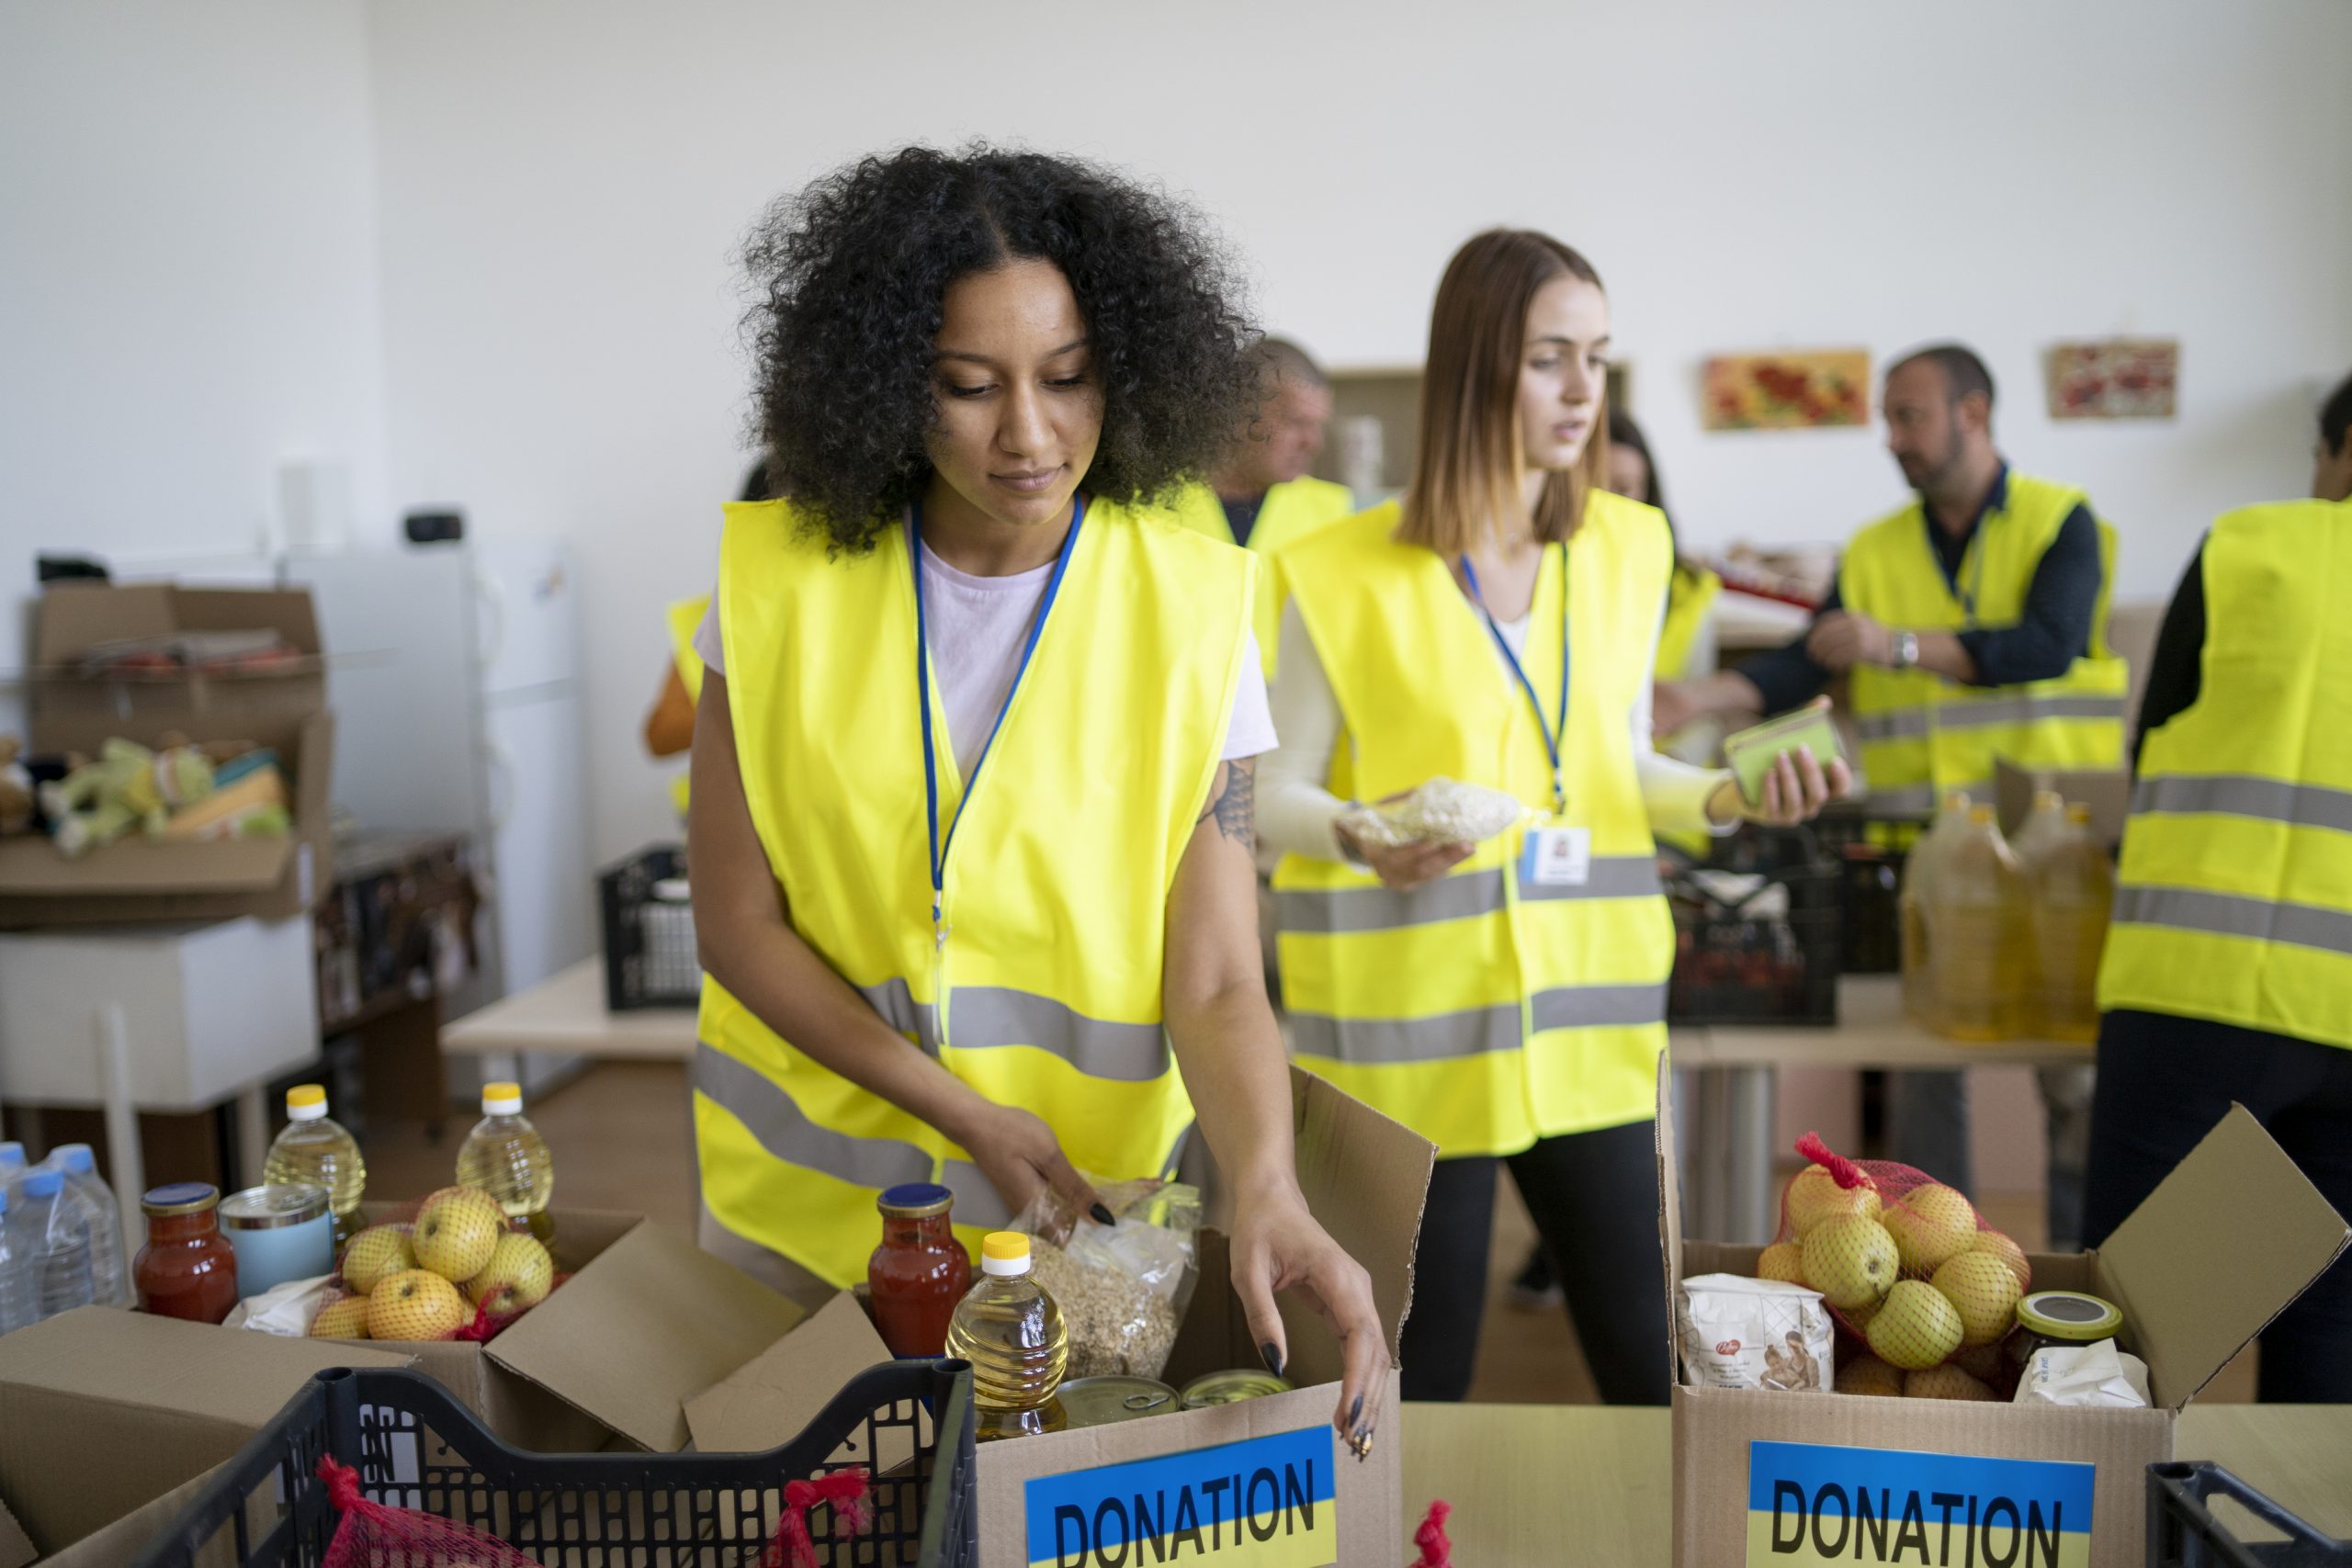
A group of charity workers preparing food donation boxes for Ukrainian people
Your map is only as good as the data in it
Charitable organisations will typically hold data on things important to them. Assets such as buildings, estates, addresses where certain health services are being delivered or areas of high conservation value that need to be protected across the countryside. This data when visually portrayed on a map helps viewers digest information faster. Stakeholders can instantly see where assets are in a way that a spreadsheet of data simply cannot.
But what if you started to add more layers of data to your map? Say you wanted to contextualise your services in the area that they serve. Are they being run in an area that has the most need or are they, through no fault of your own, being run from an area that is inaccessible to where the demand really is. Adding datasets such as the Index of Multiple Deprivation to your map will instantly contextualise your data and show you the relationship and patterns. Are there gaps in your service delivery across the geographic area you serve, and do you need to rethink where your services are run? From this kind of analysis, you can start to make better decisions using a geographical lens.
Access authoritative, ready-to-use data at your fingertips
Authoritative spatial data to help with these decisions can be sourced from Esri’s ArcGIS Living Atlas of the World – a curated global data catalogue featuring open, ready-to-use spatial data. From Basemaps to Boundaries, to Imagery, to Demographics, Infrastructure and Environmental layers of data – you could be supersizing the data on your maps to aid better and more thorough analysis. What’s more, you can trust the data in Living Atlas. It will have been through a stringent checking process before it gets published to this catalogue and the author of the data will be named checked so you can refer to the source with absolute confidence. Bring meaning to your own data by leveraging Living Atlas.
Check out this StoryMap to take a deeper dive in to what data is available in Living Atlas and that is the most relevant for nonprofit organisations. You may even spot some datasets published by charities that you collaborate with already!
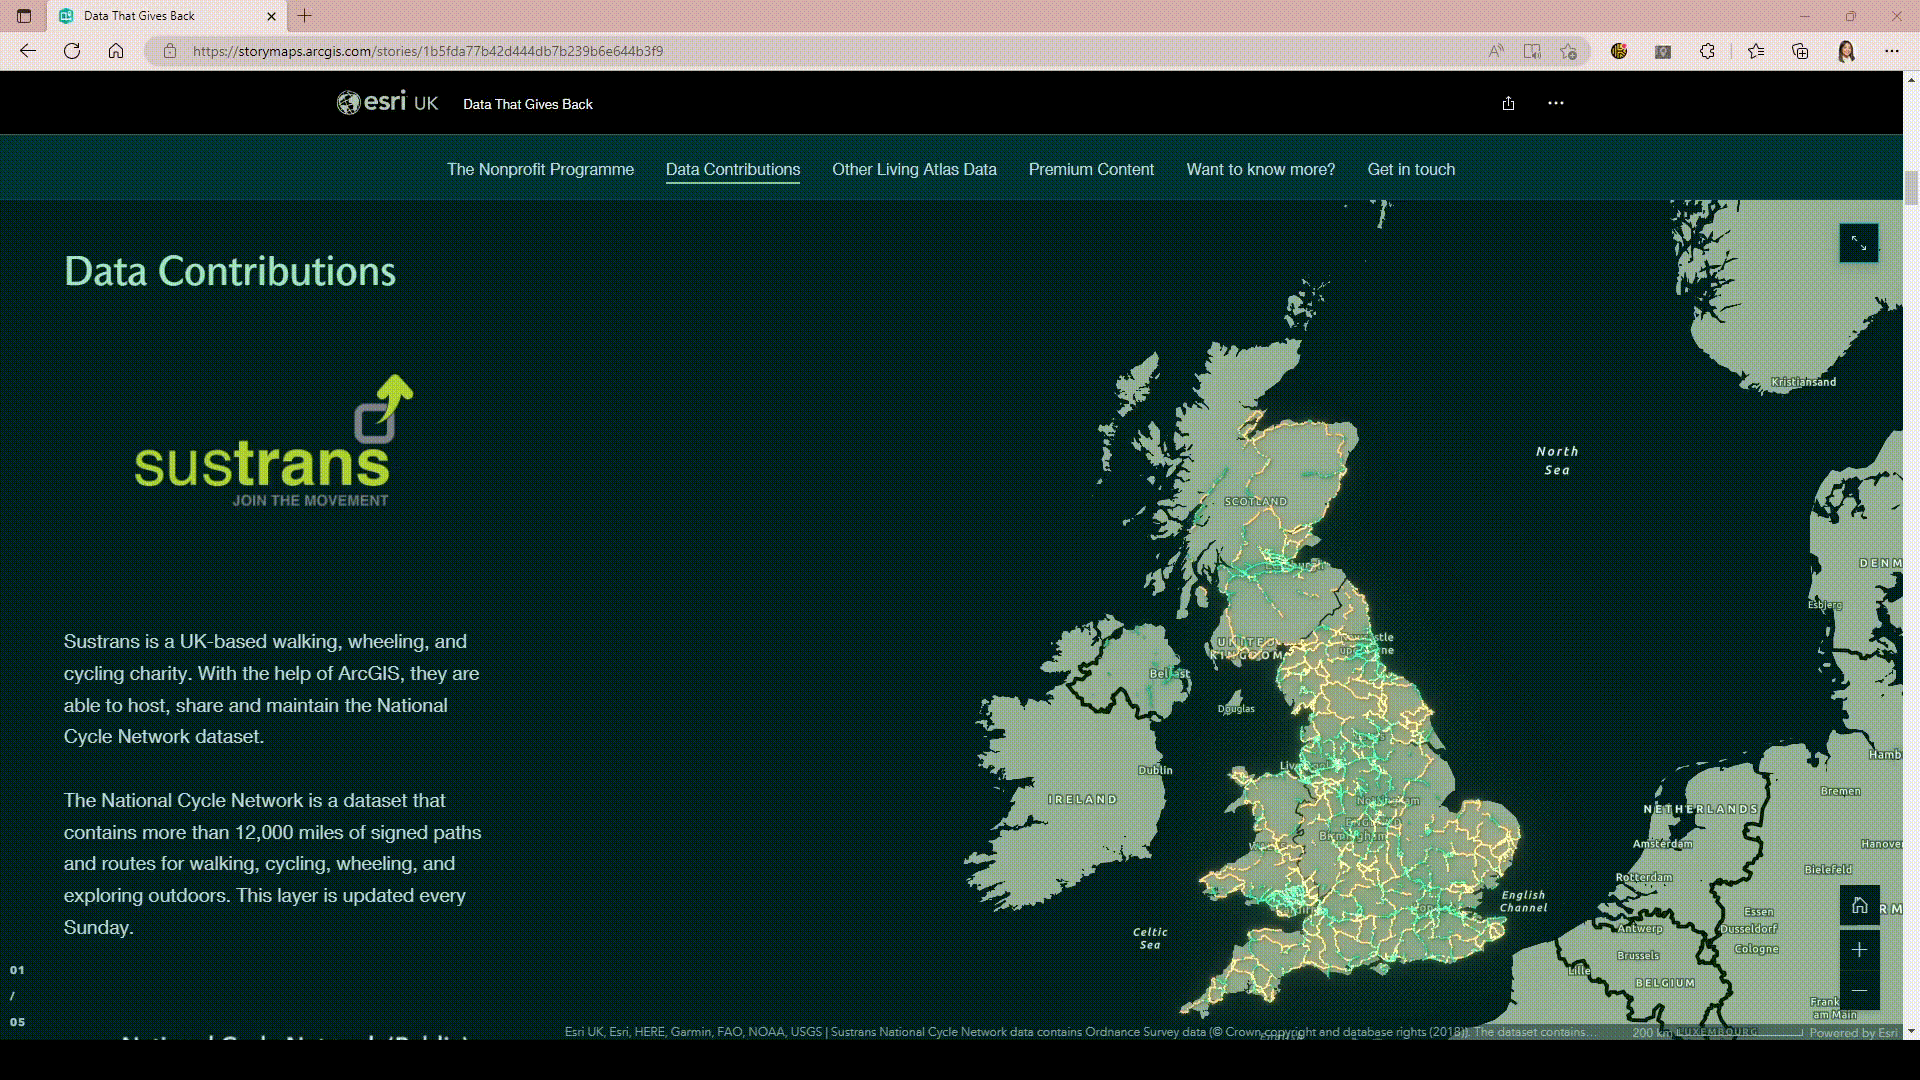
Data that gives back StoryMap highlighting Esri Content available for nonprofit organisations.
Why is geography important?
A geographic approach to problem solving leads to data driven decisions and sustainable results. Combining high-quality data and creating a visual output like a map/app helps you to identify unseen patterns and gain deeper insights. A map is also a unique, common language for us to communicate that is easier and quicker to comprehend than words or numbers. Improving these kinds of digital efficiencies in a charity are important when time and budgets are lacking.
So, geography is important as it’s the key to jumpstarting your project, acting on your mission and measuring your impact. Let’s explore some examples of non-profit organisations using geography and ArcGIS for their work:
- The Royal Society for the Protection of Birds (RSPB) uses StoryMaps to create these Carbon and Nature resources to engage the public about Nature Based Solutions.
- The Rivers Trust, who is behind the Catchment Based Approach (CaBa) leverages ArcGIS Hub to raise awareness of their initiative and increase exposure to their data.
- National Trust have created this web application to explore coastal land use change between 1965 – 2014.
- Sightsavers launched a Resource Portal to allow interested parties to browse and engage in their public facing data and applications
Data in Living Atlas is just the tip of the iceberg. To find out more on how charities and nonprofits are gaining value from ArcGIS, you can read some stories here. Or check out some of these stories from our 2022 Esri UK Annual Conference where National Trust and Ribble Rivers Trust talk about how a geographic approach has helped to further their mission.
What’s next?
Introducing Esri’s Nonprofit Programme…
The Esri Nonprofit programme offers nonprofits the chance to access data, technology, and resources to advance your mission. It provides the tools to bring location intelligence to your organisation through a low-cost, 1-year-term licenses for ArcGIS.
Taking your data one step further
To complement Living Atlas , Esri UK can also provide bespoke, high-resolution data from our premium data partners including Ordnance Survey, Planet, TravelTime and more. You can find out more about what’s available here or by contacting content@esriuk.com.
If you’re interested in finding out more about Esri UK’s Nonprofit Programme, please reach out to my co-author Harriet Gwilt (HGwilt@esriuk.com).
For more information on Living Atlas and the content available, check out these resources.
Interested in nominating your own data for the wider community? This StoryMap can guide you through the process. Alternatively, get in touch with our Living Atlas Curator on DataCurator@esriuk.com.