When you’re running late for work and trying to find shortcuts along your route, you’re using GIS. When organisations have digitised plans of their estate, also GIS. Biologists tracking animal migrations… You can guess where I’m going with this. So, what is this acronym and why is it important?
Geographic information systems, or GIS, is a collection of software tools for getting the most out of your spatial data. Spatial data is any data with a link to geography. This could be direct, like x,y coordinate pairs, or indirect, like when you have data associated with a location (e.g postcodes). GIS drives our ability to derive meaning from data, transforming it into information.
To better understand what this means, and the role GIS could play within your organisation, I’ve outlined five key concepts that underpin it so that you can feel more confident in your knowledge of GIS… or at least to get the GISt.
1. GIS is the where AND the why
GIS can capture, store, view, analyse and share data. Having all these functions makes GIS a powerful tool – a one stop shop for knowing where things are (geographic information) and how they relate to one another. This relational element provides organisations with location intelligence so they can solve problems.
For example, many users rely on mapping software, like ArcGIS, for suitability analysis – a process for finding the best location for something. Let’s say that you’re looking to open a new branch for your business. You have a region in mind, but you need to consider factors like size, price, and demographics. Using GIS, you can find sites (the where), and filter down the list based on your criteria (the why of picking one location over another).
For more on how we can use GIS, check out our website.
2. GIS data can be multidimensional
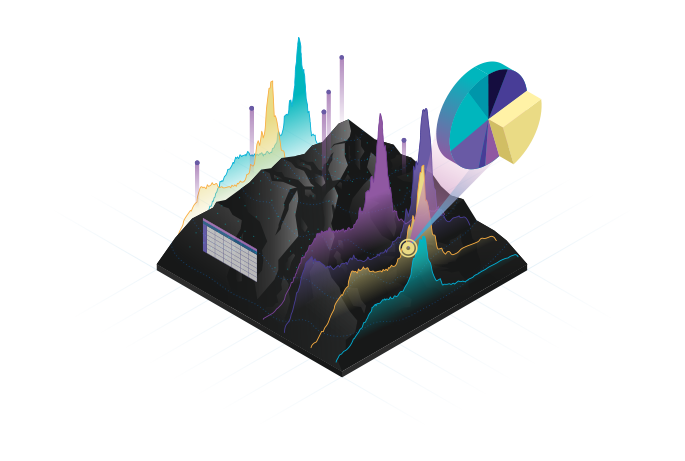
What do I mean by this? GIS integrates information of all sorts: 2D, 3D, or even 4D if it is linked to temporal (time) data. However, your data isn’t limited to latitude and longitude. Nonspatial data, commonly called attribute data, enriches datasets.
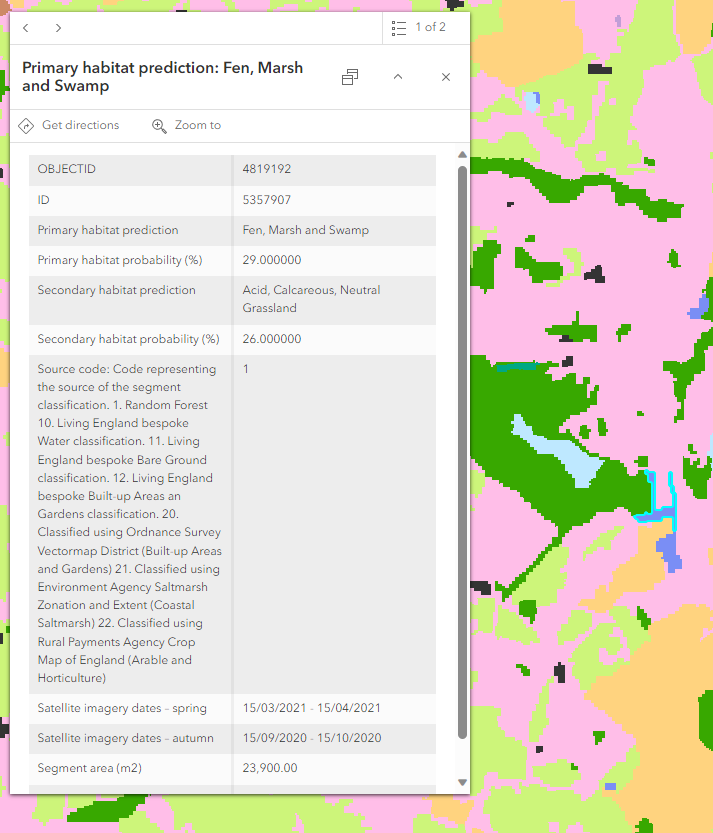
This window of information is called a ‘pop-up,’ which contains all the attributes related to the selected data point. Pop-ups are a common way to show information, such as in this web map in ArcGIS Online – our web-based GIS mapping software.
If spatial data is the where, think of attribute data as the what. This could be anything from a location’s name, the time it was collected, related population information, or even a photo taken in the field. GIS links all this together so that the relevant information is in one place, at the same time, for you to make meaning from. With the attribute data attached, end users can go “aha! You’re not just a dot on a map. You’re the last known sighting of a great spotted woodpecker!”
GIS gives a user’s data context to inspire their solution.
3. GIS doesn’t have one ‘look’
GIS is used to visualise data, which makes most people think of maps – often the navigational kind, but this is only one of the many options. You can make maps, either static or dynamic, 2D or 3D. You could also configure web applications or build reports. If you’re feeling inspired, check out our Map Gallery where we showcase the creative platform GIS can be, using ArcGIS.
The art of the possible with ArcGIS, from animations and stories to immersive web applications, from our Map Gallery.
This flexibility lets you communicate information in different ways for different audiences. GIS analysts, stakeholders, the public, you name it. My favourite part is that this makes GIS more accessible to people without geospatial backgrounds too.
4. GIS is interdisciplinary
GIS has a broad range of functions, and consequently a broad range of uses. It helps people make more informed decisions, which is valued across industries. You can see how diverse the use cases for GIS are by checking out our customer stories.
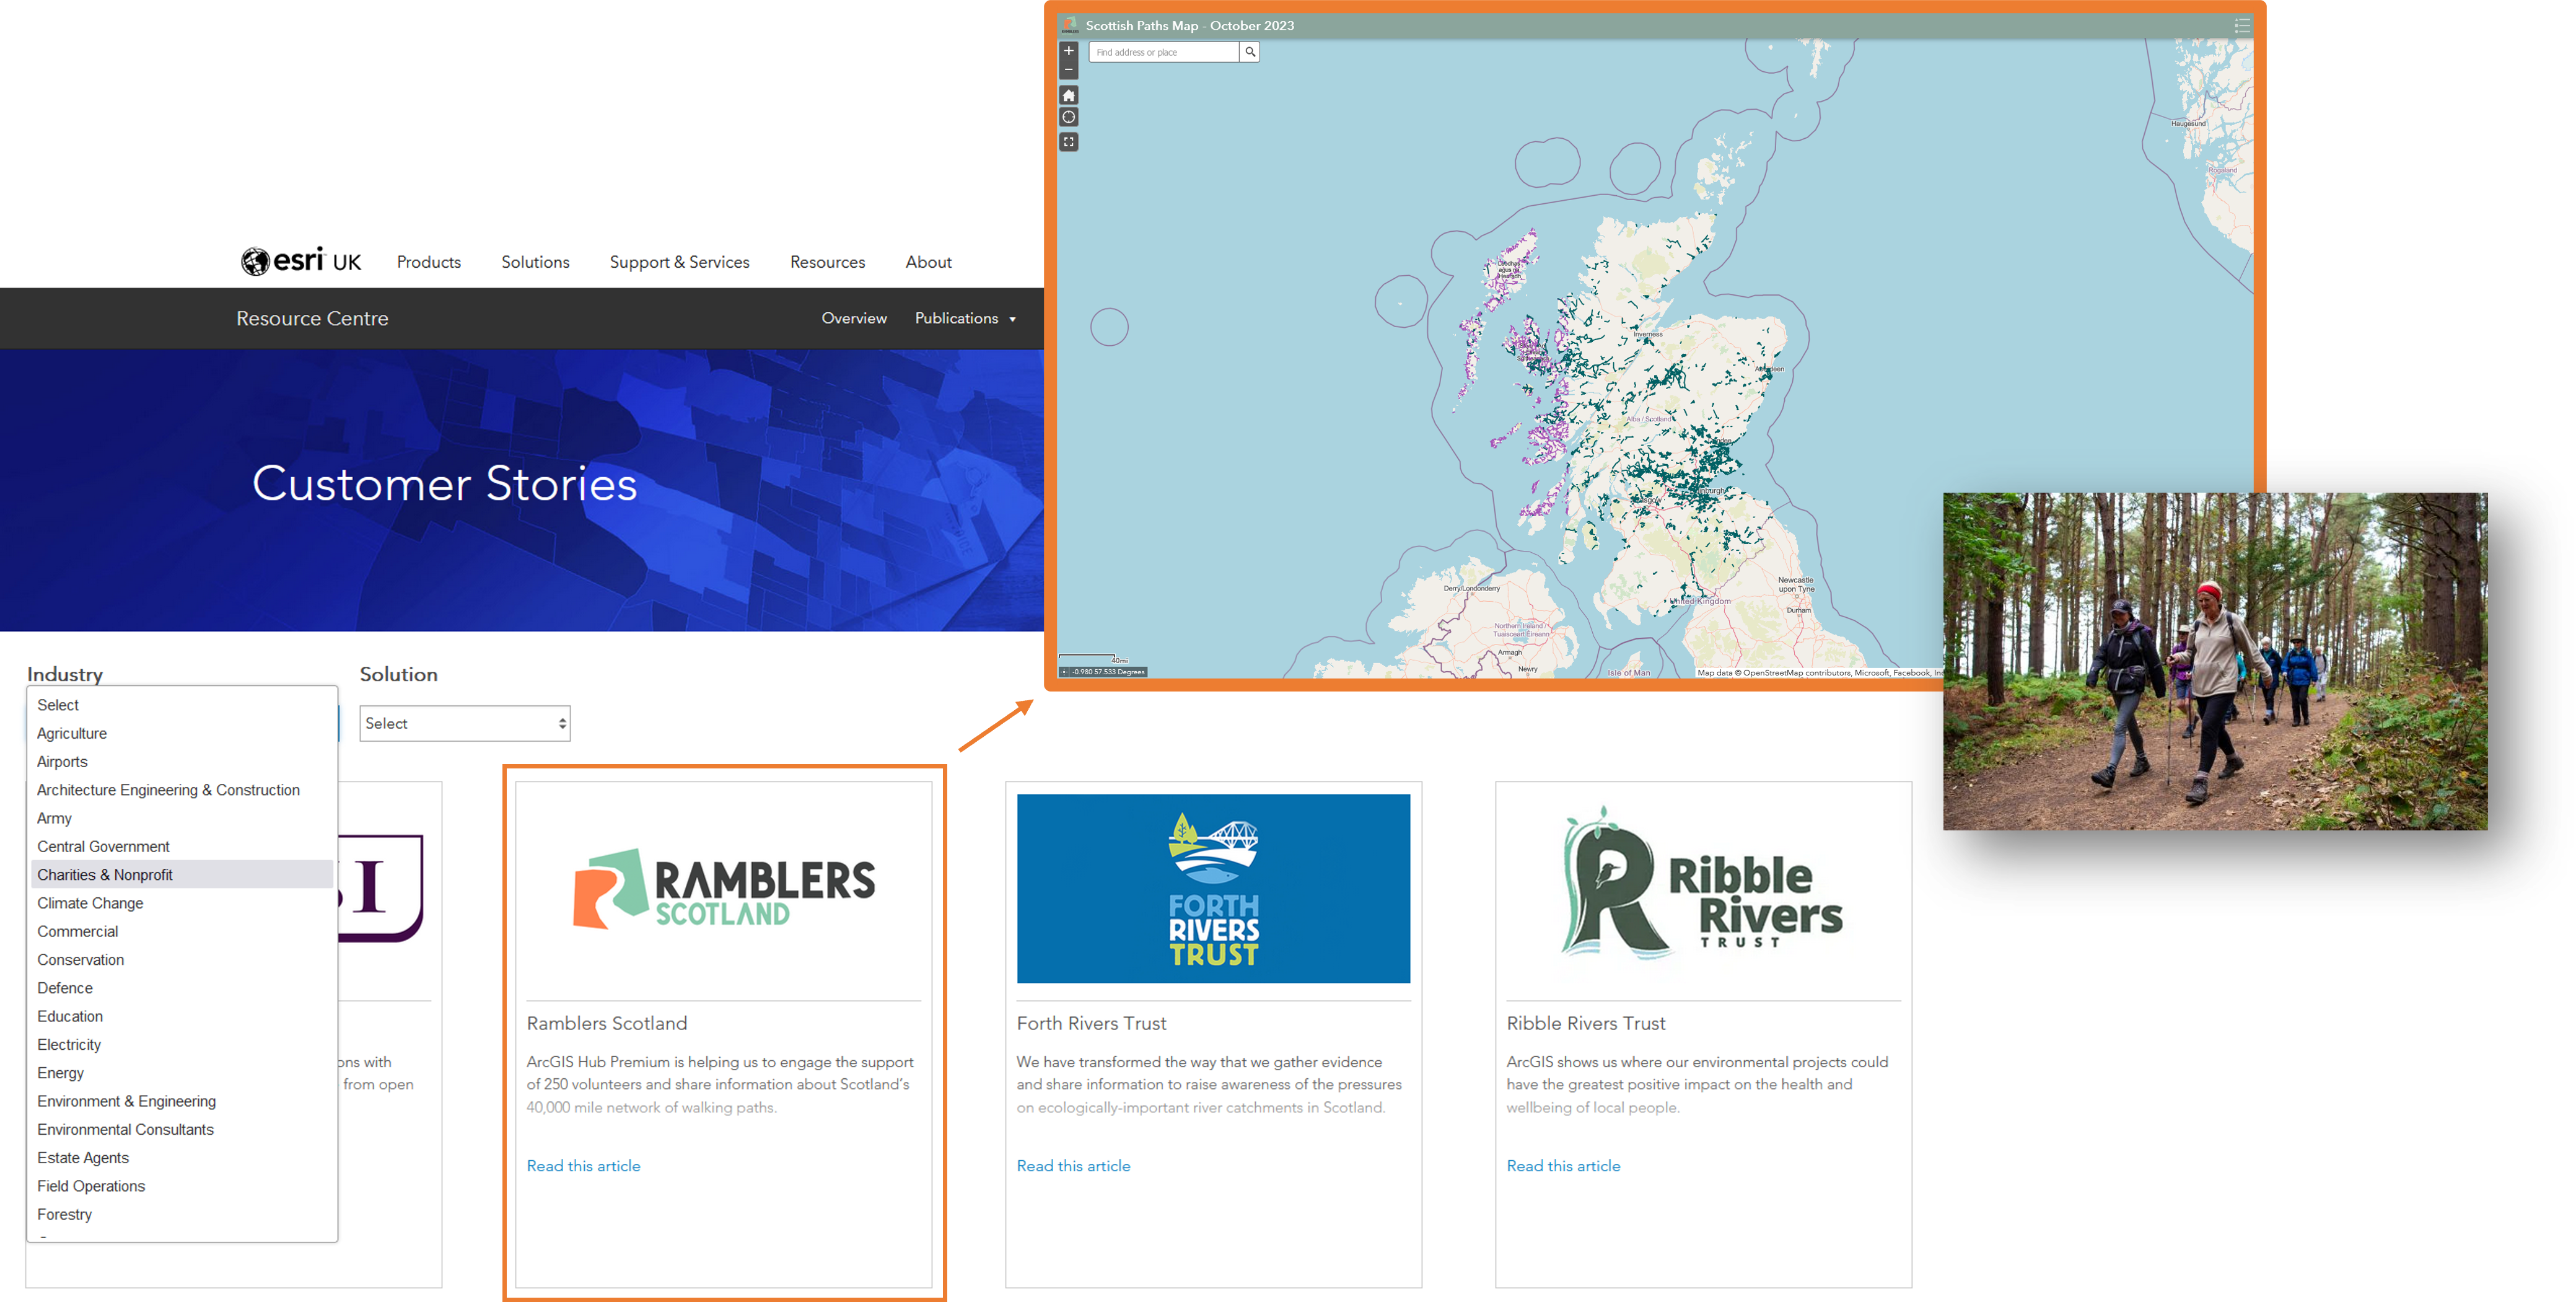
Just one example of many customer stories on their applications and success with GIS!
5. GIS is as strong as its data
Data lays the foundation for your decision making. Accurate and reliable data drives well-informed decisions. Going back to the suitability example, if your data isn’t up to date, you might accidentally pick a location that is already owned by another business, or a land plot that’s skyrocketed in price since the data was recorded. So, with whatever data you use, whether it is your own or externally sourced, ensure that it’s good quality. If you need data to compliment what you already have, like using population information to enrich a dataset, check out our global data library – the ArcGIS Living Atlas of the World.
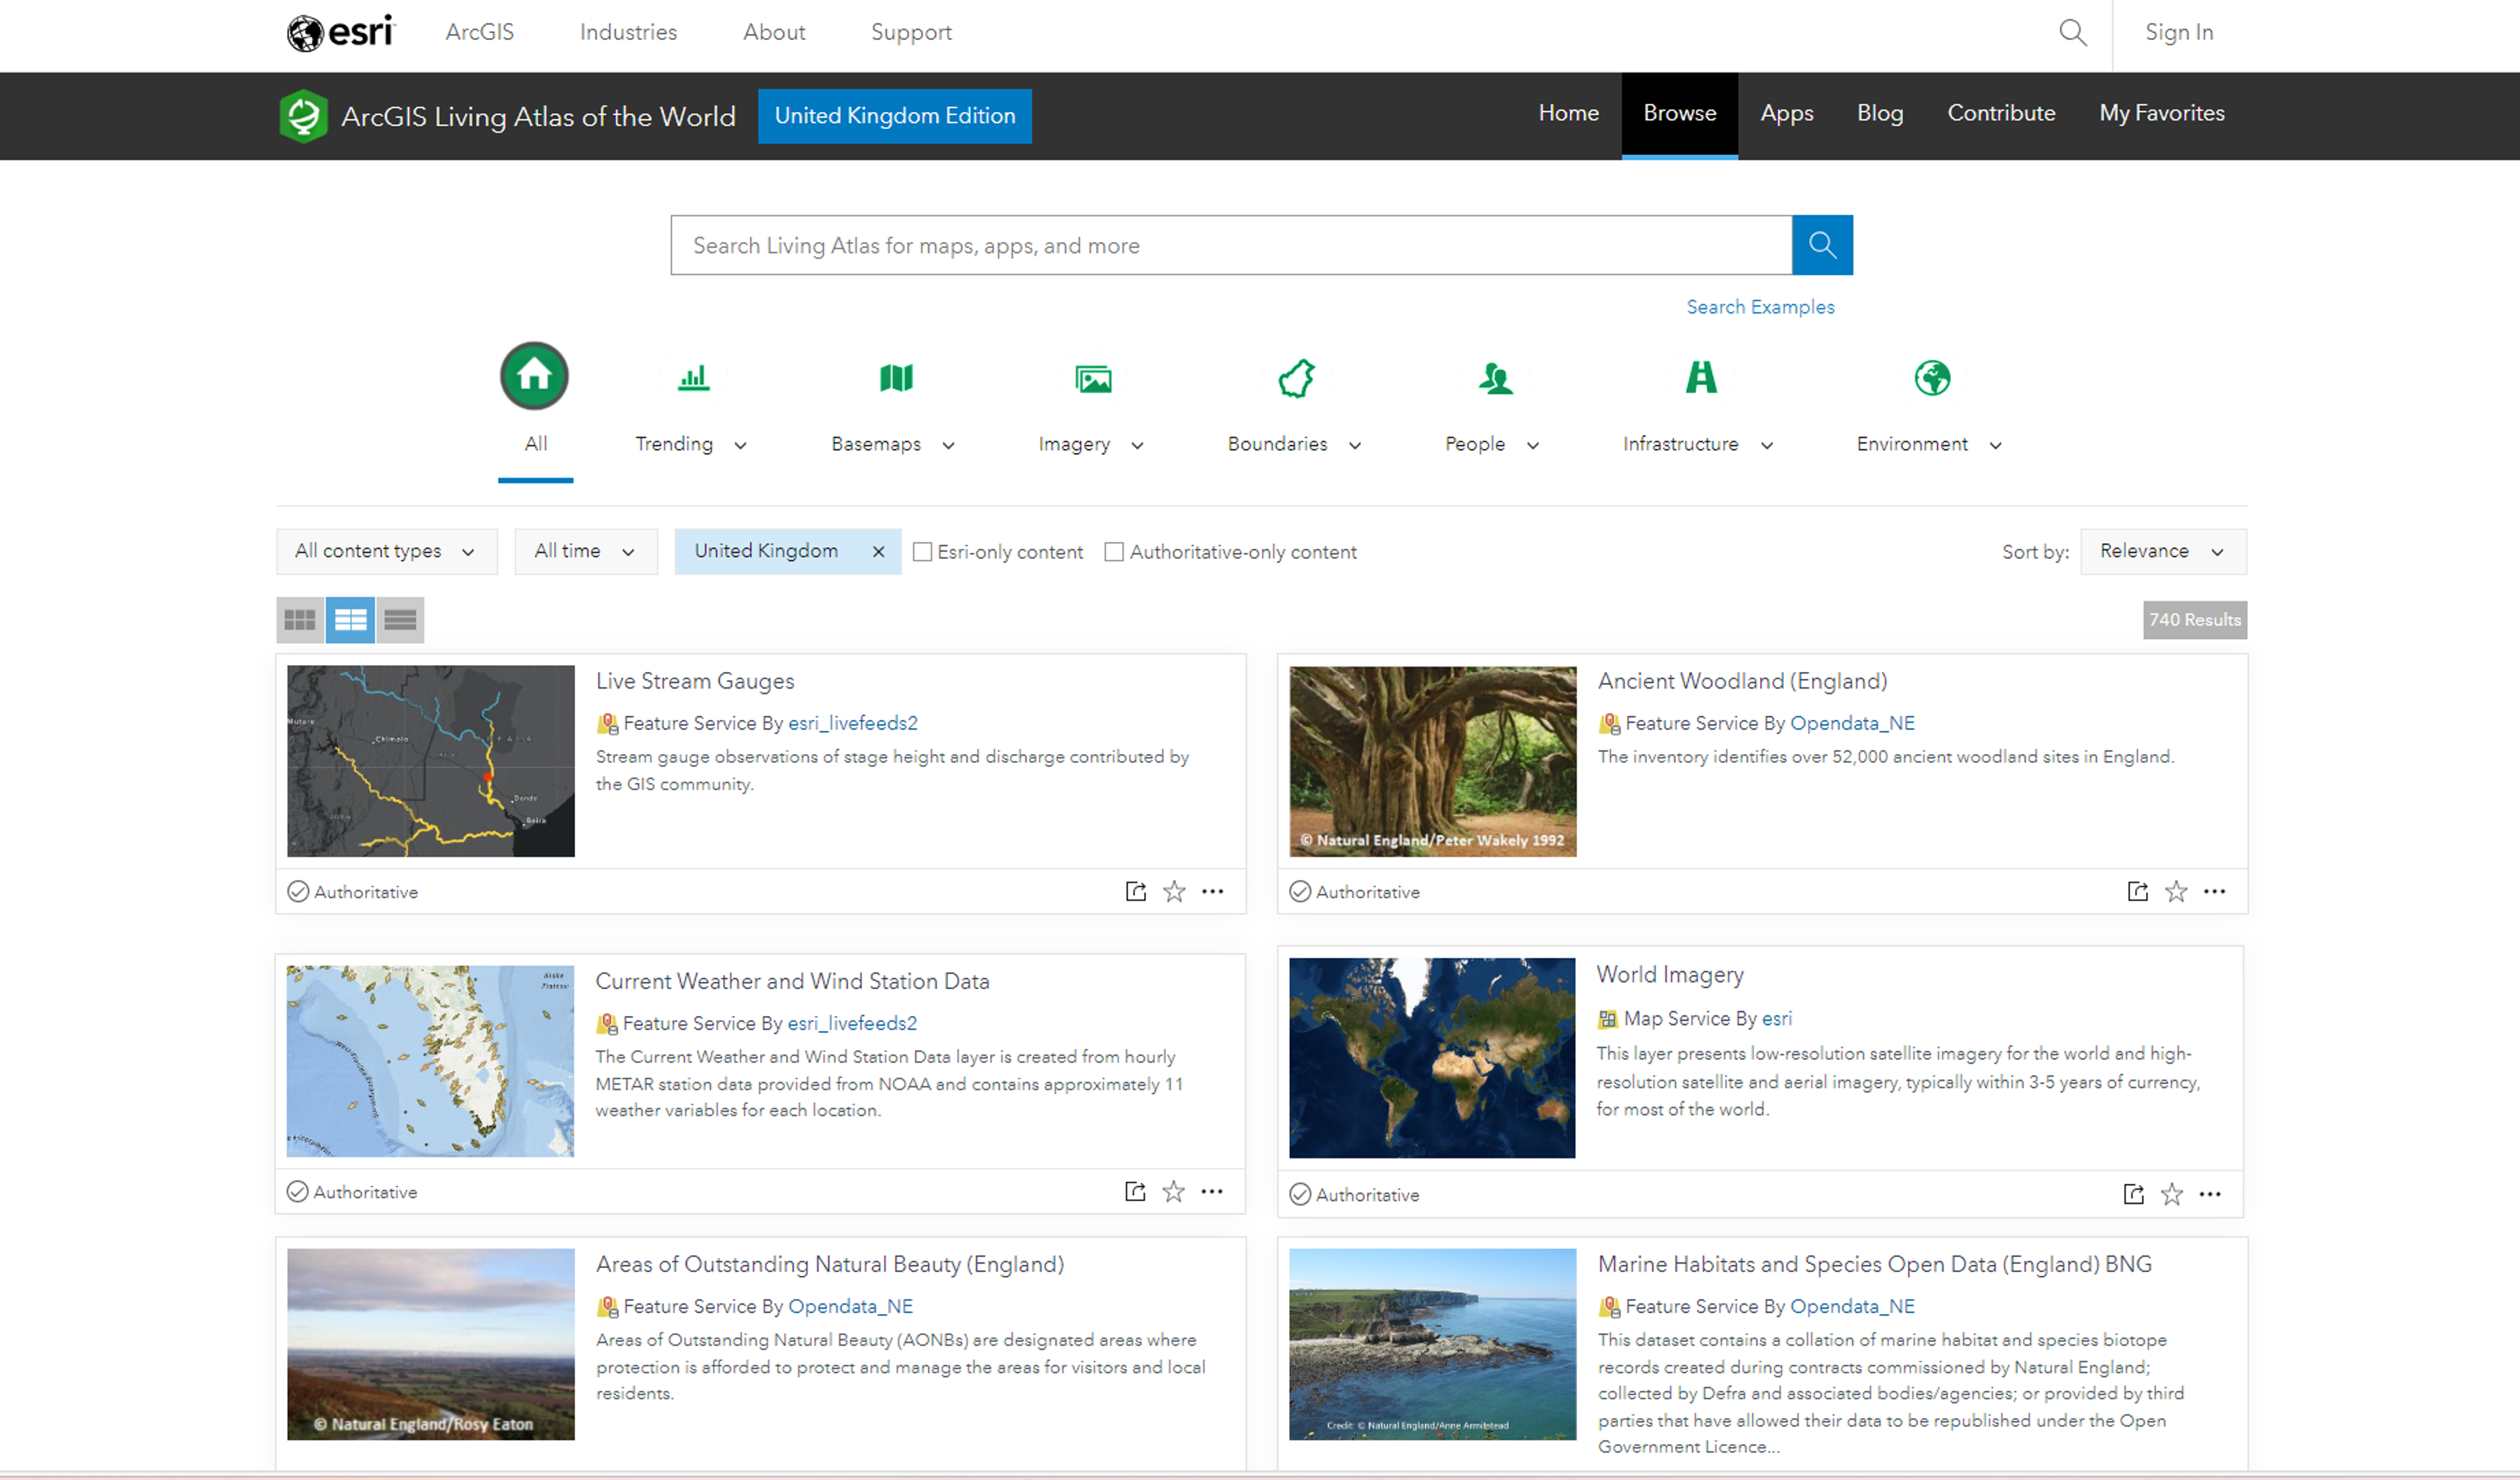
A glimpse of the data available within the Living Atlas.
What have we learned?
This isn’t meant to feel like a pop quiz, but I’m hoping this article has addressed what geographic information systems is. We’ve covered that:
1. GIS help users make sense of their data, from the where to the whys.
2. GIS uses data from across time, dimensions, and scales.
3. This data can be presented in a variety of ways for a variety of audiences.
4. These audiences span all industries.
5. To maximise the usefulness of your findings, start with reliable data.
These concepts show that GIS is not just a tool but a powerful resource to improve your understanding of the data and unlock new insights. The data is waiting for you, and GIS might just be the key.