Updates to the desktop, web and mobile versions of ArcGIS Business Analyst have further increased its potential for helping UK businesses make key decisions. Lets have a look at some of the new capabilities added to see what you could achieve with Business Analyst.
Web
Ever wanted to share your Business Analyst results in an interactive and visually appealing way? Now you can, thanks to a new workflow that allows Story Maps to be created directly from the ArcGIS Business Analyst Web App. Simply select the sites you want to showcase to your audience along with the attributes, infographics and reports you want to include and in just a few simple clicks a Story Map is generated. If you want to customise your Story Map further, you can do this from within the Esri Story Maps application.

One of my favourite features of Business Analyst is the ability to create infographics to show and visualise key data and statistics for a potential site location. Now, thanks to updates to the Business Analyst Web App, you can view several infographics side-by-side. This allows quick and easy comparisons to be made between various boundaries for a particular site or different sites altogether. You can also set a benchmark when making these comparisons, allowing you to quickly see how sites rank relative to a chosen location. In this example, I have set the site on the left side as the benchmark.
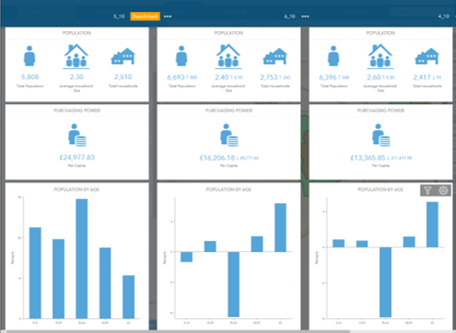
Comparing sites using the benchmark option.
A brand new Business Analyst widget was added to ArcGIS Web AppBuilder. With this, you can create reports and infographics on existing polygon features within a web app using either Esri standard or custom templates. In addition, you can use the widget to create new locations and generate buffers or drive time areas for both new and existing features.
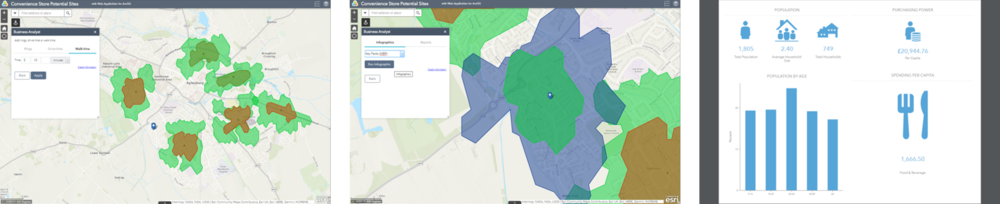
The Business Analyst widget for Web AppBuilder.
Mobile
Updates to the Business Analyst mobile app mean that you can now view suitability analysis results on the go. You can also add sites and fill in attribute data using your mobile device. This makes it quick and easy to run your suitability analysis models on newly identified sites using the Business Analyst Web App. In addition to this, you can also compare the attributes and statistics of 2 sites side-by-side, allowing you to understand the relative merits of potential sites whilst out in the field.
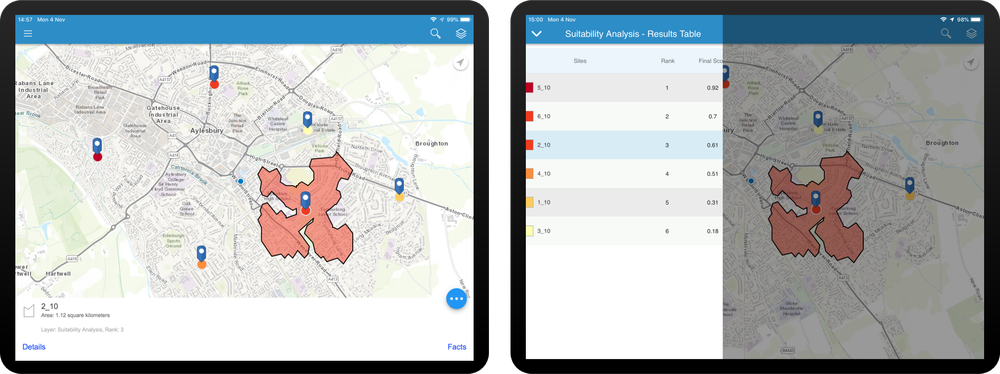
The Business Analyst mobile app.
The Business Analyst mobile app also now gives you the ability to upload and view 360 degree and panoramic photos when completing a site’s attribute information. Simply use your phone’s camera app to capture panoramas or create 360 degree photos using an app such as Panorama 360, then upload them to your site in the Business Analyst mobile app. This helps to give a more immersive view of your potential sites.
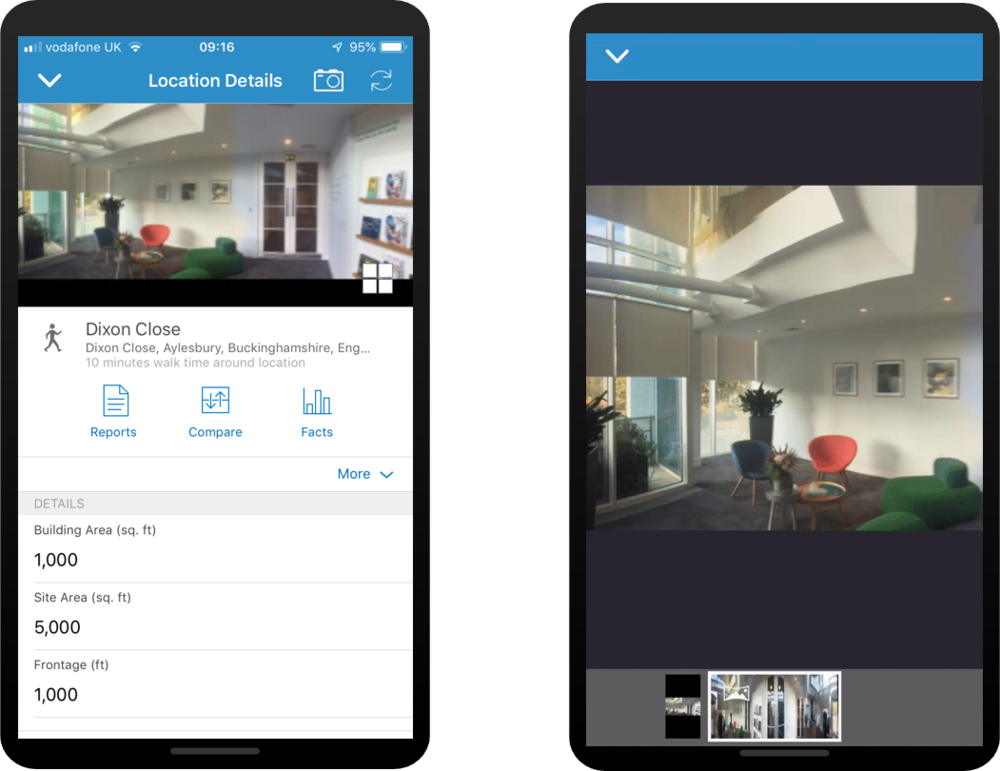
Adding a panoramic photo.
ArcGIS Pro
Business Analyst for ArcGIS Pro users now have access to a brand-new tool that uses the Huff Model to analyse the market potential of new sites. The tool predicts the sales potential of a site by looking at an area’s demographic and economic statistics alongside impact of nearby competitor stores, the data for which can be supplied either locally or from ArcGIS Online. Having considered these factors, the tool generates a probability surface showing the sales potential of an area.
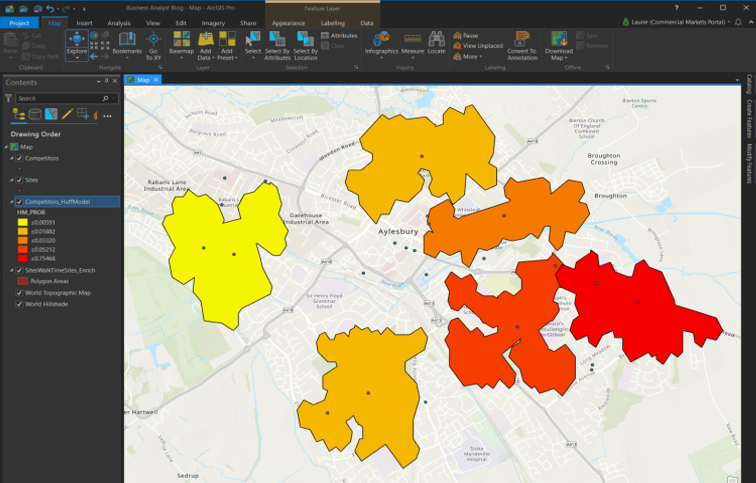
Using the Huff Model to analyse the market potential.
To understand how well you are reaching your market areas, you can use the Calculate Market Penetration tool recently added to Business Analyst for ArcGIS Pro. This compares customer data, such as the number of customers and spending totals, against a store area’s demographic variables such as population. The tool outputs a layer showing your market penetration as percentages, allowing you to identify where stores are performing well or where there are gaps in the market.
That's all for this blog; I hope it has shown how these new capabilities in ArcGIS Business Analyst could help with your business decision making. If you want to find out more, head over to the documentation here.
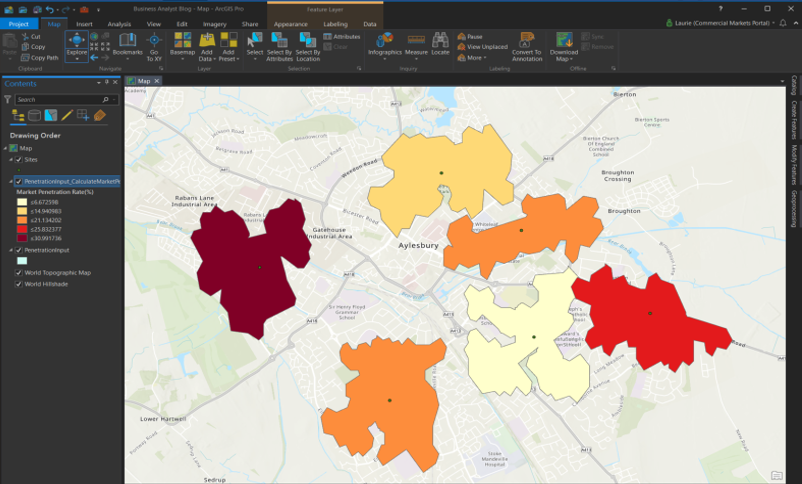
Using the Calculate Market Penetration tool.
That's all for this blog; I hope it has shown how these new capabilities in ArcGIS Business Analyst could help with your business decision making. If you want to find out more, head over to the documentation here.