Blog Archives

NextTech: Mapping ‘Human Weather’ Patterns with Geospatial Analysis
Backed by the pattern-finding power of geospatial analysis, GIS technology can help businesses identify customers scattered by the pandemic.
The pandemic has reshaped consumers’ shopping, eating, and entertainment habits—and rerouted the rhythms of our daily lives.
The office worker who’s no longer commuting isn’t frequenting her favourite downtown corner café; instead she’s heading to a suburban chain coffee shop with a drive-through window. A father and daughter have forgone after-school ballet classes in the studio in favour of yoga classes in the park. Families stuck in the house are diving into home improvement projects and visiting big-box stores that offer a seamless omnichannel experience, complete with curbside pick-up.
Data scientists call the sum of these movements “human weather.” It represents the spatial patterns and routes—revealed in anonymized location data from smart devices like phones—that area residents follow as they work, play, and shop. Businesses have long studied meteorological reports to shift supply chains around natural disasters or stock up on products like salt and shovels in advance of a winter storm. Similarly, human weather patterns help executives interpret and respond to trends in customer behaviour. And few events have changed consumer behaviour as profoundly as the COVID-19 pandemic.
One technique for making sense of human weather is geospatial analysis, which combines the pattern-finding ability of big data analytics with the location context of GIS, a geographic information system. Data-savvy companies are embracing the insight created by geospatial analytics—a type of location intelligence—as a way to serve customers where they are, even in light of the dramatic changes triggered by the pandemic.
Location intelligence can inform business decisions such as what hours to keep, which amenities to offer, and how to advertise—choices that can help companies engage customers in an era of social distancing and touchless retail. Especially when layered with demographic or behavioural insight, geospatial analysis can help a company create continuity in the midst of a historic economic challenge.
Article snapshot: Geospatial analysis reveals how human weather and customer patterns are changing during the pandemic for big box retailers, restaurants, entertainment venues, malls, and other businesses.
Where Have All the Customers Gone?
The video below shows a geospatial analysis of human weather in a hypothetical scenario, revealing pandemic-related changes among visitors to an outdoor resort. The analysis begins with a directional distribution of customers, identified by the orange ellipse. This shows the general area where customers live. Using geospatial analysis, a location analyst can then identify the counties where business is down, with darker blue areas indicating steeper customer declines.
Adding a layer of data helps an executive understand the context of those broad trends: orange dots indicate generally how many people from that region are visiting the business. With that insight, a sales manager can better calibrate the threat posed by drop-offs from visitors in specific areas.
For instance, a county might show up as dark blue, signalling a point of concern, but feature a smaller orange dot, revealing that the number of customers hailing from that county was already minimal. Meanwhile, a big decline from a densely populated region like Seattle might indicate an opportunity for corrective measures like increased marketing and promotions.
Laying the Groundwork for Targeted Growth
As the analysis progresses, a geospatial perspective makes it possible to incorporate key insights about consumer behaviour and location that, when transposed with pre- and post-COVID activity levels, yield powerful conclusions.
In the hypothetical analysis, movement data shows that three demographic groups account for the biggest declines in visits: Green Acres, or self-reliant types from rural enclaves; the Great Outdoors, which includes active empty-nesters; and Savvy Suburbanites, comprising wealthier older couples. As the map shows, these groups tend to cluster in various ZIP codes and block groups (the smallest geographic unit used by the Census Bureau).
Executives might focus on winning back these groups once the pandemic recedes. With location intelligence, business leaders can craft a strategy that speaks to those customers’ unique preferences, targeted in their specific regions.
Budget for TV and radio advertising could be concentrated in the areas outlined in the map, paired with a direct-mail campaign offering discounts or other incentives. Executives could also expand hours and tailor prices and amenities to suit the lifestyle habits of people in the three groups, who are largely at or approaching retirement age.
Other layers of information such as the penetration of vaccine distribution, or sales at restaurants with outdoor seating, could signal places where customers are starting to reengage with pre-COVID recreational behaviours.
Just as important as knowing where a business has lost customers is knowing where it hasn’t. This geospatial analysis technique can map the demographic and psychographic groups that will keep coming back to a venue no matter what. Leaders can take necessary steps to maintain this core customer group while dedicating more aggressive measures to growth customers or niche customers.
Staying Ahead of the Human Weather
Geospatial technology could be leveraged across industries to give companies and small businesses direction on how to mount a post-pandemic comeback. Grocery store executives can analyse human weather to track whether certain customer groups have transitioned to lower-cost chains, and retool practices accordingly to win them back.
A fast-casual restaurant could redraw its delivery area to recapture once loyal in-person customers who spent the most. A newspaper or media agency might use geospatial analysis to identify customer shifts for advertisers, and recommend adjustments to ad targeting.
Many companies analyse core customer or non-customer groups when they first enter a market, then neglect to revisit the data and findings. A disruption on the scale of the pandemic shows why it’s smart to know who a business’s customers are and where they’re coming from, especially as times and people change. The location intelligence delivered by human weather and geospatial analysis puts those changes on the map.
This article was originally published in the global edition of Wherenext

NextTech: Finding the Best Locations for Dark Stores
With brands converting stores to mini-fulfillment centres to meet online demand, executives need a new way to analyse markets.
A store without shoppers might sound like an oxymoron or a good recipe for going out of business. In fact, so-called “dark stores”—closed to the public yet lined with fully stocked shelves—are becoming a key new tool for retailers in the COVID-19-era
Dark stores are usually conventional shops that businesses convert into mini-fulfilment centres in response to changing consumer habits. As families move their purchasing online and rely more on delivery or pickup, some store locations become more valuable by closing in-store shopping and acting as online order fulfilment centres and pickup locations. The shift allows companies to concentrate supplies in facilities where demand for contactless shopping is skyrocketing.
It’s a trend that retailers like Walmart have been experimenting with since last year to meet the rise in e-commerce, which the pandemic has kicked into high gear. In September, Amazon-owned Whole Foods opened its first dark store in Brooklyn dedicated solely to serving delivery orders. While resembling a typical store, it has longer aisles designed for easy navigation by employees, and lacks fixtures like salad bars and checkout displays.
Article snapshot: For business locations edging toward unprofitability, executives once had to choose between continuing operations and closing the doors. Now they have a third option, and location analysis is helping them make profitable decisions. For other businesses, an uptick in online shopping has inspired creative uses of brick-and-mortar stores.
Why It Pays to Go Dark
At Whole Foods, online orders in Q2 tripled year over year, prompting the company to increase delivery capacity by 160 percent in part by utilizing customer-less locales. Grocers like Giant Eagle and Kroger are taking a similar path, and other sectors are catching on too: Bed Bath & Beyond announced plans to convert a quarter of its stores into regional fulfilment centres.
While dark stores can help brands design more agile networks to meet demand, they also complicate traditional market analysis. These “micro-fulfilment centres” must be sited appropriately, and business leaders need to be able to defend their decisions not to operate the stores as usual, or shut them down altogether. Whether a dark store is just for delivery, curbside pickup, or both creates additional wrinkles.
These complexities point to the need for a strategy backed by location intelligence. A geographic information system (GIS) is uniquely equipped to help executives study the visual layout of trade areas, explore what-if scenarios, and determine the best use for each site. Combining layers of customer and location data with tools like drive-time analysis, GIS-driven smart maps help executives incorporate dark stores into their market plans, turning disruption into advantage.

CRM data can identify customers who shop exclusively on digital channels. Retailers that understand where those customers are can position stores to efficiently serve the most customers.
Crafting a Dark Store Strategy
Retailers exploring this option should start by examining pre-COVID-19 patterns in consumer behaviour. A GIS-backed dashboard loaded with historical shopping data reveals where a brand’s online sales have been growing or decreasing in relation to in-store sales.
By studying those trends against a geographic backdrop, executives can make important deductions. They can identify which stores are seeing the strongest in-person shopping and are candidates to remain open or reopen in the conventional format. Such a map also makes it easier to single out stores that are not performing well by either metric—places where a company may want to cut its losses.
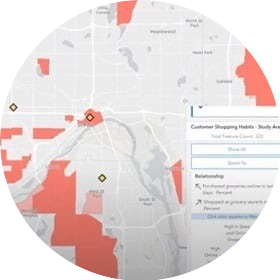
This video shows how location technology facilitates the analysis. The initial map reveals how consumers in certain areas shop, with colours indicating their preference for in-store or online orders. Shoppers in the red areas tend to rely heavily on ecommerce, while shoppers in the aquamarine areas prefer to visit a store. A location analyst can add the company’s locations to the map (designated as yellow diamonds), then isolate certain groups of shoppers to get a sense for which locations might be dark store candidates.
What’s left in a given trade area are the best options for dark store conversions, though executives will want to deepen the analysis with other variables before making a final decision. For example, some dark stores are best suited to densely populated areas where delivery times will be short and pickups more convenient. Others might thrive in areas such as wealthy suburbs, where customers are more dispersed but are shopping online in higher numbers. Dark stores with increased availability and quicker turnaround in these locations can give a brand the edge on competitors.
A drive-time analysis shows which stores will have the fastest delivery routes in a market area based on traffic, highway access, and related factors. Data about COVID-19 case rates and regulations could provide context on why online shopping has dipped or spiked in certain areas.
Location intelligence sharpens predictive analysis as well. Business executives might analyse data on past seasons to anticipate holiday shopping patterns, a factor that could influence the decision to run a location as a dark store, perhaps even temporarily.
Help with Location Decisions
For a step-by-step guide on using location intelligence to choose dark store locations, visit this StoryMap.
Market Planning for a New Age
Dark stores aren’t without risks. If implemented poorly, they can misalign supply chains and threaten to underserve or overserve markets, increasing risk at a time when many brands are already struggling amid the pandemic.
This reality underscores why such decisions shouldn’t be made on instinct alone. Through data analysis, GIS technology helps executives assess retail trends like dark stores, better positioning a brand for the post-COVID future. Markets don’t operate in a vacuum, and strategic planning shouldn’t, either. Location intelligence helps decision-makers see the contours of the playing field—as it looks today and might look tomorrow.
This article was originally published in the global edition of Wherenext

NextTech: Mapping the Business Impact of Air Pollution
Air pollution is not only a health hazard, it's also bad for business. A new tool helps executives weigh its effects on market development.
More than ever, new IoT sensors and mapping technology are showing executives exactly how air pollution affects business—and it can be measured in the trillions of dollars.
The COVID-19 pandemic has had varying effects on air pollution. In many places, shutdown orders have throttled economic activity, causing emissions to drop. Meanwhile, the US EPA temporarily relaxed enforcement of polluting activities during the coronavirus outbreak, even as some areas report persistent poor air quality. And studies are beginning to connect poor air quality with higher death rates from COVID-19. Sometime in the near future, the COVID-19 upheaval will recede, leading to a resurgence in economic activity and a return to normal conditions. Before that time comes, it’s worth examining the cost of pollution.
The impact of poor air quality on the environment and human health is worrying enough: 4.2 million deaths a year occur as a result of exposure to outdoor air pollution, according to the World Health Organization (WHO). Urbanisation, a trend moving quickly through Asia and Africa, is accelerating the ill effects of air pollution, which can lead to lung cancer, strokes, and heart disease, among other maladies. Today, 80 percent of urban dwellers are exposed to pollutants that exceed the WHO’s guideline limits, with the highest concentrations in low- and middle-income areas.
Now, economists and data scientists are tracking the costs businesses sustain through disruption to employee health and consumer buying habits. The cost of air pollution in the form of work absence, premature deaths, and years lost from life reached $2.9 trillion in 2018, or about 3.3 percent of global GDP, according to the Centre for Research on Energy and Clean Air. Pollution’s effect on consumer spending is no less startling, with air quality likely influencing billions of dollars’ worth of transactions.
Such troubling metrics have led executives to use a geographic information system, or GIS, to track air pollution, which can vary as much as eight times within the span of a single city block. With location technology decision-makers gain a clearer understanding of where air quality could be hurting employees, customers, and the bottom line.
Article Snapshot: Studies show that high levels of air pollution suppress economic activity, as residents choose to stay indoors. A new mapping tool helps business planners understand the air quality index (AQI) in locations around the world.
Air Pollution in Market Analysis
Market development typically involves learning everything about a location—the elements that could impact business success and employee quality of life. That process is now expanding to include air quality considerations.
In the past, the focus has been on demographics of a city or region—learning about the people, their interests and purchasing habits, and whether the area is growing or stagnating. But with IoT sensors and technology like GIS, which displays layers of complex data on smart maps, executives can now also visualise how business health and sustainability may play out. Depending on the industry, air pollution could prove an essential factor in market assessment, on par with consumer brand affinity or access to transportation.
Being able to see the levels of air pollution in a given region, and how they differ from nearby areas, yields clear advantages for business leaders. Those levels can have a direct impact on business health. For example, researchers using GIS and statistical programming recently determined how consumer spending fluctuates in relation to levels of airborne pollutants. Their analysis of data from 12 Spanish provinces showed that consumers were spending $29 million to $48 million less on days when ozone pollution was 10 percent worse. Just a small reduction in ozone pollution and particulate matter pollution, the study found, would result in increased consumer spending of between $19 billion and $30 billion annually. Scale that beyond a dozen Spanish provinces and it’s not difficult to see the amount of business activity at stake.
Making the Invisible Visible
Through a GIS application that reveals worldwide air quality index (AQI) readings, a business executive can add context to decisions such as where to build a distribution centre, whether to enlist a new contract manufacturer, and when or where to open a pop-up store. From North America to East Asia, a user can zoom in on a particular region or type in an address and instantly see the AQI ratings.
This short video offers an example of what this NextTech might reveal.
Using this technology, executives can make up-to-date, informed decisions about areas with air pollution. They can protect the health of employees and economic vitality, or even lobby for improvement in places where the company maintains operations. And since pollution can vary dramatically within small areas, planners can add localised datasets to their analysis when it’s time for detailed planning. Monitoring levels of air pollution geographically, in conjunction with factors such as urbanisation, can give a company the edge in choosing the safest and most secure spots for business growth.
Powerful Tools for a Complex World
A recent study in the journal Nature underscores the need for tools that condense complex data into an intuitive visual form. The report shows how air pollution can literally be a moving target, travelling like weather across state lines.
Through GIS apps, executives can see simultaneous displays of complex data layers including AQI readings, historical patterns, weather, and IoT-generated real-time feeds. This level of location intelligence supports planning to keep employees, customers, and business operations healthy.
This article was originally published in the global edition of WhereNext.